

Abstract
Aims
To individualize treatment, phenytoin doses are adjusted based on free concentrations, either measured or calculated from total concentrations. As a mechanistic protein binding model may more accurately reflect the protein binding of phenytoin than the empirical Winter–Tozer equation that is routinely used for calculation of free concentrations, we aimed to develop and validate a mechanistic phenytoin protein binding model.
Methods
Data were extracted from routine clinical practice. A mechanistic drug protein binding model was developed using nonlinear mixed effects modelling in a development dataset. The predictive performance of the mechanistic model was then compared with the performance of the Winter–Tozer equation in 5 external datasets.
Results
We found that in the clinically relevant concentration range, phenytoin protein binding is not only affected by serum albumin concentrations and presence of severe renal dysfunction, but is also concentration dependent. Furthermore, the developed mechanistic model outperformed the Winter–Tozer equation in 4 out of 5 datasets in predicting free concentrations in various populations.
Conclusions
Clinicians should be aware that the free fraction changes when phenytoin exposure changes. A mechanistic binding model may facilitate prediction of free phenytoin concentrations from total concentrations, for example for dose individualization in the clinic.
Keywords: fraction unbound, free, in vivo, phenytoin, protein binding
What is already known about this subject
Phenytoin is a pharmacotherapeutic cornerstone for treatment of epilepsy. Dosing individualization of phenytoin is hampered by nonlinear pharmacokinetics and variable protein binding.
What this study adds
We show that protein binding of phenytoin is concentration‐dependent and that the traditionally used Winter–Tozer equation to predict free concentrations is inferior compared to a mechanistic protein binding model.
1. INTRODUCTION
Phenytoin is an effective drug for treatment of generalized and focal seizures. It putatively acts by causing voltage‐dependent block of voltage gated sodium channels.1 Phenytoin is, however, considered a drug with a small therapeutic window: low exposure may result in inadequate therapy and high exposure may even lead to serious neurological side effects. Careful dose titrating is, thus, warranted to prevent inadequate drug exposure. There is, therefore, general consensus that dosing of phenytoin should be individualized based on therapeutic drug monitoring (TDM).2 For purposes of TDM, a therapeutic range of 10–20 mg/L is usually advocated for the total plasma concentrations and a range of 1–2 mg/L for the free plasma concentrations, assuming a 10% free fraction of phenytoin on the population level.2, 3 Dose individualization of phenytoin is hampered by its nonlinear pharmacokinetics, its variable protein binding and drug–drug interactions. In the therapeutic range, the elimination pathway of phenytoin can become saturated and an increase in dose may result in more than dose‐proportional increases of plasma concentrations.4 Furthermore, phenytoin is highly, yet variably, bound to serum albumin.5, 6 As the free phenytoin concentration is responsible for the pharmacological effect, measurement of free concentrations for TDM purposes is preferred over measurement of total serum concentrations.2 However, in routine clinical practice, often only total concentrations are measured, since this is associated with less cost, a faster time to results and simpler analytical procedures compared to the quantification of free concentrations. As variation in serum albumin concentrations is the main driver for variable protein binding of phenytoin, total concentrations are often corrected for hypoalbuminaemia to interpret measured concentrations in absence of a measured free concentration. The Winter–Tozer formula has been the gold standard for this purpose in recent decades.7 With this formula, the free phenytoin concentration may be approximated, based on the total concentration, serum albumin concentration and knowledge on the presence of severe renal dysfunction (SRD), as uraemic toxins may displace phenytoin from albumin.8
The predictive performance of the Winter–Tozer equation has often been challenged as factors other than albumin or severe renal dysfunction are known to impact the free fraction of phenytoin.9 For example, concomitant valproic acid use and temperature of sample handling are known to impact the free fraction of phenytoin,10 as valproic acid may displace phenytoin from albumin and the phenytoin–albumin dissociation constant is temperature dependent.11 Furthermore, the empirical Winter–Tozer equation assumes a concentration‐independent free fraction and, thereby, potentially ignores nonlinear binding kinetics.12 Although several groups have investigated the free phenytoin pharmacokinetics in population pharmacokinetic models,13, 14 as it stands, no mechanistical model has thus far been developed for the in‐vivo phenytoin binding kinetics of phenytoin. As, from a theoretical standpoint, a mechanistic protein binding model may more accurately reflect the protein binding of phenytoin than an empirical model, e.g. the Winter–Tozer equation, our aims were to: (i) develop a mechanistic protein binding model for phenytoin; and (ii) to compare the predictive performance of the mechanistic model with the Winter–Tozer equation. Translating the findings of such a mechanistic model may facilitate improved predictions of free phenytoin concentrations from total concentration measurements for purposes of dose individualization in the clinic.
2. METHODS
2.1. General approach
We collected development and validation datasets with phenytoin protein binding data from routine clinical practice. The development dataset was used to develop a mechanistic model for phenytoin protein binding. External evaluation was then performed with the validation dataset from the same clinic and 4 other datasets. For this purpose, the predictive performance of the mechanistic model was compared with that of the Winter–Tozer equation.
2.2. Data collection
We collected 1 model development dataset and 5 validation sets (validation dataset 1–5) from routine clinical practice, containing paired observations of total and free phenytoin concentrations and information on the relevant covariates of serum albumin concentration, severe renal dysfunction and concomitant valproic acid use.
2.2.1. Development dataset and validation dataset 1
For the model development dataset and validation dataset 1, we collected data from the Utrecht Patient Oriented Database (UPOD).15 Besides paired observations of total and free phenytoin concentrations, data on serum albumin concentrations and blood urea nitrogen were collected within 48 h before and after the phenytoin concentration observations. Furthermore, information on age and sex were collected as well as the concomitant use of valproic acid, based on its recorded use. Presence of severe renal dysfunction was based on a blood urea nitrogen concentration of 14 mmol/L (39.2 mg/dL) or higher16 and coded as a binary covariate. Phenytoin concentrations were measured using a validated fluorescent polarization immunoassay (FPIA) or liquid chromatography coupled with tandem mass spectrometry assay. Free phenytoin concentrations were obtained by ultracentrifugation at ambient temperature. For the development dataset, data were collected from UPOD between January 2005 and January 2011. For validation dataset 1, data were collected from the UPOD database from January 2011 until November 2017. The institutional review board approved the use of these anonymized data for our research. A pragmatic approach was used for splitting of the dataset for the development dataset and validation set 1. The initial extraction was performed in 2011 and based on these data a mechanistic model was developed. Since new data had been collected in routine practice since this last extraction, a validation dataset was collected in the time frame after 2011.
2.2.2. Validation datasets 2–5
For external validation sets, we searched PubMed for recent research with the following keywords: “phenytoin”, “free”, “fraction”, “sheiner‐tozer”, “winter‐tozer”. The retrieved publications were screened for relevant literature. The corresponding authors were contacted with a request for data sharing. Selection of these data were based on willingness of the researchers to share their data and the presence of information on total and free phenytoin concentrations, as well as data on renal function and concomitant valproic acid use.
2.3. Data analysis
2.3.1. Model development
Statistical analysis of the data was performed by means of nonlinear mixed effects modelling with the software package NONMEM V7.4.1 using the prediction ($PRED) subroutine. Throughout the analysis, the first order conditional estimation method was used. Parameter uncertainty was calculated with the covariance option in NONMEM and presented as relative standard error of the estimate (RSE).
We developed a protein binding model, independent of the pharmacokinetics of phenytoin. Therefore, in our model, the free concentration (Cfree) was used as dependent variable. The dependent variable was predicted from the total concentration and serum albumin concentrations under the assumption of 1 site specific binding, as described by equation 1.12
Equation 1: 1 site specific binding
In this equation, Ctotal is the total concentration (mg/L), Cfree is the free concentration (mg/L), Bmax is the maximum binding constant (mg/L) and KD is the dissociation constant (mg/L). With the assumption that the free fraction (FU) can be described with equation 2,12 equation 1 and 2 can be arranged to equation 3. It follows from equation 2 that if the free concentration is negligible when compared to KD, the free fraction is independent of the free concentration and that if the observed free concentrations are of the approximate same order of magnitude as the KD, there will be a positive correlation between the free concentration and the free fraction.12
Equation 2: Free fraction
Equation 3: Free fraction for 1 site specific binding model
In the base model, the dependent variable Cfree was calculated from the free fraction from equation 3 and the measured total concentration. In the base model, the maximum binding capacity was assumed to be proportionally related to serum albumin concentrations and this relationship was calculated as described in equation 4.
Equation 4: relationship between serum albumin and Bmax
In this equation, ΘALB1 is the estimate for Bmax for an individual with a serum albumin of 27 g/L, ΘALB2 is the estimate for the gradient of change in Bmax when the individual serum albumin concentration (ALBi, in g/L) differs from 27 g/L. After fitting of a specific binding model with 1 site, we tested the presence of a second binding site with both specific binding as nonspecific binding.
Interindividual variability in KD, that may originate from interindividual differences in affinity of the interaction between albumin and phenytoin, was assumed to be log‐normally distributed and for the residual error we tested additive, proportional and combined additive and proportional error models.
After fitting of the base model, we tested concomitant valproic acid use and severe renal dysfunction as binary covariates for Bmax using a forward inclusion backward elimination approach. These covariates were tested on Bmax, because drug protein displacement causes are represented by Bmax and not by a change in individual affinity between the drug and the protein, which is described by KD. The relative change in Bmax was calculated by multiplying the Bmax (equation 4) with ΘSRD COV or ΘVALP COV, where COV has the value of 1 or 0 in, respectively, the presence or absence of the binary covariate. The parameters ΘSRD and ΘVALP can then be interpreted in the fractional change of Bmax as a result of the presence of severe renal dysfunction and concomitant valproic acid use, respectively. A binary covariate for severe renal dysfunction was chosen as it is known that protein binding is only relevantly affected in severe renal dysfunction.
Statistical significance during likelihood ratio testing of nested models was derived from the objective function in NONMEM, that follows a χ2 distribution. A level of significance of P < .01 was used for both the forward inclusion and the backward elimination.
2.3.2. Validation
For validation purposes, we compared the performance of the developed mechanistic model and the Winter–Tozer equation (equation 5) to predict the free concentration in the validation datasets. Predictive performance was assessed with the mean prediction error (MPE) and root mean squared error (RMSE), as proposed by Sheiner et al.17 For calculation of the predictive performance of the mechanistic model, we calculated the unbound concentration from the total concentrations and covariates from using the population parameter estimates from our model.
Equation 5
In this equation, ALBi is the individual serum albumin concentration in g/dL.
2.4. Nomenclature of targets and ligands
Key protein targets and ligands in this article are hyperlinked to corresponding entries in http://www.guidetopharmacology.org, the common portal for data from the IUPHAR/BPS Guide to PHARMACOLOGY,18 and are permanently archived in the Concise Guide to PHARMACOLOGY 2017/18.19
3. RESULTS
3.1. Data extraction
Results of the data extraction are shown in Table 1, together with the characteristics of the external datasets. In the development dataset we had a total of 379 paired observations of total and free phenytoin concentrations in 144 individuals with age ranging from 0 to 92 years. In validation dataset 1, a total of 115 paired observations in 53 individuals were collected.
Table 1.
Summary of datasets
| Development dataset | Validation dataset 1 | Validation dataset 2 Kane et al. | Validation dataset 3 Soriano et al. | Validation dataset 4 Joerger et al. | Validation dataset 5 Krasowski and Penrod | |
|---|---|---|---|---|---|---|
| Number of paired observations of total unbound concentrations | 379 | 115 | 140 | 21 | 266 | 1753 |
| Number of individuals | 144 | 53 | 140 | 21 | 151 | 756 |
| Age (y), median (range) | 34 (0–92) | 40 (0–77) | 54 (20–83) | 57 (21–86) | 50.5 (10–85) | 55.7 (0–96) |
| Male/female (%/%) | 56%/44% | 53%/47% | 49%/51% | 48%/52% | 47%/53% | 56%/44% |
| Number of cases with concomitant valproic acid use (percentage of total) | 36 (9.5%) | 13 (11.3%) | 0 (0%) | 0 (0%) | 42 (15.8%) | 177 (10%) |
| Number of cases with severe renal dysfunction (percentage of total) | 26 (6.9%) | 9 (7.8%) | 4 (2.9%) | 21 (100%) | 0 (0%) | 118 (6.7%) |
| Population selection | Cross‐sectional | Cross‐sectional | Neuro‐intensive care patients | End‐stage renal disease patients | Cancer patients | Cross‐sectional |
| Serum albumin median (range) | 27.6 g/L (10–47.5) | 28.9 g/L (11.0–51.9) | 34 g/L (14–47) | 30 g/L (16–42) | 40 g/L (13–55) | 30 g/L (10–60) |
| Bioanalytical methoda | FPIA or LCMSb | LCMS | FPIA | FPIA | FPIA | EMIT |
| Collection of unbound fraction | Ultracentrifugation at ambient temperature | Ultracentrifugation at ambient temperature | Ultracentrifugation at ambient temperature | Ultracentrifugation at ambient temperature | Ultracentrifugation at ambient temperature | Ultracentrifugation at ambient temperature |
Ranges in this table are minimal–maximal ranges of the observed values.
EMIT: enzyme‐multiplied immunoassay technique; FPIA: fluorescence polarization immunoassay, LCMS: liquid chromatography coupled with tandem mass spectrometry.
Both methods were cross validated according to in‐house methods.
The validation datasets 2–5 were respectively obtained from previous research by Kane et al.,20 Soriano et al.,21 Joerger et al.,22 and Krasowski and Penrod.23 The studied populations in these validation sets were either selected cross‐sectionally, or from end‐stage renal disease patients, neuro‐intensive care patients or cancer patients. For the details of the data collection process and population types we would like to refer to the original manuscripts. In validation dataset 2, by Kane et al.,20 severe renal dysfunction was coded as blood urea nitrogen >14 mmol/L. The validation dataset 4, by Joerger et al.,22 contained some cases with missing covariate data, and these were excluded from the dataset. A summary of all datasets can be found in Table 1. Validation dataset 5, by Krasowski and Penrod,23 contained data from patients that had paired total and free phenytoin measurements along with a serum/plasma albumin measurement within 7 days of the phenytoin values. The original dataset was updated to identify patients with severe renal dysfunction with blood urea nitrogen concentration of 14 mmol/L or higher (approved as retrospective study by University of Iowa Institutional Review Board, protocol # 201610760).
3.1.1. Exploratory analysis of the development dataset
As expected, the observed free fraction increased at lower serum albumin concentrations. A significant negative correlation was found with a Spearman's ρ of −0.678 (P << .001). In the development dataset concentrations up to approximately 9 mg/L were observed, showing that in routine clinical practice supratherapeutic concentrations are not uncommon. Surprisingly, we observed a highly significant positive correlation between free phenytoin concentrations and the free fraction (Spearman's ρ 0.414, P << .001), indicating that the free fraction depends on the free concentration and that, therefore, the observed free concentrations are in the same order of magnitude as the KD. Although the relationship was highly significant, the correlation was moderate (Spearman's ρ 0.414), which led to variability in the free fraction, potentially caused by protein displacement of phenytoin by other drugs or uraemic toxins, variable albumin concentrations and bioanalytical assay error. Figure 1 shows the plotted free fraction vs albumin and free concentration in panel A and B, respectively.
Figure 1.
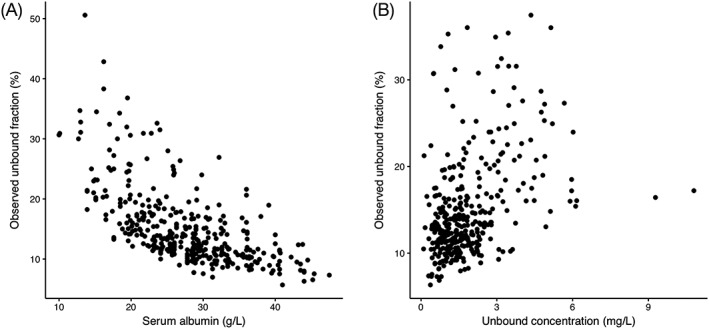
Free fraction vs serum albumin (A) free phenytoin (B) concentrations in the development dataset
3.1.2. Model development
We successfully fit the proposed mechanistic binding model to the observed data. A proportional error model best described the residual error. A second specific or nonspecific binding site could not be identified in our data. The binary covariates severe renal dysfunction and concomitant valproic acid use significantly decreased the maximum binding capacity of albumin for phenytoin when tested univariate (P < .01). When including both parameters in the model, the model fit was even further improved (P < .0001), showing that severe renal dysfunction and concomitant valproic acid use both and independently explain variability in Bmax. Both covariates were, therefore, retained in the final model. In the final model, severe renal dysfunction and concomitant valproic acid use decreased the Bmax, respectively, by 14.7% (ΘSRD = 0.853, RSE 5%) and 30.2% (ΘVALP = 0.698, RSE 4%), respectively. These parameters could be accurately assessed in the development dataset, supported by the low relative standard error of the estimates.
The parameter estimates and for the base and final model can be found in Table 2. Goodness‐of‐fit plots of the final model are shown in Figure 2. As can be seen in panel A and B of this figure, the observed vs the individual and population predicted concentrations (black dots) are evenly distributed around the line of unity (solid black line). Furthermore, the dashed trend line with confidence interval (grey area) closely resembles the line of unity, indicating a good model fit. As observed in panel C, the normalized prediction distribution errors are evenly scattered around zero and do not show a trend when plotted vs the population predicted free concentration, indicating an unbiased prediction across the complete concentration range. Lastly, it can be observed in panel D that the simulated and observed data are well‐aligned in the prediction‐corrected visual predictive check. In this panel, the scattered dots are the observed prediction‐corrected data and the dashed lines the observed 10th, 50th and 90th percentiles. The shaded areas are the prediction intervals for these respective percentiles.
Table 2.
Parameter estimates for the base and final model
| Parameter | Base model | Final model |
|---|---|---|
| Estimate (RSE) | Estimate (RSE) | |
| ΘALB1 (mg/L) | 105 (16%) | 117 (14%) |
| ΘALB2 (L/g) | 0.0325 (6%) | 0.0345 (5%) |
| ΘSRD | ‐ | 0.0853 (5%) |
| ΘVALP | ‐ | 0.698 (4%) |
| KD (mg/L) | 15.1 (18%) | 16.2 (15%) |
| Inter individual variability KD (%) | 26.6% (8%) | 24.8 (8%) |
| Residual variability (%) | 14.8% (9%) | 13.2 (9%) |
| Objective function | −521 | −600 |
Figure 2.
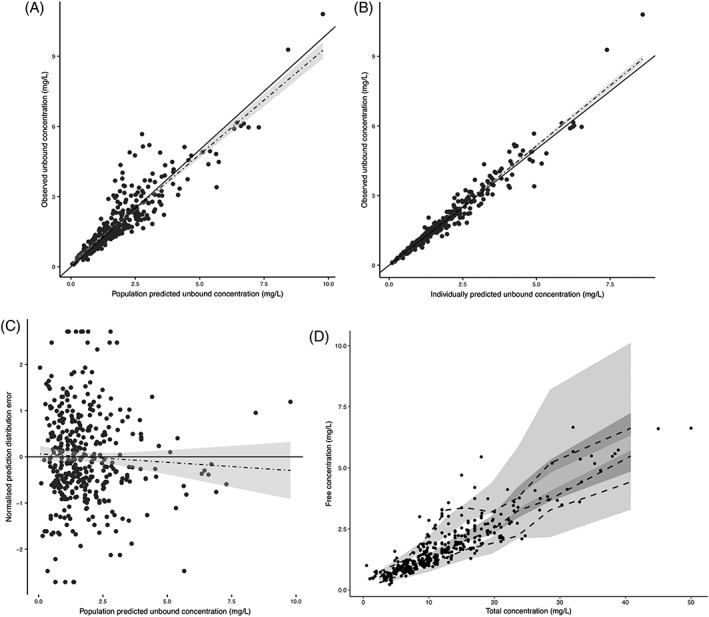
Goodness‐of‐fit plots. (A) observed vs population predicted free phenytoin concentrations. (B) observed vs individually predicted free phenytoin concentrations. (C) normalized prediction distribution error vs population predicted free phenytoin concentration. (D) prediction‐corrected visual predictive check of the free vs the total concentration, based on 1000 simulations
3.1.3. Validation
After the development of the mechanistic binding model in the development dataset, we compared the predictive performance of the mechanistic model and the Winter–Tozer equation (equation 5) on independent datasets. The results are presented in Table 3. In this table, the predictive performance of the developed mechanistic model and the Winter–Tozer equation are presented side by side per dataset.
Table 3.
Validation results
| Validation dataset 1 | Validation dataset 2 Kane et al. | Validation dataset 3 Soriano et al. | Validation dataset 4 Joerger et al. | Validation dataset 5 Krasowski et al. | ||||||
|---|---|---|---|---|---|---|---|---|---|---|
| Mechanistic | Winter–Tozer | Mechanistic | Winter–Tozer | Mechanistic | Winter–Tozer | Mechanistic | Winter–Tozer | Mechanistic | Winter–Tozer | |
| MPE | −2.2% | −14.8 | −20.2% | −40.5% | 1.1% | −74.6% | 1.1% | −13.6% | 17.8% | 6.0% |
| RMSE | 0.45 mg/L | 0.50 mg/L | 0.48 mg/L | 0.66 mg/L | 1.00 mg/L | 1.76 mg/L | 0.48 mg/L | 0.41 mg/L | 0.745 mg/L | 0.688 mg/L |
MPE, mean prediction error; RMSE, root mean squared error
As observed in Table 3, the mechanistic model consequently resulted in superior accuracy in validation set 1–4, as observed in the reduced bias (mean prediction error) of the mechanistic model when compared to the Winter–Tozer equation. Worse performance in terms of accuracy was observed for validation dataset 5. In terms of precision, the mechanistic model performed better for validation sets 1–3, as observed in the lower RMSE.
4. CONCLUSION AND DISCUSSION
To the best of our knowledge, we are the first to report and characterize the nonlinear in vivo protein binding of phenytoin. Our findings indicate that the empirical Winter–Tozer equation, which assumes a fixed free fraction in the clinically relevant concentration range. The observed free phenytoin concentrations in our dataset were in the same order of magnitude as the KD and allowed assessment of the nonlinear protein binding. The clinical implications of these findings are that, besides saturable clearance of phenytoin, saturable protein binding complicates dose titrations. When a dose is increased or reduced, while the serum albumin concentrations are stable, one should consider the possibility of an altered free fraction. Second, we showed that, in general, the mechanistic model had superior predictive performance over the Winter–Tozer equation to predict free phenytoin in external validation datasets, in terms of bias (in 4 out of 5 validation datasets) and precision (in 3 out of 5 validation datasets).
Third, despite the superior predictive performance of the mechanistic model in the majority of the external validation datasets, the predictive precision (RMSE) varied from 0.45 to 1.00 mg/L for the mechanistic model. Considering the fact that the precision (RMSE) of our model was in the same order of magnitude as the therapeutic range of free phenytoin (1–2 mg/L), we conclude that even a mechanistic model for phenytoin protein binding should not be considered an alternative for measuring free concentrations for purposes of TDM. Nonetheless, if this is not possible, a mechanistic model to predict the free concentration should be preferred over the Winter–Tozer equation. Furthermore, it appeared that validation dataset 5 was distinct from the other datasets, as the mechanistic model consequently showed poor predictive performance in comparison with Winter–Tozer equation.
The free phenytoin measurements in validation dataset 5 used ultrafiltration methods similar to datasets 1–4 but were obtained by enzyme‐multiplied immunoassay technique (EMIT) using the Syva EMIT 2000 assay. The other datasets used FPIA or LC/MS as the method for free phenytoin measurement. There is little published literature comparing free phenytoin measurements using immunoassays from different manufacturers, but a study by Roberts et al. in 2001 compared 4 different immunoassays for free phenytoin determinations.24 This study included comparisons of EMIT and FPIA methods, showing differences in bias between methods relative to high‐performance liquid chromatography as the gold standard. To our knowledge, there are no publications since the 2001 Roberts et al. study comparing free phenytoin measurements; thus, it is unknown if these differences between EMIT and FPIA methods occur with more recent instrument platforms and immunoassay versions and this should be subject for further study. Nonetheless, our analysis shows the necessity of external validation of the current model in a new population and assay method before it is applied in routine clinical practice.
One may argue that the use of blood urea nitrogen as a covariate in our study may have limitations, as other factors other than renal function, such as hydration state or high protein diet, may impact blood urea nitrogen levels. Nonetheless, as the hypothesis is that uraemic toxins are responsible for the displacement of phenytoin from albumin, we think that blood urea nitrogen is an adequate surrogate marker for uraemia.25 In our data, we could identify interindividual variability in the binding constant KD, as a source for variability in the free fraction. Although knowledge on this variability is not necessarily useful to predict the free phenytoin concentration from a total concentration, the mechanistic model including all sources of variability may be implemented in an existing or new population‐pharmacokinetic model of phenytoin to predict individual free concentrations, e.g. to perform TDM. Previous observations of the free concentrations in an individual may then be used to more accurately predict a future free concentration. A methodological limitation of our approach may nonetheless be that in our model we assume that there is no error in the independent variable. However, since it is likely that the error in the independent variable (total concentration) is equal to or less than that of the error in the dependent variable (free concentration) and because our analysis reflects the situation that will be used in clinical practice, we think our approach is justified.
Our in vivo protein binding data of phenytoin were all retrospectively collected from routine clinical care. Although a real‐world setting like this has many advantages, as it truly resembles clinical practice, one should realize that this approach may have limitations. For example, cases with incomplete covariate data were discarded from the development dataset. In clinical practice, laboratory measurements are performed as a part of a diagnosis or in the context of clinical disease monitoring. Including only individuals with complete data on renal function and serum albumin, may therefore introduce a selection bias. Consequently, the generalizability of our findings to other populations should be studied. Nonetheless, the saturable protein binding of phenytoin in the clinically relevant concentration range is a drug‐specific characteristic and not a population‐specific characteristic. Therefore, this phenomenon should be considered in other populations as well. Furthermore, the retrospective nature of our data collection strategy may have introduced bias. For example, if no data on concomitant valproic acid use were found, we concluded that the individual did not use valproic acid. Although we consider our database to be exhaustive, missing data may not be ruled out. In the latter example, this may have resulted in under‐estimation of the effect of concomitant valproic acid use on the protein binding of phenytoin. Although valproic acid is most notorious for displacement of phenytoin from albumin, other less frequently used drugs such as salicylic acid and some sulfonamides have been reported to be able to displace phenytoin from albumin.26 These drugs have not been investigated as covariates for protein binding in our model nor have they been incorporated in the Winter–Tozer equation, which is considered the gold standard for protein binding correction in the clinic. Despite these limitations, our main finding, that the phenytoin protein binding is saturable in clinically representative concentrations, still holds. Importantly, our mechanistic model outperformed the empirical Winter–Tozer equation in the majority of the external validation datasets of various populations, indicating that our model performs relatively well in different settings. Finally, future studies are recommended to validate the equations' impact on actual patient efficacy and toxicity outcomes and to quantify the effect of other covariates on protein binding of phenytoin, for example other drugs and the bioanalytical assay type.
COMPETING INTERESTS
There are no competing interests to declare.
CONTRIBUTORS
R.t.H. designed the study, performed the analysis and wrote the manuscript. S.P.K. collected data and wrote the manuscript. A.D.R.H. collected data and wrote the manuscript. M.D.K. collected data and wrote the manuscript. E.M.v.M. collected data and wrote the manuscript.
5.
ter Heine R, Kane SP, Huitema ADR, Krasowski MD, van Maarseveen EM. Nonlinear protein binding of phenytoin in clinical practice: Development and validation of a mechanistic prediction model. Br J Clin Pharmacol. 2019;85:2360–2368. 10.1111/bcp.14053
The authors confirm that the PI for this paper is Rob ter Heine.
Data Availability Statement:The data that support the findings of this study are available from the corresponding author upon reasonable request.
DATA AVAILABILITY STATEMENT
The data that support the findings of this study are available from the corresponding author upon reasonable request.
REFERENCES
- 1. Poupaert JH, Vandervorst D, Guiot P, Moustafa MMM, Dumont P. Structure‐activity relationships of phenytoin‐like anticonvulsant drugs. J Med Chem. 1984;27(1):76‐78. [DOI] [PubMed] [Google Scholar]
- 2. Patsalos PN, Berry DJ, Bourgeois BFD, et al. Antiepileptic drugs‐‐best practice guidelines for therapeutic drug monitoring: a position paper by the subcommission on therapeutic drug monitoring, ILAE commission on therapeutic strategies. Epilepsia. 2008;49(7):1239‐1276. 10.1111/j.1528-1167.2008.01561.x [DOI] [PubMed] [Google Scholar]
- 3. Burt M, Anderson DC, Kloss J, Apple FS. Evidence‐based implementation of free phenytoin therapeutic drug monitoring. Clin Chem. 2000;46(8):1132‐1135. [PubMed] [Google Scholar]
- 4. Martin E, Tozer TN, Sheiner LB, Riegelman S. The clinical pharmacokinetics of phenytoin. J Pharmacokinet Biopharm. 1977;5(6):579‐596. [DOI] [PubMed] [Google Scholar]
- 5. Banh HL, Burton ME, Sperling MR. Interpatient and intrapatient variability in phenytoin protein binding. Ther Drug Monit. 2002;24(3):379‐385. [DOI] [PubMed] [Google Scholar]
- 6. Hayes MJ, Langman MJ, Short AH. Changes in drug metabolism with increasing age: 2. Phenytoin clearance and protein binding. Br J Clin Pharmacol. 1975;2(1):73‐79. [DOI] [PMC free article] [PubMed] [Google Scholar]
- 7. Liponi DF, Winter ME, Tozer TN. Renal function and therapeutic concentrations of phenytoin. Neurology. 1984;34(3):395‐397. [DOI] [PubMed] [Google Scholar]
- 8. Dasgupta A, Abu‐Alfa A. Increased free phenytoin concentrations in predialysis serum compared to postdialysis serum in patients with uremia treated with hemodialysis. Role of uremic compounds. Am J Clin Pathol. 1992;98(1):19‐25. [DOI] [PubMed] [Google Scholar]
- 9. Kiang TKL, Ensom MHH. A comprehensive review on the predictive performance of the Sheiner‐Tozer and derivative equations for the correction of phenytoin concentrations. Ann Pharmacother. 2016;50(4):311‐325. 10.1177/1060028016628166 [DOI] [PubMed] [Google Scholar]
- 10. Allison TB, Comstock TJ. Temperature dependence of phenytoin‐protein binding in serum: effects of uremia and hypoalbuminemia. Ther Drug Monit. 1988;10(4):376‐381. [DOI] [PubMed] [Google Scholar]
- 11. Kodama H, Kodama Y, Shinozawa S, Kanemaru R, Todaka K, Mitsuyama Y. Temperature effect on serum protein binding kinetics of phenytoin in monotherapy patients with epilepsy. Eur J Pharm Biopharm. 1999;47(3):295‐298. [DOI] [PubMed] [Google Scholar]
- 12. Toutain PL, Bousquet‐Melou A. Free drug fraction vs free drug concentration: a matter of frequent confusion. J Vet Pharmacol Ther. 2002;25(6):460‐463. [DOI] [PubMed] [Google Scholar]
- 13. Hennig S, Norris R, Tu Q, et al. Population pharmacokinetics of phenytoin in critically ill children. J Clin Pharmacol. 2015;55(3):355‐364. [DOI] [PubMed] [Google Scholar]
- 14. Deleu D, Aarons L, Ahmed IA. Estimation of population pharmacokinetic parameters of free‐phenytoin in adult epileptic patients. Arch Med Res. 2005;36(1):49‐53. [DOI] [PubMed] [Google Scholar]
- 15. ten Berg MJ, Huisman A, van den Bemt PMLA, Schobben AFAM, Egberts ACG, van Solinge WW. Linking laboratory and medication data: new opportunities for pharmacoepidemiological research. Clin Chem Lab Med. 2007;45(1):13‐19. 10.1515/CCLM.2007.009 [DOI] [PubMed] [Google Scholar]
- 16. The Nephron Information Center ‐ Blood lab value comparison. http://nephron.org/nephsites/adp/labvalues.html. Accessed November 11, 2018.
- 17. Sheiner LB, Beal SL. Some suggestions for measuring predictive performance. J Pharmacokinet Biopharm. 1981;9(4):503‐512. [DOI] [PubMed] [Google Scholar]
- 18. Harding SD, Sharman JL, Faccenda E, et al. The IUPHAR/BPS guide to PHARMACOLOGY in 2018: updates and expansion to encompass the new guide to IMMUNOPHARMACOLOGY. Nucl Acids Res. 2018;46:D1091‐D1106. [DOI] [PMC free article] [PubMed] [Google Scholar]
- 19. Alexander SPH, Striessnig J, Kelly E, et al. The Concise Guide to PHARMACOLOGY 2017/18: Voltage‐gated ion channels. Br J Pharmacol. 2017;174(Suppl 1):S160‐S194. [DOI] [PMC free article] [PubMed] [Google Scholar]
- 20. Kane SP, Bress AP, Tesoro EP. Characterization of unbound phenytoin concentrations in neurointensive care unit patients using a revised Winter‐Tozer equation. Ann Pharmacother. 2013;47(5):628‐636. 10.1345/aph.1R651 [DOI] [PubMed] [Google Scholar]
- 21. Soriano VV, Tesoro EP, Kane SP. Characterization of free phenytoin concentrations in end‐stage renal disease using the Winter‐Tozer equation. Ann Pharmacother. 2017;51(8):669‐674. 10.1177/1060028017707541 [DOI] [PubMed] [Google Scholar]
- 22. Joerger M, Huitema ADR, Boogerd W, van der Sande JJ, Schellens JHM, Beijnen JH. Interactions of serum albumin, valproic acid and carbamazepine with the pharmacokinetics of phenytoin in cancer patients. Basic Clin Pharmacol Toxicol. 2006;99(2):133‐140. 10.1111/j.1742-7843.2006.pto_309.x [DOI] [PubMed] [Google Scholar]
- 23. Krasowski MD, Penrod LE. Clinical decision support of therapeutic drug monitoring of phenytoin: measured versus adjusted phenytoin plasma concentrations. BMC Med Inform Decis Mak. 2012;12(1):7 10.1186/1472-6947-12-7 [DOI] [PMC free article] [PubMed] [Google Scholar]
- 24. Roberts WL, Annesley TM, De BK, Moulton L, Juenke JM, Moyer TP. Performance characteristics of four free phenytoin immunoassays. Ther Drug Monit. 2001;23(2):148‐154. [DOI] [PubMed] [Google Scholar]
- 25. Mabuchi H, Nakahashi H. A major inhibitor of phenytoin binding to serum protein in uremia. Nephron. 1988;48(4):310‐314. [DOI] [PubMed] [Google Scholar]
- 26. Nation RL, Evans AM, Milne RW. Pharmacokinetic drug interactions with phenytoin (part I). Clin Pharmacokinet. 1990;18(1):37‐60. [DOI] [PubMed] [Google Scholar]
Associated Data
This section collects any data citations, data availability statements, or supplementary materials included in this article.
Data Availability Statement
The data that support the findings of this study are available from the corresponding author upon reasonable request.