Abstract
Background
Precision medicine trials targeting the epidermal growth factor receptor (EGFR) in glioblastoma patients require selection for EGFR-amplified tumors. However, there is currently no gold standard in determining the amplification status of EGFR or variant III (EGFRvIII) expression. Here, we aimed to determine which technique and which cutoffs are suitable to determine EGFR amplification status.
Methods
We compared fluorescence in-situ hybridization (FISH) and real-time quantitative (RT-q)PCR data from patients screened for trial inclusion into the Intellance 2 clinical trial, with data from a panel-based next generation sequencing (NGS) platform (both DNA and RNA).
Results
By using data from >1000 samples, we show that at least 50% of EGFR amplified nuclei should be present to define EGFR gene amplification by FISH. Gene amplification (as determined by FISH) correlates with EGFR expression levels (as determined by RT-qPCR) with receiver operating characteristics analysis showing an area under the curve of up to 0.902. EGFR expression as assessed by RT-qPCR therefore may function as a surrogate marker for EGFR amplification. Our NGS data show that EGFR copy numbers can strongly vary between tumors, with levels ranging from 2 to more than 100 copies per cell. Levels exceeding 5 gene copies can be used to define EGFR-amplification by NGS; below this level, FISH detects very few (if any) EGFR amplified nuclei and none of the samples express EGFRvIII.
Conclusion
Our data from central laboratories and diagnostic sequencing facilities, using material from patients eligible for clinical trial inclusion, help define the optimal cutoff for various techniques to determine EGFR amplification for diagnostic purposes.
Keywords: amplification, biomarker, EGFR, EGFRvIII, FISH, glioblastoma, screening
Key Points.
We show which cutoffs define EGFR amplification for diagnostic purposes.
Diagnostic EGFR amplification cutoffs are defined for FISH, RT-qPCR, and NGS.
EGFR gene expression can serve as a surrogate marker for EGFR amplification.
Importance of the Study.
Precision medicine trials targeting EGFR in glioblastoma patients require selection for EGFR-amplified tumors. However, there is currently no standard to determine the amplification status of EGFR or EGFRvIII expression. In this study, we used molecular data derived from central laboratory testing and diagnostic-grade sequencing facilities, using a clinically relevant patient population (ie, those eligible for clinical trial inclusion) to help determine which technique and which cutoffs are suitable to determine EGFR amplification status for diagnostic purposes. Our results are of high relevance for the selection of patients into precision medicine trials.
In glioblastomas, the most common and aggressive type of primary brain tumor, the gene encoding epidermal growth factor receptor (EGFR) is mutated in approximately half of all tumors1,2 (Lassman et al, submitted). Initially, the EGFR locus is amplified to high copy number levels, sometimes exceeding 100 copies per tumor cell.3 Additional mutations may evolve after gene amplification and these can include intragenic deletions, point mutations, and/or gene fusions.1 As secondary mutations mainly arise after gene amplification, they are almost always subclonal and it is not uncommon that several of these coexist within the same tumor. Secondary mutations in EGFR therefore add to the intratumoral heterogeneity of glioblastomas.4EGFR amplicons are present in cells as double minutes: extrachromosomal and circular DNA fragments. These double minutes also contribute to tumor heterogeneity, as they are unevenly distributed across the 2 daughter cells following cell division.3
Although glioblastomas depend on EGFR for growth, clinical efficacy of EGFR tyrosine kinase inhibitors has thus far been disappointing.5–7 For example, in newly diagnosed glioma patients, gefitinib has no added clinical benefit when given after radiotherapy.8,9 Similarly, in recurrent glioma patients, erlotinib as single agent did not improve 6 months progression-free survival.10,11 However, novel therapies that use EGFR either as a target or as a marker enriched in tumors, such as vaccines, chimeric antigen receptor T cells, or antibody drug conjugates, are under development or are already in clinical trials for glioblastoma patients.12–16 Either way, clinical trials targeting EGFR require a consensus for the optimal method and cutoff to determine EGFR amplification status.
The randomized phase II AbbVie M14-483/EORTC 1410-BTG “Intellance 2” trial examined whether depatux-M improves survival in EGFR-amplified recurrent glioblastoma patients. Trial results show a trend toward improved survival when depatux-M was given in combination with temozolomide (TMZ) compared with an alkylator only–based control arm. Longer-term follow-up confirmed improved survival (van den Bent et al, in preparation). For this trial, EGFR amplification was determined in a central laboratory using fluorescence in-situ hybridization (FISH), and patients harboring EGFR-amplified tumors were selected from >1000 screened samples. Additional molecular studies on these samples was performed which included real-time quantitative (RT-q)PCR to determine EGFR and variant III (EGFRvIII) expression and panel-based sequencing, but only of patients included in the trial (both DNA and RNA). The molecular data derived from central laboratory testing and diagnostic-grade sequencing facilities, using a clinically relevant patient population (ie, those eligible for clinical trial inclusion), help define the optimal cutoff for various techniques to determine EGFR amplification for diagnostic purposes. Our data can help the selection of patients into precision medicine trials.
Materials and Methods
Patients
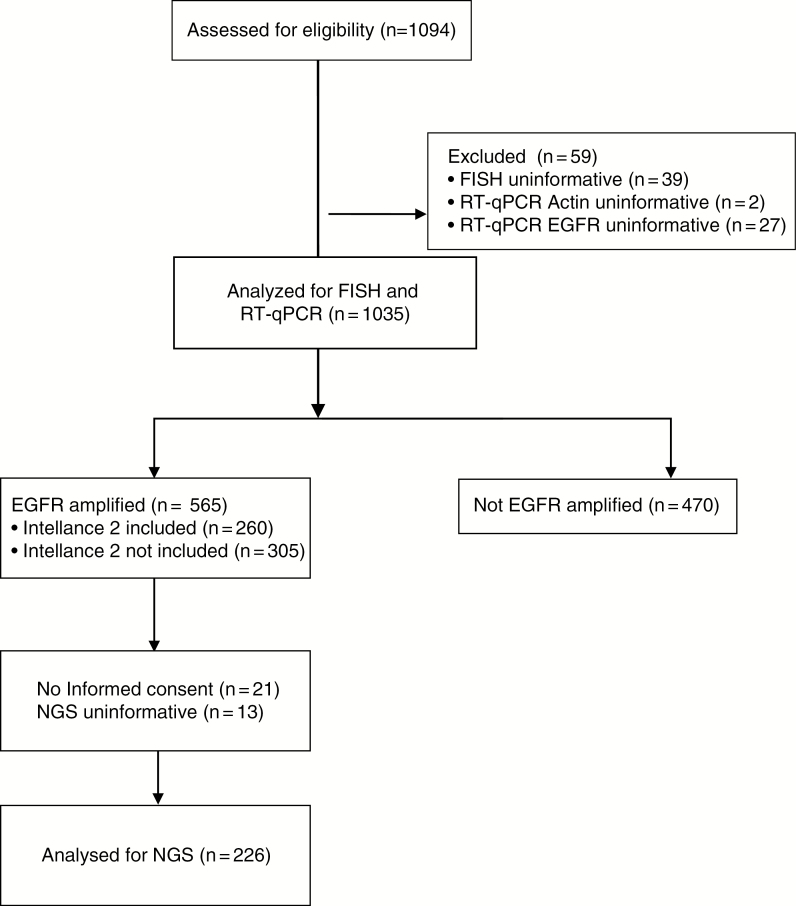
Recurrent glioblastoma patients were considered eligible for the Intellance 2 trial (clinical trial identifier NCT02343406) if they had been diagnosed with a histologically confirmed, EGFR-amplified glioblastoma at first occurrence. For the screening assay, in the majority of cases (~86%), material from first surgery was used. This is possible since EGFR amplification is a temporally stable genetic event in the large majority of patients.17–19 A total of 1094 samples were screened from which 260 patients were randomized in the Intellance 2 trial to receive either (i) TMZ or, if progressing within 16 weeks of the start of the last maintenance TMZ cycle, CCNU (n = 26 and n = 60, respectively; total n = 86); (ii) depatux-M alone (n = 86); or (iii) TMZ in combination with depatux-M (n = 88). A Consolidated Standards of Reporting Trials (CONSORT) diagram is shown in Figure 1. Eligibility criteria for molecular analysis were histologically confirmed de novo glioblastoma (primary) with unequivocal first progression after RT concurrent/adjuvant chemotherapy at least 3 months post radiotherapy, age ≥18 years, and Karnofsky performance status 60–100. All centers had to obtain approval of the study design from their local ethical boards before study activation according to national and institutional regulations. All patients gave written informed consent for trial participation and molecular testing.
Fig. 1.
CONSORT diagram of the study population assessed for biomarkers.
Fluorescence In-Situ Hybridization
FISH was performed by one of 3 laboratories (Histogenex, Antwerp, Belgium, n = 801; Mosaic, Lake Forest, California, n = 100; and Peter MacCallum Cancer Institute, Melbourne, Australia, n = 233) on glioblastomas using the Vysis EGFR CDx Assay (Abbott Molecular; not on market) as described (Lassman et al, submitted). Reproducibility between labs for FISH and RT-qPCR was determined using a proficiency tissue panel that was run on all sites upon startup. The proficiency of laboratory personnel to perform the Abbott RealTime EGFR assay was evaluated during RealTime EGFR assay training. The training/proficiency runs consist of a panel (glioblastoma formalin-fixed paraffin embedded [FFPE] tissue sections), EGFR positive and negative controls processed through all steps of the EGFR assay procedure (RNA isolation, amplification/detection reaction setup, and operation of the m2000 Real Time System). The trainees were evaluated based on performance of assay procedure as well as results of each proficiency run. One hundred percent concordance with expected results was one of the proficiency criteria. Data from all sites was evaluated by Abbott Molecular, and results were within expected range. For FISH, 2 DNA probes labeled with spectrally distinct fluorophores hybridizing to the 7p11.2-7p12 region or the chromosome enumeration probe (CEP) 7 hybridizing to the chromosome 7 centromere were used. Slides and probe mix were denatured at 73°C for 5 minutes and then hybridized at 37°C for 14–24 hours on a ThermoBrite system (Abbott Molecular). Sample pretreatment and post-hybridization washes were performed using the Vysis Universal FFPE Tissue Pretreatment and Wash Kit (Abbott Molecular; not commercially available). Slides were reviewed using fluorescence microscopy, and FISH signal counts (copy number) for individual probes were recorded for a total of 50 nuclei. A tumor was considered EGFR amplified when there was focal EGFR gene amplification defined as an EGFR/CEP 7 ratio greater than or equal to 2 in ≥15% recorded cells. Tumors with polysomy for chromosome 7 (excess copies of the entire chromosome) but without focal amplification of the EGFR gene were considered to be EGFR nonamplified.
Real-Time Quantitative PCR
RT-qPCR was performed as described (Lassman et al, submitted). Briefly, one ≥5 µM section containing a minimum of 50 mm2 total tissue area from a FFPE tumor block was processed for RNA extraction using the Qiagen RNeasy FFPE Extraction Kit (Qiagen Sciences) according to the manufacturer’s instructions. FFPE sections were deparaffinized, and proteinase K was added. The nucleic acids were de-crosslinked from formalin and DNase treated to remove DNA content. Purified RNA was combined in a 96-well plate with mastermix containing primers and probes for amplification and detection of total EGFR and β-actin on the Abbott m2000 RealTime System (Abbott Molecular). β-actin served as an endogenous control and to provide relative quantitative values for total EGFR expression in the samples. The difference (ΔCt) between β-actin cycle threshold (Ct) and total EGFR Ct was calculated and reported.
DNA/RNA Isolation and Sequencing
Materials, either tissue sections or tissue blocks, were centrally collected at the Erasmus Medical Center in Rotterdam. Material of 226 patients included in the Intellance 2 trial was collected. Evaluation of the area with highest tumor content was done by the pathologist (J.M.K.) on a hematoxylin and eosin stained section. Ten to twenty 5-μm sections were then sent to Almac Diagnostics (Craigavon, UK) for macrodissection and subsequent DNA and RNA extraction using the Allprep DNA/RNA FFPE kit (Qiagen). Sequencing was done using the Trusight Tumor 170 panel (Illumina), which uses a combination of DNA and RNA sequencing to interrogate single nucleotide variations (SNVs) in ~150 genes, amplification of 59 genes, and fusion and splice variant expression in 55 genes.20 Sufficient quality was obtained in 216 samples for DNA sequencing and 215 for RNA sequencing. SNV, copy number, fusion gene, and splice variant expression calling was done on the Illumina Basespace sequence hub using the TruSight Tumor 170 App.
For each sample of the 1094 patients, one FISH assessment and one RT-qPCR value for EGFR, actin, and EGFRvIII was available. For 226 of these, the additional NGS data are available with one EGFR amplification level value (derived from a combination of probes on the EGFR locus, determined by the standard TruSight170 pipelines on the Illumina Basespace sequencing hub). EGFR amplification status by FISH was initially dichotomized as per trial inclusion (ie, using a cutoff of 15% amplified nuclei per tumor unless otherwise stated). EGFR amplification status as determined by RT-qPCR was dichotomized based on the bimodal distribution of the frequency histogram using ΔCt values stated in the analysis. Mean and cutoff values of bimodal distributions were determined based on a finite mixture model using the Expectation-Maximization algorithm and calculated based on the “cutoff” R package.21 This package was also identified the cutoff point for FISH to determine EGFR amplification. The ΔCt value with highest AUC (−3.56) and with a type I error rate of 0.05 (−2.48) was used to show concordance between FISH and RT-qPCR. Comparison between frequencies was done using the chi-square test. Kappa scores were calculated using the interrater reliability and agreement “irr” package in R. Where applicable, values listed with 95% confidence intervals or ±SD.
Results
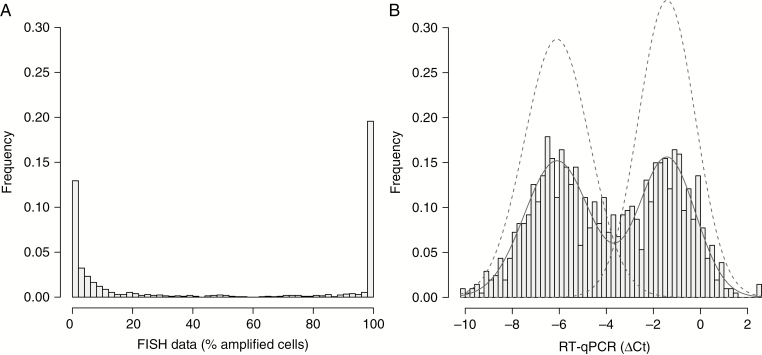
For inclusion in the Intellance 2 trial, 1094 recurrent glioblastoma patients were screened for EGFR amplification by FISH in a central laboratory. Of these, 1072 samples yielded informative data to determine EGFR amplification (a CONSORT diagram is shown in Figure 1). Fifty nuclei were counted per sample from which the percentage of EGFR-amplified cells was calculated. For each cell, EGFR amplification was defined when the ratio of EGFR/centromere Chr 7 was >2. This would amount to a copy number of EGFR >6 per cell as most glioblastomas have gain of chromosome 7. Interestingly, and despite the fact that glioblastomas also harbor non-neoplastic stromal cells, the majority of samples either contain almost no EGFR amplified cells (<15% amplified nuclei) or consist entirely of EGFR amplified cells (>90% amplified nuclei; Figure 2). Relatively few samples (n = 122, 11.6%) had intermediate numbers of EGFR-amplified nuclei. The FISH results therefore indicate that glioblastomas generally are not composed of mixtures of EGFR-amplified and non-amplified cells.
Fig. 2.
Frequency histogram of the percentage of EGFR-amplified nuclei per tumor sample by FISH (A). Note that most samples either contain almost no EGFR-amplified nuclei or almost entirely consist of EGFR-amplified nuclei. The histogram of EGFR RT-qPCR data (B) also shows a bimodal distribution suggesting that RT-qPCR data can also be used to determine EGFR amplification status. Models of the 2 distributions (dashed lines) are plotted on top of the frequency histogram. The intersect of these 2 curves at −3.56 gives highest concordance between FISH and RT-qPCR data. The cutoff value for type I errors in calling EGFR amplification was calculated at −2.48.
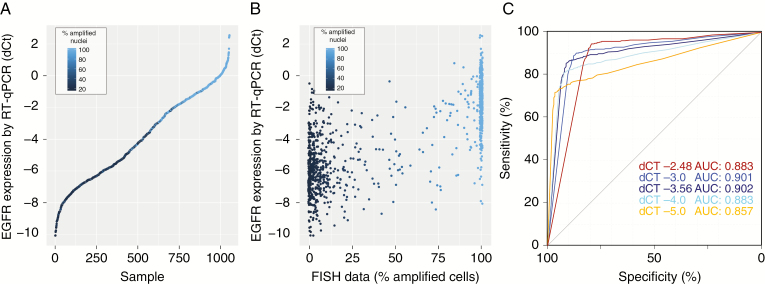
RT-qPCR was successfully performed on 1035 tumors. The histogram of ΔCt values, plotted in Figure 2B, shows a bimodal distribution with two peaks at −6.1 ± 1.9 and −1.4 ± 1.4 ΔCt. Ranked ΔCt values, plotted in Figure 3A, show a wide range of EGFR expression between different tumors. EGFR expression was correlated to amplification: the samples with high expression of EGFR almost always contained a high number of EGFR-amplified cells by FISH and, conversely, samples with low EGFR expression contained very few (if any) EGFR-amplified cells (Figure 3B). A receiver operating characteristic (ROC) plot shows the strength of gene expression in determining gene amplification (Figure 3C). When EGFR amplification was defined as a tumor having greater than −3.56 ΔCt EGFR versus actin expression value (ie, the intersect of 2 curves modeling the bimodal distribution), the area under the curve was 0.902 (95% CI: 0.881–0.922), with an optimum (ie, the point with the best sum of sensitivity and specificity) at sensitivity of 85.6% and specificity of 91.2% (95% CI: 88.1%–93.3%). At a sensitivity of 90% the specificity was 75.9% (95% CI: 60.6–88.8%). When EGFR amplification was defined as the optimal for type I errors (ie, 0.05), the ΔCt EGFR versus actin expression value cutoff increased to −2.48. Also at this cutoff, the area under the curve remains high, 0.883 (95% CI: 0.862–0.904), with a sensitivity of 90.1% and specificity of 83.4%. The RT-qPCR data therefore demonstrate that EGFR expression can function as a surrogate marker to define EGFR amplification. Of note, in these analyses, the optimal threshold to determine EGFR amplification by FISH was a percentage of EGFR amplified cells exceeding 77%; higher than the 15% used for clinical trial inclusion.
Fig. 3.
RT-qPCR can function as a surrogate to determine EGFR amplification status. (A) Ranked ΔCt values from RT-qPCR data show a wide range of EGFR expression between samples. Samples with high EGFR expression often had EGFR amplification. (B) RT-qPCR plotted against the percentage of EGFR-amplified cells per sample highlights the observation that higher percentages of EGFR-amplified cells also express EGFR at higher levels. (C) ROC curves show that EGFR expression can predict EGFR gene amplification by FISH. ROC curves were plotted for 4 different cutoffs (% of EGFR-amplified cells) to determine EGFR amplification by FISH.
The concordance between dichotomized FISH and RT-qPCR data was high: 89% using the RT-qPCR cutoff of −3.56 ΔCt values and 86% using the cutoff optimized for type I errors of −2.48 ΔCt values (both using a FISH cutoff of 77%% amplified cells; Table 1). Of course, any increase in stringency to define EGFR amplification (by increasing the percentage of FISH positive cells) would reduce the number of EGFR-amplified tumors. Using the criteria for clinical trial inclusion (ie, >15% amplified cells), 565 of the 1035 samples tested (54.6%) were defined as being EGFR amplified. When increasing the stringency to define EGFR amplification to >77% amplified cells by FISH, this number would decrease to 460 (44.4%).
Table 1.
Concordance between FISH and RT-qPCR
| FISH Status (77%) | |||
|---|---|---|---|
| Negative | Positive | ||
| RT-qPCR status ΔCt −3.56 | Negative | 506 | 49 |
| Positive | 69 | 411 | |
| FISH Status (77%) | |||
| Negative | Positive | ||
| RT-qPCR status ΔCt −2.48 | Negative | 539 | 107 |
| Positive | 36 | 353 |
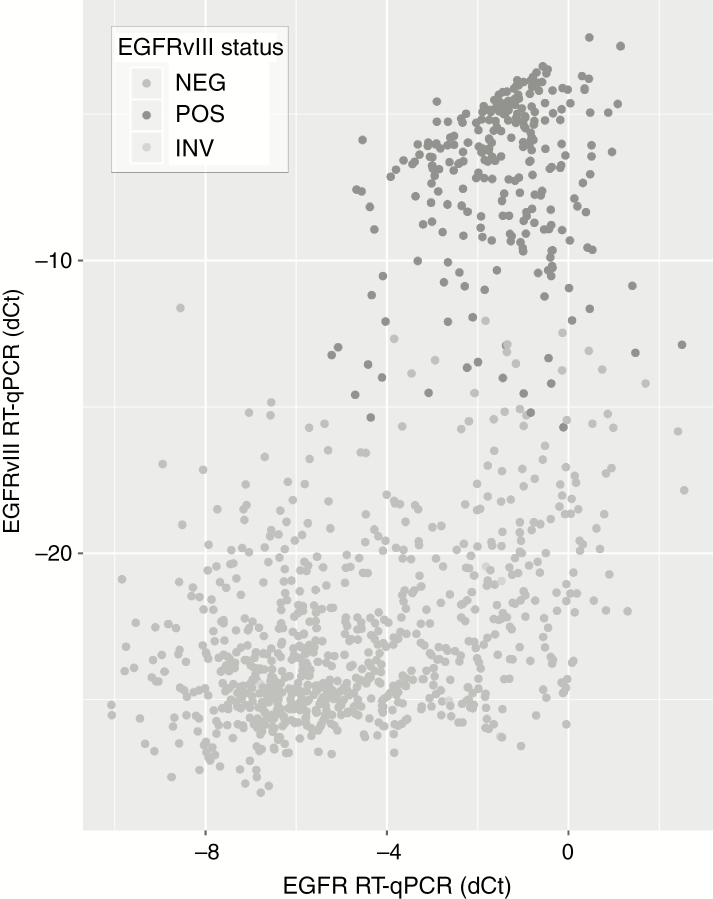
EGFRvIII expression was also determined by RT-qPCR and yielded informative data in 1049 samples. Almost all the 263 samples expressing EGFRvIII were also EGFR amplified as defined by FISH (257/263, 97.7%, P < 0.001; Supplementary Figure 1A), and EGFRvIII expressing tumors were present mainly in samples with high levels of EGFR expression (Figure 4, Supplementary Figure 1B), confirming that EGFRvIII is expressed almost exclusively in samples with EGFR amplification.
Fig. 4.
EGFRvIII expression is found in samples with high levels of EGFR expression. As can be seen, samples that express EGFRvIII (y-axis) are found in samples that have high levels of EGFR expression (x-axis). Dark-gray dots indicate those that have been classified as EGFRvIII positive tumors (ie, Ct values of EGFRvIII <30).
EGFR Amplification by NGS
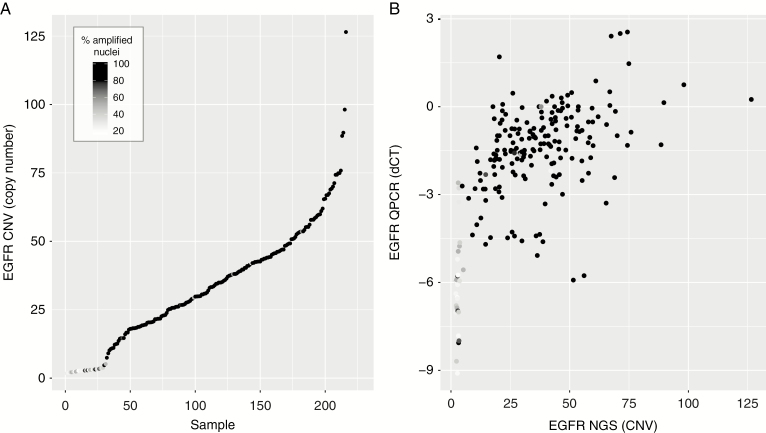
A total of 260 of the 1094 centrally screened patients were included in the Intellance 2 randomized phase II clinical trial. Patients were selected based on the presence of EGFR amplification by FISH only, with amplification defined as >15% of nuclei containing an EGFR/centromere Chr 7 ratio >2. Targeted NGS using the Illumina Trusight 170 platform was successfully performed (DNA) on 226 of these 260 samples. Ranked copy number estimates from the sequencing data are plotted in Figure 5A and confirms that most samples indeed contain high copy gene amplification. However, of the 226 samples sequenced, 30 samples (13.9%) were estimated to have fewer than 4 EGFR copy numbers. Most of these 30 low copy number samples also contained few EGFR-amplified cells as determined by FISH, and had low EGFR gene expression levels (Figure 5B). The observation that samples with a low percentage of amplified nuclei often show no copy number alterations by NGS suggests that FISH should use a more stringent cutoff to molecularly determine EGFR amplification than the threshold used for this trial. Indeed, when EGFR amplification was redefined as having >50% amplified nuclei, the total number of EGFR amplified samples drops marginally (n = 199/226), but the proportion of samples containing fewer than 4 EGFR copy numbers by NGS was reduced 29 to 7. It should be noted, however, that cutoffs used to molecularly define EGFR amplification may not reflect clinical efficacy of targeted agents; precision medicine trials may use a different cutoff.
Fig. 5.
Comparison between EGFR amplification as determined by NGS with FISH and RT-qPCR. (A) Ranked copy number estimates by NGS show that samples with low copy numbers also had relatively few EGFR-amplified nuclei (darker points). Note the steep increase from <5 copy numbers to >10 copy numbers. (B) Copy number estimates by NGS correlate with gene expression derived from RT-qPCR. Samples with low copy numbers often had low levels of EGFR expression.
It is possible that these samples are actually EGFR amplified but had a low tumor cell content. However, all sections were marked for areas of high tumor content (>70% tumor cells) by a dedicated neuropathologist. Moreover, the ranked copy number variation data from NGS show a “shoulder” in EGFR copy number variation between <5 and >10 gene copies (Figure 5A). This shoulder can be explained by the fact that EGFR is present as double minutes, which facilitates rapid high copy number gains,3 and thus argues against incorrect estimation of tumor percentage (when a smoother line may be expected). Finally, none of the 29 samples express EGFRvIII when EGFR copy numbers are low (<4), whereas the percentage is markedly higher, 103 of 187 (55.1%), in samples with >4 copy numbers (P < 0.0001; Supplementary Figure 1C). EGFR amplification precedes the rearrangement leading to EGFRvIII expression, and generally half of EGFR-amplified tumors express EGFRvIII.22 Therefore, the absence of EGFRvIII-expressing cells in samples with <5 copy numbers (and <50% FISH positive cells) also suggests that the majority of these samples are incorrectly classified, with the used FISH cutoff, as EGFR amplified. Our data therefore strongly suggest that the cutoff to determine EGFR gene amplification by FISH should be increased to a sample having >50% EGFR-amplified cells.
Basic patient demographics (age, sex, etc) were only collected for samples that were included in the Intellance 2 trial. Within this group, demographics between RT-qPCR-high and RT-qPCR-low cohorts were similar for patients for which NGS was attempted (Supplementary Table 1).
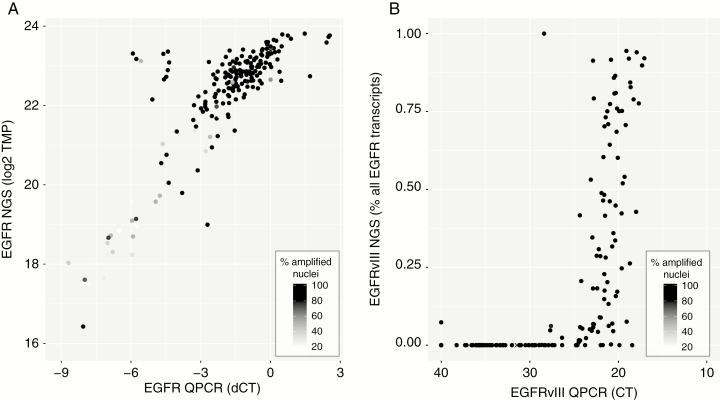
The Trusight 170 platform also includes targeted RNA sequencing of ~60 genes (including EGFR) and was successfully performed on 215 samples. Read depth of EGFR in this cohort was high; the median number of reads (combined reference and splice supporting reads) was 37 000 (interquartile range, 23 000–60 000). Comparison in EGFR expression between RT-qPCR and RNA-seq shows a high concordance between the 2 techniques, with most samples that have low expression on both platforms also containing relatively few EGFR amplified nuclei by FISH (Figure 6A). EGFRvIII expression was detected in 107 and 93 samples by RT-qPCR and RNA-seq respectively, with 91 samples identified by both platforms, unweighted kappa score 0.829. The observation that RT-qPCR identifies more EGFRvIII-expressing samples may suggest this technique has a higher sensitivity to detect these aberrant transcripts, even despite the high read depth (Figure 6B).
Fig. 6.
RT-qPCR and NGS show high correlation in determining levels of EGFR and presence of EGFRvIII. (A) EGFR expression by RT-qPCR is highly correlated with expression derived from NGS data. (B) Samples in which EGFRvIII expression is identified by RT-qPCR (ie, ΔCt < 30) often also show detectable levels of EGFRvIII by panel-based RNA-seq.
Discussion
In the era of targeted treatments for cancer patients, identifying the target with an appropriate biomarker assay has become an essential part of both clinical studies and standard of care once shown effective. The biomarker assay used should be well validated: robust, reproducible, feasible, and predictive for outcome. The present study reviews 3 different assays to identify EGFR-amplified tumors, comparing 2 assays in the screened population and another technique for the randomized patients. In addition, the presence or absence of the EGFRvIII mutation is studied. EGFRvIII is a genomic rearrangement that occurs after EGFR amplification.22–24
FISH for EGFR amplification is usually seen as a gold standard for the diagnostics of EGFR amplification, but what cutoffs (the % of positive nuclei, and the optimal ratio of EGFR vs centromere 7) should be used is unclear. For this trial, the bar to call EGFR amplification was set low, in view of the observation of a response in a patient with a relatively low level of EGFR amplification.13,14,25,26 An advantage of such a low bar in a targeted treatment trial is that it allows the assessment of efficacy of the investigational compound around the borders of the assay. By using data from >1000 samples, we provide evidence that the cutoff to determine EGFR gene amplification by FISH should be increased, preferably to >50% of EGFR-amplified nuclei. Although the number of samples in the current study was large, validation of this observation in an independent cohort would strengthen our conclusions. Such cohorts are, however, at present unavailable.
Although this FISH cutoff may better determine EGFR amplification for diagnostic purposes, response prediction in precision medicine trials (ie, the predictive power of EGFR amplification) may use different cutoff points. For example, when EGFR-amplified cells exert a dominant effect on the non-amplified neoplastic cells (whereby the non-amplified neoplastic cells depend on the EGFR-amplified cells), targeting the minority of EGFR-amplified cells may already provide clinical benefit. The observation of patients with relatively low levels of EGFR amplification respond to the combination of depatux-M + TMZ supports this notion.
Our data also demonstrate that EGFR expression can serve as a surrogate marker to determine EGFR gene amplification. However, where EGFR-FISH has a bimodal distribution, EGFR expression is much more a continuum. This continuum makes it more difficult to define the optimal cutoff for EGFR amplification. Of note, the bimodal distribution observed by FISH demonstrates that most tumors either have no amplified cells or consist entirely of amplified cells. This indicates that the frequency of mosaic amplification of various oncogenes as previously reported is therefore likely relatively low.27
In summary, the data described in the current study, obtained from central laboratories and diagnostic sequencing facilities and using material from patients eligible for clinical trial inclusion, help define the optimal cutoff for various techniques to determine EGFR amplification for selection into precision medicine trials. In the end, the most optimal cutoff should be established based on evidence of clinical activity in the positive versus the negative biomarker population. That analysis is currently ongoing. Regardless, although our study shows that these tests correlate, there is a clear gray zone in which samples test positive in one assay but not in another assay.
Funding
This research was sponsored and funded by AbbVie Inc.
Conflict of interest statement. PJF received research funding by AbbVie, MJvdB consultancy for Abbvie, Cellgene, Boehringer, BMS, AGIOS. PA, JL and EB are employees of AbbVie and may own stock. MW has received research grants from Abbvie, Adastra, Bayer, Merck, Sharp & Dohme (MSD), Dracen, Merck (EMD), Novocure, OGD2, Piqur und Roche, and honoraria for lectures or advisory board participation or consulting from Abbvie, Basilea, Bristol Meyer Squibb, Celgene, Merck, Sharp & Dohme (MSD), Merck (EMD), Novocure, Orbus, Roche, Teva, and Tocagen. JMS received research funding from Pfizer and Catalysis, consulting or advisory board for Abbvie, Celgene, and Pfizer, and travel expenses from Astellas and Abbvie. PC served on advisory boards for Abbvie.
Authorship statement. Conceptualization, PJF, MvdB. Methodology, PJF. Investigation, IdH, JMK. Writing, original draft, P.J.F. Writing, review, and editing, all authors. Funding acquisition, PJF. Resources, ME, J-MS, AW, J-SF, EF, PMC, MW, PA, JL, EB. Data curation: MM, TG. Supervision, PJF, MvdB.
Supplementary Material
References
- 1. Brennan CW, Verhaak RG, McKenna A, et al. ; TCGA Research Network The somatic genomic landscape of glioblastoma. Cell. 2013;155(2):462–477. [DOI] [PMC free article] [PubMed] [Google Scholar]
- 2. Ceccarelli M, Barthel FP, Malta TM, et al. ; TCGA Research Network Molecular profiling reveals biologically discrete subsets and pathways of progression in diffuse glioma. Cell. 2016;164(3):550–563. [DOI] [PMC free article] [PubMed] [Google Scholar]
- 3. Turner KM, Deshpande V, Beyter D, et al. . Extrachromosomal oncogene amplification drives tumour evolution and genetic heterogeneity. Nature. 2017;543(7643):122–125. [DOI] [PMC free article] [PubMed] [Google Scholar]
- 4. Lee JC, Vivanco I, Beroukhim R, et al. . Epidermal growth factor receptor activation in glioblastoma through novel missense mutations in the extracellular domain. PLoS Med. 2006;3(12):e485. [DOI] [PMC free article] [PubMed] [Google Scholar]
- 5. Klingler S, Guo B, Yao J, et al. . Development of resistance to EGFR-targeted therapy in malignant glioma can occur through EGFR-dependent and -independent mechanisms. Cancer Res. 2015;75(10):2109–2119. [DOI] [PMC free article] [PubMed] [Google Scholar]
- 6. Vivanco I, Robins HI, Rohle D, et al. . Differential sensitivity of glioma- versus lung cancer-specific EGFR mutations to EGFR kinase inhibitors. Cancer Discov. 2012;2(5):458–471. [DOI] [PMC free article] [PubMed] [Google Scholar]
- 7. Gao Y, Vallentgoed WR, French PJ. Finding the right way to target EGFR in glioblastomas; lessons from lung adenocarcinomas. Cancers (Basel). 2018;10(12):489. [DOI] [PMC free article] [PubMed] [Google Scholar]
- 8. Uhm JH, Ballman KV, Wu W, et al. . Phase II evaluation of gefitinib in patients with newly diagnosed grade 4 astrocytoma: Mayo/North Central Cancer Treatment Group Study N0074. Int J Radiat Oncol Biol Phys. 2011;80(2):347–353. [DOI] [PMC free article] [PubMed] [Google Scholar]
- 9. Chakravarti A, Wang M, Robins HI, et al. . RTOG 0211: a phase ½ study of radiation therapy with concurrent gefitinib for newly diagnosed glioblastoma patients. Int J Radiat Oncol Biol Phys. 2013;85(5):1206–1211. [DOI] [PMC free article] [PubMed] [Google Scholar]
- 10. Raizer JJ, Abrey LE, Lassman AB, et al. ; North American Brain Tumor Consortium A phase II trial of erlotinib in patients with recurrent malignant gliomas and nonprogressive glioblastoma multiforme postradiation therapy. Neuro Oncol. 2010;12(1):95–103. [DOI] [PMC free article] [PubMed] [Google Scholar]
- 11. van den Bent MJ, Brandes AA, Rampling R, et al. . Randomized phase II trial of erlotinib versus temozolomide or carmustine in recurrent glioblastoma: EORTC brain tumor group study 26034. J Clin Oncol. 2009;27(8):1268–1274. [DOI] [PMC free article] [PubMed] [Google Scholar]
- 12. Gan HK, Fichtel L, Lassman AB, et al. . A phase 1 study evaluating ABT-414 in combination with temozolomide (TMZ) for subjects with recurrent or unresectable glioblastoma (GBM). J Clin Oncol. 2014;32(5S):2021. [Google Scholar]
- 13. Lassman AB, van den Bent MJ, Gan HK, et al. . Safety and efficacy of depatuxizumab mafodotin + temozolomide in patients with EGFR-amplified, recurrent glioblastoma: results from an international phase I multicenter trial. Neuro Oncol. 2019;21(1):106–114. [DOI] [PMC free article] [PubMed] [Google Scholar]
- 14. Goss GD, Vokes EE, Gordon MS, et al. . Efficacy and safety results of depatuxizumab mafodotin (ABT-414) in patients with advanced solid tumors likely to overexpress epidermal growth factor receptor. Cancer. 2018;124(10):2174–2183. [DOI] [PMC free article] [PubMed] [Google Scholar]
- 15. Weller M, Butowski N, Tran DD, et al. ; ACT IV trial investigators Rindopepimut with temozolomide for patients with newly diagnosed, EGFRvIII-expressing glioblastoma (ACT IV): a randomised, double-blind, international phase 3 trial. Lancet Oncol. 2017;18(10):1373–1385. [DOI] [PubMed] [Google Scholar]
- 16. Johnson LA, Scholler J, Ohkuri T, et al. . Rational development and characterization of humanized anti-EGFR variant III chimeric antigen receptor T cells for glioblastoma. Sci Transl Med. 2015;7(275):275ra22. [DOI] [PMC free article] [PubMed] [Google Scholar]
- 17. Wang J, Cazzato E, Ladewig E, et al. . Clonal evolution of glioblastoma under therapy. Nat Genet. 2016;48(7):768–776. [DOI] [PMC free article] [PubMed] [Google Scholar]
- 18. van den Bent MJ, Gao Y, Kerkhof M, et al. . Changes in the EGFR amplification and EGFRvIII expression between paired primary and recurrent glioblastomas. Neuro Oncol. 2015;17(7):935–941. [DOI] [PMC free article] [PubMed] [Google Scholar]
- 19. Felsberg J, Hentschel B, Kaulich K, et al. ; German Glioma Network Epidermal growth factor receptor variant III (EGFRvIII) positivity in EGFR-amplified glioblastomas: prognostic role and comparison between primary and recurrent tumors. Clin Cancer Res. 2017;23(22):6846–6855. [DOI] [PubMed] [Google Scholar]
- 20. Na K, Kim HS, Shim HS, Chang JH, Kang SG, Kim SH. Targeted next-generation sequencing panel (TruSight Tumor 170) in diffuse glioma: a single institutional experience of 135 cases.J Neurooncol. 2019;142(3):445–454. [DOI] [PubMed] [Google Scholar]
- 21. Trang NV, Choisy M, Nakagomi T, et al. . Determination of cut-off cycle threshold values in routine RT-PCR assays to assist differential diagnosis of norovirus in children hospitalized for acute gastroenteritis. Epidemiol Infect. 2015;143(15):3292–3299. [DOI] [PMC free article] [PubMed] [Google Scholar]
- 22. Del Vecchio CA, Giacomini CP, Vogel H, et al. . EGFRvIII gene rearrangement is an early event in glioblastoma tumorigenesis and expression defines a hierarchy modulated by epigenetic mechanisms. Oncogene. 2013;32(21):2670–2681. [DOI] [PubMed] [Google Scholar]
- 23. Frederick L, Wang XY, Eley G, James CD. Diversity and frequency of epidermal growth factor receptor mutations in human glioblastomas. Cancer Res. 2000;60(5):1383–1387. [PubMed] [Google Scholar]
- 24. Nathanson DA, Gini B, Mottahedeh J, et al. . Targeted therapy resistance mediated by dynamic regulation of extrachromosomal mutant EGFR DNA. Science. 2014;343(6166):72–76. [DOI] [PMC free article] [PubMed] [Google Scholar]
- 25. Gan HK, Reardon DA, Lassman AB, et al. . Safety, pharmacokinetics, and antitumor response of depatuxizumab mafodotin as monotherapy or in combination with temozolomide in patients with glioblastoma. Neuro Oncol. 2018;20(6):838–847. [DOI] [PMC free article] [PubMed] [Google Scholar]
- 26. van den Bent M, Gan HK, Lassman AB, et al. . Efficacy of depatuxizumab mafodotin (ABT-414) monotherapy in patients with EGFR-amplified, recurrent glioblastoma: results from a multi-center, international study. Cancer Chemother Pharmacol. 2017;80(6):1209–1217. [DOI] [PMC free article] [PubMed] [Google Scholar]
- 27. Snuderl M, Fazlollahi L, Le LP, et al. . Mosaic amplification of multiple receptor tyrosine kinase genes in glioblastoma. Cancer Cell. 2011;20(6):810–817. [DOI] [PubMed] [Google Scholar]
Associated Data
This section collects any data citations, data availability statements, or supplementary materials included in this article.


