Abstract
The electrochemical aptamer sensor has been designed for detecting tau381, a critical biomarker of Alzheimer′s disease in human serum. The aptasensor is obtained by immobilizing the aptamer on a carboxyl graphene/thionin/gold nanoparticle modified glassy-carbon electrode. As a probe and bridge molecule, thionin connected carboxyl graphene and gold nanoparticles, and gave the electrical signal. Under optimal conditions, the increment of differential pulse voltammetry signal increased linearly with the logarithm of tau381 concentration in the range from 1.0 pM to 100 pM, and limit of detection was 0.70 pM. The aptasensor reliability was evaluated by determining its selectivity, reproducibility, stability, detection limit, and recovery. Performance analysis of the tau381 aptasensor in 10 patients’ serum samples showed that the aptasensor could screen patients with and without Alzheimer′s disease. The proposed aptasensor has potential for use in clinically diagnosing Alzheimer′s disease in the early stage.
Keywords: aptasensor, tau381, carboxyl graphene/thionin/gold nanoparticles, human serum, Alzheimer′s disease
1. Introduction
Patients of Alzheimer’s disease (AD) in the world were estimated to be approximately fifty million in 2018, a number that is similar to the population of Kenya, Colombia, or Korea. It will increase by threefold in 2050. At present, the annual cost of the disease is about $1 trillion, and it is estimated that the cost will be doubled by 2030 [1,2,3,4]. The outcome of AD is irreversible damage to brain cells, and AD has become a serious medical problem globally, as early screening is the only way to reduce trouble when there are no drugs available. β-amyloid and tau protein are considered to both be major proteins that form the cause of AD. Tau381 (1N3R), one of tau protein’s six subtypes, has a crucial role as a critical biomarker in the early diagnosis of AD. Using the tau-PET tracer [18F] THK5317, [(S)-[18F] THK5117] and [18F] FDG in a human cerebrospinal fluid (CSF) sample of AD patients was investigated by Leuzy et al. [5] and their study found that a subtype of tau may better capture tau pathology and synaptic impairment. Mielkea et al. reported the tau protein result of blood was in accordance with CSF and illustrated blood tau protein as a clinically useful biomarker [6].
Aptamers are short ssDNA or ssRNA nucleic acid molecules synthesized in vitro that specifically pair with proteins, nucleic acids, viruses, bacteria, parasites, and other targets [7,8]. They can fold into proper three-dimensional structures via specific matching between complimentary strands, electrostatic interactions, and hydrogen bonds, etc. Aptamers can be invoked as recognition elements superior to antibodies because of their chemical stability, ease to modify, high affinity, specificity, and fixation density on the electrodes. Krylova et al. [9] used affinity-mediated non-equilibrium capillary electrophoresis of equilibrium mixtures to study the interaction of tau381 and aptamers, and the dissociation rate constant Kd was 0.19 ± 0.01 μM; moreover, the Kd value found by Lisi et al. [10] was 116 ± 6 nM. Thus, aptamers are particularly attractive in the field of clinical testing and electrochemical sensing [11,12]. Various biosensor transductions are displayed in Table 1, fluorescence [10], electrochemistry [13,14,15,16], and surface plasmon resonance (SPR) [17,18,19], have been developed for tau biosensors. Until now, the electrochemical transduction was associated with anti-tau antibody as a recognition element.
Table 1.
A comparison of different biosensor techniques for tau detection.
| Techniques | Modified | Linear Rang | LOD | Target | Ref. |
|---|---|---|---|---|---|
| Fluorescence | FAM/ssDNA | - | 28 nM | Tau441 | [10] |
| SPR | aptamer/tau/anti-tau/ MUA |
10–100 fM | 10 fM | Tau381 | [17] |
| tau/mAb/protein G | 0.01–100 ng/mL | 10 pg/mL | Tau441 | [18] | |
| tau/anti-tau/11-MUA | 10–2000 pg/mL | 2.4 pg/mL | T-tau | [19] | |
| Electrochemistry | tau/anti-tau/pPG/GO | 0.5–15.1 nM | 0.15 nM | T-tau | [13] |
| tau/anti-tau/protein G/ DTSSP |
10−14–10−7 M | 0.03 pM | Tau441 | [14] | |
| CS-Au-Aptamer/tau/anti-tau/MPA | 0.5–100.0 pM | 0.42 pM | Tau381 | [20] | |
| tau/tau | 0.2–1.0 μM | - | Tau441 | [15] | |
| tau/anti-tau/MPA- SAM |
103–105 pg/mL | - | T-tau | [16] |
FAM: 5-Carboxyfluorescein; MUA: 11-mercaptoundecanoic acid; pPG: poly (propyleneglycol); GO: graphene oxide; DTSSP: 3, 3’-dithiobis (sulfosuccinimidyl propionate); CS: cysteamine; MPA-SAM: Self-assembled monolayers of 3-mercaptopropionic acid.
So far there is a wide utilization of graphene and graphene-related nanomaterials in sensors and medical science [21,22,23,24] due to their small size, excellent biocompatibility, excellent conductivity, ease to be functionalized, high specific surface area, and mechanical strength [25,26,27]. Carboxyl graphene (CG) as a low-dimensional carrier for the growth of gold nanoparticles (Au NPs) enhances the electronic properties of graphene because of their space constraints and synergistic interactions. The sensitivity can be greatly improved when they are combined with electrochemical detection [28].
Thionin (TH) is a phenothiazine cationic dye with conjugate ring plane structure, which is composed of two benzene rings, two amino groups, and one heterocyclic ring. TH has the properties of electrochemical reversibility, stability, and fast electron transfer as a redox probe and bridging molecule (Figure 1).
Figure 1.
The structure and reversible reaction of thionin.
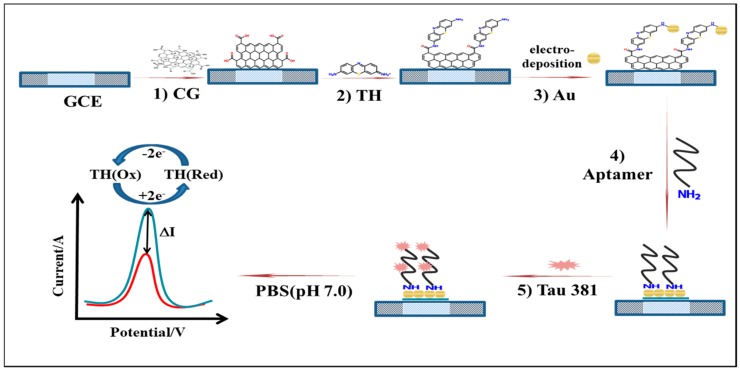
We propose to include this redox probe directly in the bionanocomposite that applied to the glassy-carbon electrode (GCE) surface. As illustrated in Scheme 1, we fabricated Au-TH-CG-aptamer as the bio-recognition element for capturing the tau381. CG was electrostatically adsorbed upon the surface of the clean GCE; then TH was conjugated to CG through π-stacking and condensation interactions [29,30]. The Au NPs were formed by electrodeposition. The amine modified tau381-aptamer interacts with Au NPs through Au-N and hydrogen bonds. The Au-TH-CG nanocomposite was prepared more quickly (less than 1 hour), without reflux, centrifugation, etc. Finally, the tau381-aptamer quickly recognized tau381 through its specific affinity.
Scheme 1.
Preparation of glassy-carbon electrode/carboxyl graphene/thionin/gold nanoparticles/aptamer/tau381 aptasensor. 1) doped carboxyl graphene on a glassy-carbon electrode surface, 2) followed by incubation with thionin, 3) electro-deposition and reduction of HAuCl4·3H2O to gold nanoparticles, then incubation with aptamer 4) and tau381 5); finally, differential pulse voltammetry evaluation of tau381 levels in human serum.
The electrochemical signal of thionin is recorded by differential pulse voltammetry (DPV) and represents the response of this label-free aptasensor. The new design scheme was further tested for the actual clinical detection of tau381.
2. Experimental
2.1. Reagent and Chemicals
The 5 mg/ml CG solution (Nanjing XFNANO Materials Tech Co., Ltd., Nanjing, China) was diluted to 80 μg/ml and then stored at 4 °C. TH and HAuCl4·3H2O were obtained by Sigma-Aldrich. Recombinant human tau381 protein (Abcam, Cambridgeshire, UK) was prepared into each concentrations of solution to be measured. The ssDNA-aptamer sequence [9] was 5′-GCGGAGCGTGG CAGG-3′, and the 5′-H2N- modified aptamer was synthesized by Sangon Biotech Co., Ltd. and purified by high performance liquid chromatography. 5 μM aptamer stock solution was prepared in 0.1M phosphate buffer saline (PBS, pH 7.4) and stored at −20 °C.
2.2. Apparatus
The prepared electrodes were characterized by field emission scanning electron microscopy (Zeiss SIGMA, Cambridge, UK). Cyclic voltammetry (CV), electrochemical impedance spectroscopy (EIS), and differential pulse voltammetry (DPV) were performed on a CHI 660E electrochemical Analyzer (CH Instruments, Shanghai, China). 3 mm diameter GCE or Au-TH-CG/GCE working electrode was combined with Pt-wire auxiliary electrode and saturated Ag/AgCl reference electrode into a three-electrode system.
2.3. Fabrication of Carboxyl Graphene/Thionin/Gold Nanoparticles Nanocomplex
Before modifying, the GCE was ultrasonic wave-cleaned in ethanol and double distilled water for a few mins, after being polished with alpha-alumina powder of 0.3 and 0.05 µm, then dried under nitrogen (N2) flow. Then 7.5 μL of CG dispersion that was previously ultrasonicated for half an hour was added to the electrode surface, the removal of excess moisture took place under an infrared light and was washed with deionized water. After nitrogen blowing, the electrode was incubated with 12.5 μL aqueous solution of TH (0.5 mM) and naturally dried [31]. Next, to form the AuNPs to the electrode, TH–CG/GCE was immersed in 0.2 mg/mL HAuCl4 for electrodeposition with cyclic sweeping [32]. The obtained Au-TH–CG/GCE was rinsed with distilled water and removed water and oxygen under N2 conditions. After that, 20 μL of 5 μM aptamer solution was dropped on the surface of the Au-TH–CG/GCE, then remained at 4 °C overnight. Finally, the excess of bio- recognition element was washed out carefully with 0.1 M PBS (pH 7.4), dried under N2 atmosphere, and the aptasensor was stored into the refrigerator for backup.
2.4. Electrochemical Detection of Tau381
The required concentration of tau381 (20 μL) was captured on the aptasensor and kept for 30 min at room temperature. Then, the electrode was washed with 0.1 M PBS (pH 7.4) to remove the non-specific binded tau381. DPV was recorded in PBS (pH 7.0) at a scanning range from −0.6 V to 0.2 V to obtain an electrochemical response. The electrode surface was gently rinsed with 0.1 M PBS (pH 7.4) and dried under N2 gas for measuring the next concentration.
2.5. Human Serum and Ethics
A total of 10 serum samples were collected by the community service center of Dongbao District in Jingmen. All subjects were over 65 years old (10 subjects divided into non-AD patient and AD patient groups). According to NINCDS-ADRDA Alzheimer’s Criteria, patients have undergone multiple neurological examinations in the CHSC and have been clinically diagnosed with AD.
This research was approved by the ethics committees of the community service center of Dongbao District and the Wuhan University of Science and Technology, which are consistent with the Helsinki Declaration, and all subjects were informed and gave agreement to participating in this investigation in advance.
3. Results and Discussion
3.1. Morphological Characterization of the Carboxyl Graphene/Thionin/Gold Nanoparticles Electrode Surface
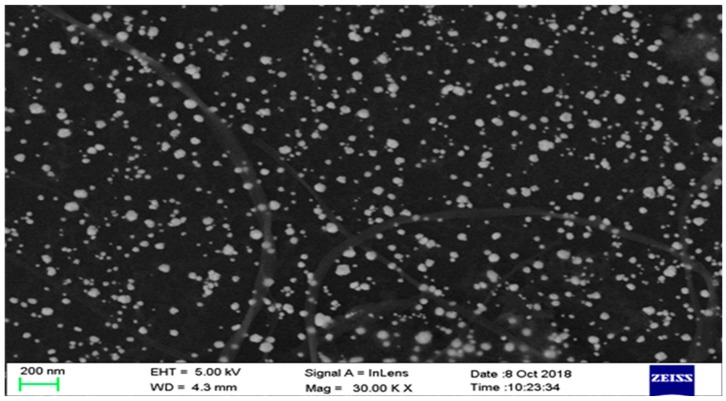
The morphologies of the prepared CG-TH-Au NPs composite on the GCE were characterized by field emission scanning electron microscope. It is easy to see that in Figure 2, the dark areas of the image are a layer of CG folds, and homogeneously distributed spherical particles of AuNPs around 50 nm in diameter. The AuNPs, on the one hand, increase the electrochemical activity; on the other hand, they provide a specific binding surface for aptamers [33,34].
Figure 2.
Field emission scanning electron microscopy image of Au NPs-TH-CG on GCE.
3.2. Electrochemical Characterization of the Aptasensor
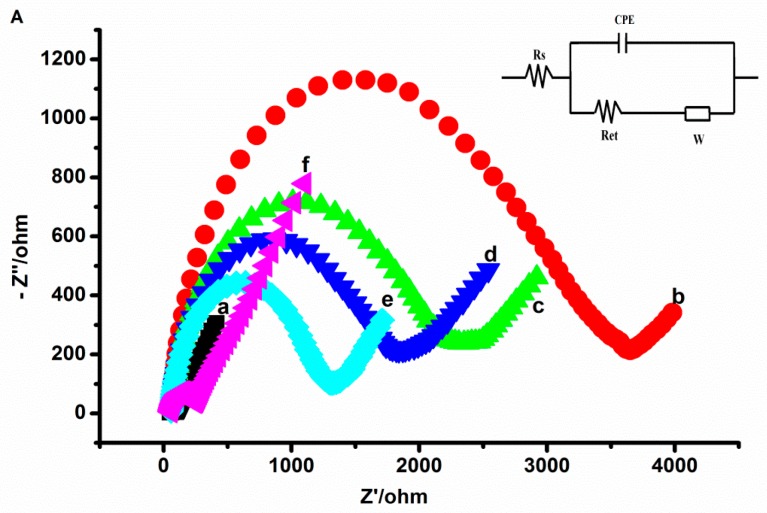
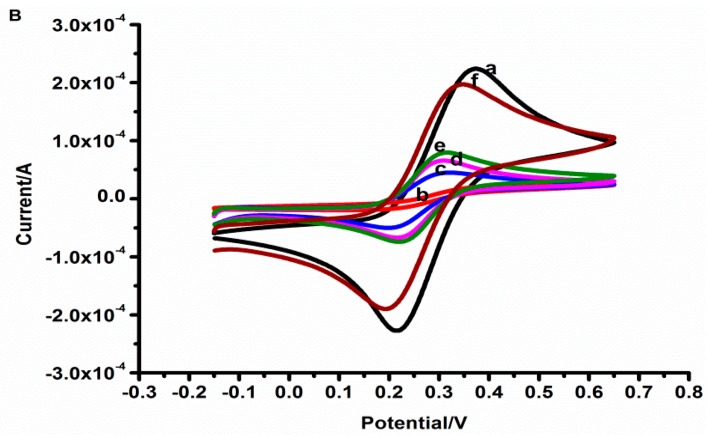
For electrochemical surface features of the fabrication steps of the aptasensor, EIS and CV were performed in 10 mM [Fe (CN)6]3−/4−. The Nyquist plots of the measured EIS data are shown in Figure 3A. The smallest semi-circle of bare GCE (curve a) can be covered, but the straight line was seen very clearly, which indicated that bare GCE presents relatively low impedance and good conductivity. Compared to bare GCE, the electron transfer resistance (Ret) increased greatly when CG was adsorbed on the GCE surface (curve b), owing to the GCE electron transfer hindrance by a dense CG film. Subsequently, the CG/GCE surface was modified with TH, the semi-circle was smaller than curve b (curve c) on account of the electronic properties of TH. After AuNPs were combined to the TH-CG/GCE, the Ret decreased again (curve d), showing the AuNPs could improve the current transmission rate. The Ret significantly decreased when the tau381-aptamer was adsorbed (curve e), the amino-modified aptamers were bound to the surface of the AuNPs. The specific recognition between aptamer and tau381 (curve f) increases the electron transfer rate.
Figure 3.
(A) Impedance plots of: bare electrode (a), CG/GCE (b), TH-CG/GCE (c), Au-TH-CG/GCE (d), Apt-Au-TH-CG/GCE (e), tau381-Apt-Au-TH-CG/GCE (f) in 10 mM [Fe(CN)6]3−/4– (1:1 ratio). In the inset, Rs, W, Ret, and CPE stand for the solution resistance, the Warburg diffusion resistance, the electron-transfer resistance, and the double layer capacitance, respectively. (B) Cyclic voltammetry of Fe(CN)6]3−/4− for: bare electrode (a), CG/GCE (b), TH-CG/GCE (c), Au-TH-CG/GCE (d), Apt-Au-TH-CG/GCE (e), tau381-Apt-Au-TH-CG/GCE (f) in 0.1M PBS (pH 7.0) containing 10 mM [Fe(CN)6] 3−/4– (1:1 ratio).
In Figure 3B, the peak currents of [Fe(CN)6]3−/4– at differently treated electrodes followed the increased trend of TH-CG/GCE(c) <Au-TH-CG/GCE (d) <Apt-Au-TH-CG/GCE (e) <tau381-Apt-Au-TH-CG/GCE (f). The CV results verified that in the presence of TH, the charge transfer rate is highly improved, which is in agreement with the EIS results.
3.3. Optimization of Effective Parameters for Aptasensor Response
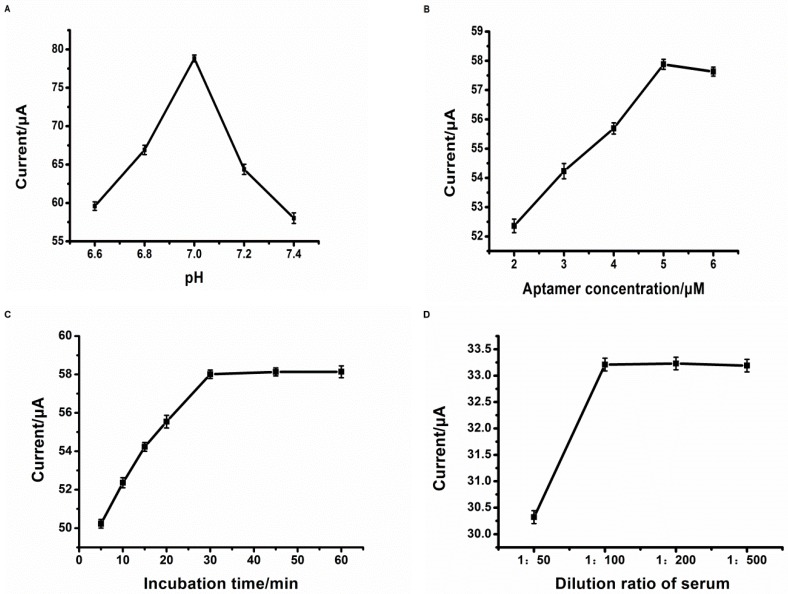
To acquire the ideal results for the aptasensor, the influence factors (e.g., pH value, aptamer concentration, incubating time, and serum dilution ratio) were optimized.
Current responses increased rapidly with the increasing pH value (Figure 4A) from 6.6 to 7.0 and then decreased steeply from 7.0 to 7.4; hence, pH 7.0 was selected as the optimal pH value. At the optimized pH value, the amperometric responses increased with aptamer concentration (Figure 4B) and then tended to constant values after 5 μM, suggesting that saturation of the tau381-aptamer occurs. As the excess tau381-aptamer could block electron transport, a higher aptamer concentration decreased the response. Therefore, subsequent experiments employed 5 μM as the best concentration for all the incubation steps of the assay.
Figure 4.
Optimization of experimental conditions for detection of tau381. pH value (A): 6.6, 6.8, 7.0, 7.2, and 7.4; aptamer concentration; (B): 2, 3, 4, 5, and 6 μM; aptamer-tau381 incubating time; (C): 5, 10, 15, 20, 30, 45, and 60 min; dilution ratio of serum; (D): 1:50, 1:100, 1:200, and 1:500, respectively. The concentration of tau381 was 20 pM and the current signal was obtained by the DPV which was carried out in 0.1 M PBS (pH 7.0) from −0.6 to 0.2 V.
Figure 4C showed the effect of the time of conjunct aptamer and tau381 on the current response of aptasensor. The current response value increased as the incubation time increased from 5 min to 30 min, and the current signal value no longer changes after 30 minutes, which showed a saturated conjugate between tau381 and aptamer. As the incubation time was over 30 min, the current signal approached a constant value. Consequently, the incubating time was chosen to be 30 min for all experiments.
The dilution ratio was also optimized on the basis of preliminary work of our research group [20]. In Figure 4D, the current responses increased with the increasing dilution ratio of serum from 1:50 to 1:100, the amperometric responses that remained changed a few over 1:100. Thus, the dilution ratio was chosen to be 1:100. When the serum was not diluted enough, fouling of the electrode led to a decrease of the electrochemical signal.
3.4. Determination of Tau381
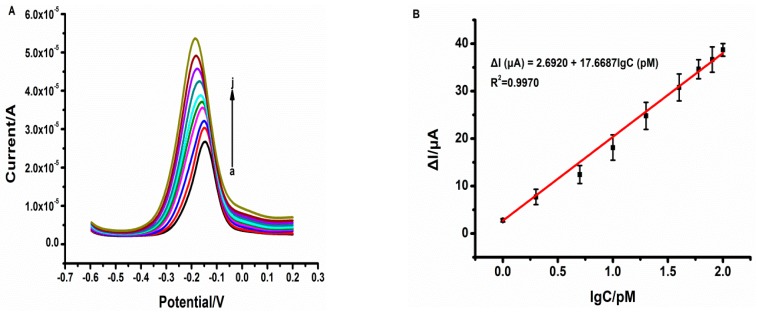
TH can act as an electrochemical redox probe because of its electrochemical reversibility properties, i.e., (TH (Ox) + 2e− ⇌ TH (Rex) was shown in Figure 1). For increasing concentration of tau381, the reduction peak of TH was observed to increase, which allows verifying of the specific binding ability of tau381 with tau381-aptamer (Figure 5A). The variation of DPV current intensity (ΔI) of aptamer-Au-TH–CG/GCE was used for quantitative detection of tau381.
Figure 5.
(A) Differential pulse voltammetry curves of tau381 concentrations including 0, 1, 2, 5, 10, 20, 40, 60, 80, and 100 pM in 0.1 M PBS (pH 7.0); (B) Plot of ΔI vs. Log of tau381 concentration (n > 3).
Under the optimized parameters, the measurement signal (ΔI) increased linearly with the logarithm of concentration of tau381 from 1 to 100 pM, and the linear curve fits a regression equation of ΔI (μA) = 2.6920 + 17.6687lgC (pM) with a correlation coefficient of 0.9985, as seen in Figure 5B. The limit of detection (LOD), calculated at a signal/noise ratio of 3, was found to be 0.70 pM. The proposed label-free aptasensor showed a slightly higher detection limit compared to that of sandwich-based tau381 immunosensors [14,20].
3.5. Selectivity, Reproducibility, and Stability
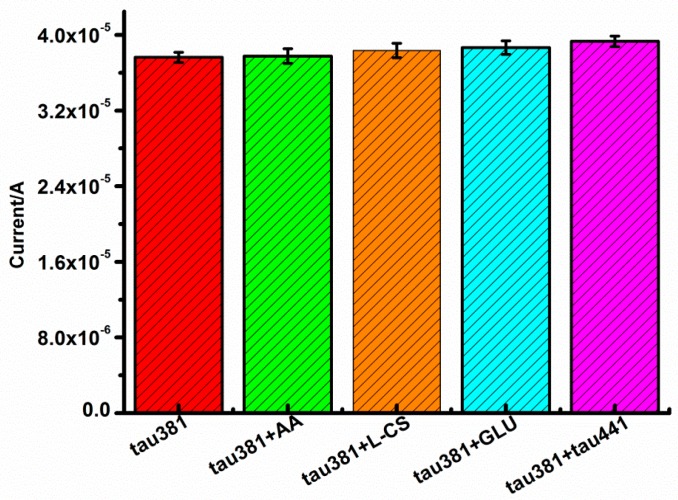
To test the selectivity of the aptasensor, ascorbic acid, L-cysteine, glucose, and tau441 were chosen as the potentially interfering substances, the 1 pM tau381 solution containing 100 pM interfering substances. The responses of interfering substances, shown in Figure 6, are 2.1%, 2.0%, 1.8%, and 1.4%, respectively (less than 5%), lower than that without interfering substance. Results of the interference test showed that the selectivity of this aptasensor was acceptable.
Figure 6.
Current response of the aptasensor to 1 pM tau381, 1 pM tau381 + 100 pM AA, 1 pM tau381 + 100 pM L-CS, 1 pM tau381 + 100 pM GLU, 1 pM tau381 + 100 pM tau441 (n > 3).
Furthermore, the reproducibility of this aptasensor was tested. Five fresh electrodes prepared independently were employed for the detection of tau381 with the same concentration (10 pM). The relative standard deviation (RSD) of the measurements was 4.9%, indicating that the aptasensor presents excellent inter-sensor repeatability for tau381 detection.
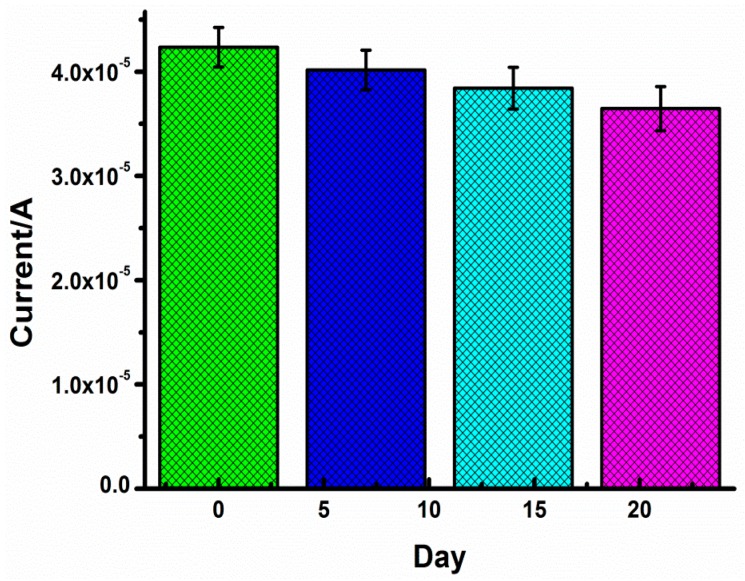
In addition, the stability was also checked in the 7th, 14th, and 21st days of storage at 4 °C, separately (Figure 7). The activity of the aptasensor can be maintained respectively at 94.88%, 90.76%, and 86.12%, showing high stability of the aptasensor. In other words, we can think the quality guarantee period of the aptamer-sensor is 21 days.
Figure 7.
Aptamer-Au-TH–CG/GCE storage at 4 °C for 0, 7, 14, and 21 days with 10 pM tau381 (n > 3).
3.6. Application in Analysis of Human Serum Samples
To demonstrate the reliability of the proposed aptasensor for real sample analysis, three human serum samples were diluted 100 times for detection. The recovery was used for determination by standard addition methods. The results from Table 2: recovery ranged from 99.1% to 101.0% and the RSDs ranged from 1.08% to 4.07%, showing that the proposing method is acceptable.
Table 2.
The detection of tau-381 in human serum samples.
| Sample No. | Initial Concentration (pM) | Add (pM) | Detection (pM) | Recovery (%) | RSDs (%) |
|---|---|---|---|---|---|
| 1 | 0.75 | 2.00 | 2.80, 2.77, 2.78, 2.72, 2.78 | 101.0 | 1.08 |
| 2 | 0.75 | 20.00 | 19.68, 22.03, 20.56, 20.89, 21.01 | 100.4 | 4.07 |
| 3 | 0.75 | 60.00 | 58.36, 59.36, 59.23, 60.66, 62.12 | 98.6 | 2.45 |
3.7. Analysis Performance of Tau381 Aptasensor in Non- and Alzheimer′s Disease Patient Samples
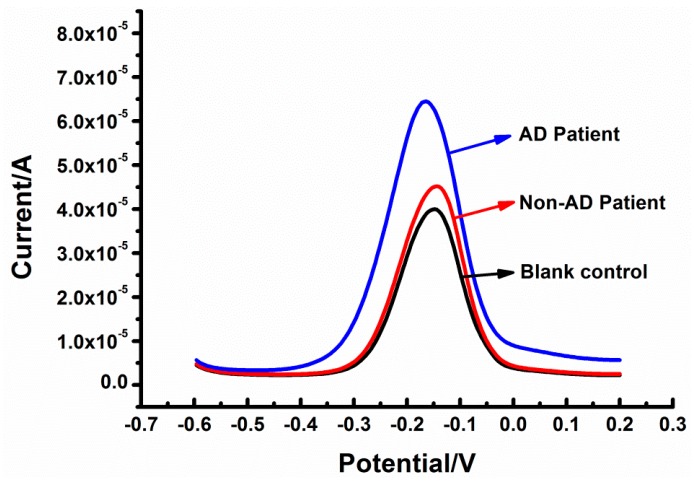
Figure 8 shows the current response of a blank control (a young man’s serum), a Non-AD patient, and an AD patient (IBlank control < INon-AD patient < IAD patient). In Table 3, we chose five Non-AD patients and AD patients. Their tau381 levels are represented by the mean value ± SD. The detection contents of Non-AD patients ranged from 1.00 ± 0.06 pM to 5.20 ± 0.74pM, and AD patients ranged from 17.78 ± 0.86 pM to 46.12 ± 0.62pM, suggesting that the aptasensor could screen patients with AD and Non-AD, in excellent agreement with the results from an ELISA kit.
Figure 8.
The dpvs of tau381 in human serum samples from blank control, non- and Alzheimer′s disease patients.
Table 3.
Assay results of clinical serum samples using aptasensor.
| Sample No. | Content Detected with the Aptasensor (Mean ± SE, pM) | Content Detected with ELISA Kit (Mean ± SE, pM) (×100) | |
|---|---|---|---|
| Non-AD Patient | 1 | 1.00 ± 0.06 | 99.84 ± 66.40 |
| 2 | 1.63 ± 0.58 | 163.40 ± 57.60 | |
| 3 | 5.20 ± 0.74 | 520.48 ± 74.37 | |
| 4 | 2.48 ± 0.62 | 247.63 ± 61.80 | |
| 5 | 2.69 ± 0.68 | 269.17 ± 67.98 | |
| AD Patient | 1 | 17.78 ± 0.86 | 1778.77 ± 85.72 |
| 2 | 40.22 ± 0.59 | 4021.88 ± 59.28 | |
| 3 | 38.83 ± 0.61 | 3882.74 ± 61.17 | |
| 4 | 46.12 ± 0.62 | 4611.54 ± 62.54 | |
| 5 | 35.58 ± 0.55 | 3558.09 ± 55.04 |
4. Conclusions
In summary, we developed a label-free electrochemical aptasensor of CG/TH/AuNPs for detecting tau381 protein successfully. The electrochemical response is based on the TH-based DPV response increment before and after the incubation of tau381. Combining CG, TH, AuNPs, and tau381 aptamer, the proposed aptasensor displayed excellent performance with good selectivity, stability, and reproducibility. In addition, a readily achievable detection limit of 0.70 pM with a linear range from 1 pM to 100 pM was obtained. The aptasensor could screen the AD patients, therefore allowing early diagnosis.
Acknowledgments
Thanks to Susan Goodacre for the touch of the language of the article.
Author Contributions
Bibliography, drafting the article; D.T., B.S., Y.G., J.C., and W.Z.; Revising the article for intellectual content; S.S., N.J.-R., and Z.G.
Funding
Zhenzhong Guo thanks for the “ChuTian Scholar” Project Award of Hubei Province (China) support. Nicole Jaffrezic-Renault thank for International research network (IRN # 0876) France-China “New nanostructured materials and biomaterials for renewable electrical energy sources” “MAREES” (2019-2022) support.
Conflicts of Interest
The authors declare no conflict of interest.
References
- 1.Escosura-Muñiz A., Plichta Z., Horák D., Merkoçi A. Alzheimer’s disease biomarkers detection in human samples by efficient capturing through porous magnetic microspheres and labelling with electrocatalytic gold nanoparticles. Biosens. Bioelectron. 2015;67:162–169. doi: 10.1016/j.bios.2014.07.086. [DOI] [PubMed] [Google Scholar]
- 2.Brier M.R., Gordon B., Friedrichsen K., McCarthy J., Stern A., Christensen J., Owen C., Aldea P., Su Y., Hassenstab J., et al. Tau and Aβ imaging, CSF measures, and cognition in Alzheimer’s disease. Sci. Transl. Med. 2016;8:338–366. doi: 10.1126/scitranslmed.aaf2362. [DOI] [PMC free article] [PubMed] [Google Scholar]
- 3.Patterson C. World Alzheimer Report 2018: The State of the Art of Dementia Research: New Frontiers. Alzheimer’s Disease International (ADI); London, UK: 2018. [Google Scholar]
- 4.Shui B., Tao D., Florea A., Cheng J., Zhao Q., Gu Y., Li W., Jaffrezic-Renault N., Mei Y., Guo Z. Biosensors for Alzheimer’s disease biomarker detection: A review. Biochimie. 2018;147:13–24. doi: 10.1016/j.biochi.2017.12.015. [DOI] [PubMed] [Google Scholar]
- 5.Leuzy A., Cicognola C., Chiotis K., Saint-Aubert L., Lemoine L., Andreasen N., Zetterberg H., Ye K., Blennow K., Höglund K., et al. Longitudinal tau and metabolic PET imaging in relation to novel CSF tau measures in Alzheimer’s disease. Eur. J. Nucl. Med. Mol. Imaging. 2019;46:1152–1163. doi: 10.1007/s00259-018-4242-6. [DOI] [PMC free article] [PubMed] [Google Scholar]
- 6.Mielkea M.M., Hagen C.E., Xu J., Chai X., Vemurie P., Lowee V.J., Aireyd D.C., Knopman D.S., Roberts R.O., Machulda M.M., et al. Plasma phospho-tau181 increases with Alzheimer’s disease clinical severity and is associated with tau- and amyloid-positron emission tomography. Alzheimer’s Dement. 2018;14:989–997. doi: 10.1016/j.jalz.2018.02.013. [DOI] [PMC free article] [PubMed] [Google Scholar]
- 7.Tuerk C., Gold L. Systematic evolution of ligands by exponential enrichment: RNA ligands to bacteriophage T4 DNA polymerase. Science. 1990;249:505–510. doi: 10.1126/science.2200121. [DOI] [PubMed] [Google Scholar]
- 8.Ellington A.D., Szostak J.W. In vitro selection of RNA molecules that bind specific ligands. Nature. 1990;346:818–822. doi: 10.1038/346818a0. [DOI] [PubMed] [Google Scholar]
- 9.Krylova S.M., Musheev M., Nutiu R., Li Y., Lee G., Krylov S.N. Tau protein binds single-stranded DNA sequence specifically—The proof obtained in vitro with non-equilibrium capillary electrophoresis of equilibrium mixtures. FEBS Lett. 2005;579:1371–1375. doi: 10.1016/j.febslet.2005.01.032. [DOI] [PubMed] [Google Scholar]
- 10.Lisi S., Fiore E., Scarano S., Pascale E., Boehman Y., Ducongé F., Chierici S., Minunni M., Peyrin E., Ravelet C. Non-SELEX isolation of DNA aptamers for the homogeneous-phase fluorescence anisotropy sensing of tau Proteins. Anal. Chim. Acta. 2018;1038:173–181. doi: 10.1016/j.aca.2018.07.029. [DOI] [PubMed] [Google Scholar]
- 11.Guo W., Sun N., Qin X., Pei M., Wang L. A novel electrochemical aptasensor for ultrasensitive detection of kanamycin based on MWCNTs–HMIMPF6 and nanoporous PtTi alloy. Biosens. Bioelectron. 2015;74:691–697. doi: 10.1016/j.bios.2015.06.081. [DOI] [PubMed] [Google Scholar]
- 12.Zhu G., Ye M., Donovana M.J., Song E., Zhao Z., Tan W. Nucleic Acid Aptamers: An Emerging Frontier in Cancer Therapy. Chem. Commun. 2012;48:10472–10480. doi: 10.1039/c2cc35042d. [DOI] [PMC free article] [PubMed] [Google Scholar]
- 13.Derkus B., Bozkurt P.A., Tulu M., Emregul K.C., Yucesan C., Emregul E. Simultaneous quantification of Myelin Basic Protein and Tau proteins in cerebrospinal fluid and serum of Multiple Sclerosis patients using nanoimmunosensor. Biosens. Bioelectron. 2017;89:781–788. doi: 10.1016/j.bios.2016.10.019. [DOI] [PubMed] [Google Scholar]
- 14.Wang X., Acha D., Shah A.J., Hills F., Roitt I., Demosthenous A., Bayford R.H. Detection of the tau protein in human serum by a sensitive four-electrode electrochemical biosensor. Biosens. Bioelectron. 2017;92:482–488. doi: 10.1016/j.bios.2016.10.077. [DOI] [PubMed] [Google Scholar]
- 15.Esteves-Villanueva J.O., Trzeciakiewicz H., Martic S. A protein-based electrochemical biosensor for detection of tau protein, a neurodegenerative disease biomarker. Analyst. 2014;139:2823–2831. doi: 10.1039/C4AN00204K. [DOI] [PubMed] [Google Scholar]
- 16.Dai Y., Molazemhosseini A., Liu C.C. A Single-Use, In Vitro Biosensor for the Detection of T-Tau Protein, a Biomarker of Neuro-Degenerative Disorders, in PBS and Human Serum Using Differential Pulse Voltammetry (DPV) Biosensors. 2017;7:10. doi: 10.3390/bios7010010. [DOI] [PMC free article] [PubMed] [Google Scholar]
- 17.Kim S., Wark A.W., Lee H.J. Femtomolar Detection of Tau Proteins in Undiluted Plasma Using Surface Plasmon Resonance. Anal. Chem. 2016;88:7793–7799. doi: 10.1021/acs.analchem.6b01825. [DOI] [PubMed] [Google Scholar]
- 18.Vestergaard M., Kerman K., Kim D.-K., Hiep H.M., Tamiya E. Detection of Alzheimer’s tau protein using localized surface plasmon resonance-based immunochip. Talanta. 2008;74:1038–1042. doi: 10.1016/j.talanta.2007.06.009. [DOI] [PubMed] [Google Scholar]
- 19.Nu T.T.V., Tran N.H.T., Nam E., Nguyen T.T., Yoon W.J., Cho S., Kim J., Chang K.-A., Ju H. Blood-based immunoassay of tau proteins for early diagnosis of Alzheimer’s disease using surface plasmon resonance fiber sensors. RSC Adv. 2018;8:7855–7862. doi: 10.1039/C7RA11637C. [DOI] [PMC free article] [PubMed] [Google Scholar]
- 20.Shui B., Tao D., Cheng J., Mei Y., Jaffrezic-Renault N., Guo Z. A novel electrochemical aptamer–antibody sandwich assay for the detection of tau-381 in human serum. Analyst. 2018;143:3549–3554. doi: 10.1039/C8AN00527C. [DOI] [PubMed] [Google Scholar]
- 21.Fang X., Liu J., Wang J., Zhao H., Ren H., Li Z. Dual signal amplification strategy of Au nanopaticles/ZnO nanorods hybridized reduced graphene nanosheet and multienzyme functionalized Au@ZnO composites for ultrasensitive electrochemical detection of tumor biomarker. Biosens. Bioelectron. 2017;97:218–225. doi: 10.1016/j.bios.2017.05.055. [DOI] [PubMed] [Google Scholar]
- 22.Chen M., Hou C., Huo D., Fa H., Zhao Y., Shen C. A sensitive electrochemical DNA biosensor based on three-dimensional nitrogen-doped graphene and Fe3O4 nanoparticles. Sens. Actuators B Chem. 2017;239:421–429. doi: 10.1016/j.snb.2016.08.036. [DOI] [Google Scholar]
- 23.Zhu L., Luo L., Wang Z. DNA electrochemical biosensor based on thionine-graphene nanocomposite. Biosens. Bioelectron. 2012;35:507–511. doi: 10.1016/j.bios.2012.03.026. [DOI] [PubMed] [Google Scholar]
- 24.Ye Y., Xie J., Ye Y., Cao X., Zheng H., Xu X., Zhang Q. A label-free electrochemical DNA biosensor based on thionine functionalized reduced graphene oxide. Carbon. 2018;129:730–737. doi: 10.1016/j.carbon.2017.12.060. [DOI] [Google Scholar]
- 25.Pumera M. Graphene-based nanomaterials and their electrochemistry. Chem. Soc. Rev. 2010;39:4146–4157. doi: 10.1039/c002690p. [DOI] [PubMed] [Google Scholar]
- 26.Wang L., Zhu J., Han L., Jin L., Zhu C., Wang E., Dong S. Graphene-Based Aptamer Logic Gates and Their Application to Multiplex Detection. ACS Nano. 2012;6:6659–6666. doi: 10.1021/nn300997f. [DOI] [PubMed] [Google Scholar]
- 27.Yu D.S., Kuila T., Kim N.H., Lee J.H. Enhanced properties of aryl diazonium salt-functionalized graphene/poly(vinyl alcohol) composites. Chem. Eng. J. 2014;245:311–322. doi: 10.1016/j.cej.2014.02.025. [DOI] [Google Scholar]
- 28.Shi A., Wang J., Han X., Fang X., Zhang Y. A sensitive electrochemical DNA biosensor based on goldnanomaterial and graphene amplified signal. Sens. Actuators B Chem. 2014;200:206–212. doi: 10.1016/j.snb.2014.04.024. [DOI] [Google Scholar]
- 29.Dong X., Yuan L., Liu Y., Wu M., Liu B., Sun Y., Shen Y., Xu Z. Development of a progesterone immunosensor based on thionine-graphene oxide composites platforms: Improvement by biotin-streptavidin-amplified system. Talanta. 2017;170:502–508. doi: 10.1016/j.talanta.2017.04.054. [DOI] [PubMed] [Google Scholar]
- 30.Tabrizi M.A., Shamsipur M., Saber R., Sarkar S. Simultaneous determination of CYC and VEGF165 tumor markers based on immobilization of flavin adenine dinucleotide and thionine as probes on reduced graphene oxide-poly(amidoamine)/gold nanocomposite modified dual working screen-printed electrode. Sens. Actuators B Chem. 2017;240:1174–1181. doi: 10.1016/j.snb.2016.09.108. [DOI] [Google Scholar]
- 31.Filip J., Zavahira S., Klukova L., Tkac J., Kasak P. Immobilization of concanavalin A lectin on a reduced graphene oxidethionine surface by glutaraldehyde crosslinking for the construction of an impedimetric biosensor. J. Electroanal. Chem. 2017;794:156–163. doi: 10.1016/j.jelechem.2017.04.019. [DOI] [Google Scholar]
- 32.Adams N.M., Jackson S.R., Haselton F.R., Wright D.W. Design, synthesis, and characterization of nucleic-acid-functionalized gold surfaces for biomarker detection. Langmuir. 2012;28:1068–1082. doi: 10.1021/la2028862. [DOI] [PMC free article] [PubMed] [Google Scholar]
- 33.Zhang Z., Luo L., Zhu L., Ding Y., Deng D., Wang Z. Aptamer-linked biosensor for thrombin based on AuNPs/thionine–graphene nanocomposite. Analyst. 2013;138:5365–5370. doi: 10.1039/c3an01006f. [DOI] [PubMed] [Google Scholar]
- 34.Pakiari A.H., Jamshidi Z. Interaction of Amino Acids with Gold and Silver Clusters. J. Phys. Chem. A. 2007;111:4391–4396. doi: 10.1021/jp070306t. [DOI] [PubMed] [Google Scholar]


