Abstract
In this paper, we present the simulation of 5 different heart failures with the help of the Cardiovascular Simulation Toolbox (CVST) proposed by O. Barnea et al. at Tel-Aviv University. This is a modified version of the CVST, proposed by G.Ortiz; here, we show that the pathological failures can be covered by this tool. We varied the value of the tool blocks, included the results of the hemodynamic parameters and the P-V loop curves for each disease and compared them to the medical data to prove the effectiveness of the simulation. Based on these changes, we achieved an effective simulation of the following heart failures in the CVST: Diastolic Heart Failure (DHF), Systolic Heart Failure (SHF), Right Ventricle Heart Failure (RVHF), Low Output Heart Failure (LOHF) and High Output Heart Failure (HOHF).
Keywords: cardiovascular simulation toolbox, heart failures, heart simulation
1. Introduction
Circuits not only allow us to develop complex electronic systems, they also help us in the simulation and modeling of physical systems. The cardiovascular system is one the many examples which can be represented through an electric equivalent system. To set some examples: the heart operates like a hydraulic pump whose blood pressure output behaves like a variable tension source; the heart beats produce sudden shifts in the internal pressure, which makes the tissue in our heart expand as a circuit would react during its transitory phase; veins can be represented electrically as a serial line with complex impedance. Due to these circumstances, the circulatory human system can be represented and simulated by an equivalent electric system.
In this paper, the human heart is simulated alongside some other heart failures. These simulations were implemented in MATLAB/Simulink®R2015a using the Cardiovascular Simulation Toolbox (CVST) tool which was originally created by O. Barnea [1] and was later updated in Reference [2]. Only for a matter of clarity, in this paper, we are calling this updated version of the toolbox CVST-2. This tool has a series of programmed blocks that represent different sections of the circulatory system. To achieve a successful simulation of different heart failures, the obtained values were contrasted with the results of other existing models and medical data gathered in specialized laboratories.
Simulations of the human body can be useful for developing medical equipment, since complex devices such as VAD (Ventricular Assistance Device) or pacemakers could be better developed by taking in account this extra layer of information in their design stages. Tools, such as the one presented in this paper, could benefit the design process by predicting and estimating the human body behavior after a device has been implanted.
Heart failures are caused by a dysfunction of the heart, which denies an adequate blood flow and correct transport of oxygen and nutrients necessary to the metabolism of different tissues [3]. They can be divided in two types [4]:
Depending of the output in the ventricles: “High-Output” and “Low-Output”.
Depending of their location: “Left-Sided Systolic,” “Left-Sided Diastolic” and “Right-Sided Right-Ventricle.”
Heart failures could also be explained in terms of their causes and effects. Since it was necessary to observe the effect of different diseases in the cardiovascular system, the model of a healthy condition [2] was modified to obtain different failures; this was accomplished due to the ease and flexibility of the programmed blocks of the CVST-2.
2. Simulation Model
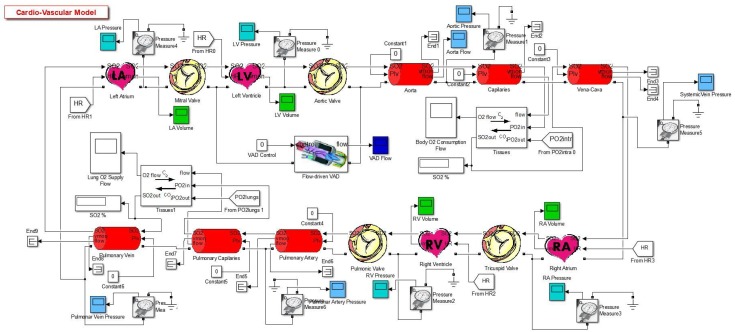
The CVST-2 tool is a series of programmed blocks which together describes the behavior of the different parts of the cardiovascular system, inside them are a series of electrical connections of different active and passive components, signals and mathematical operations. This tool is divided in five categories:
Heart: Contains auricles, ventricles and valves.
Measurements: Designed to obtain and visualize different parameters in the system.
Veins: Contains power transmission-based circuits.
Oxygen Transport: Contains blocks which calculate the oxygen concentration and the gas exchange between blood and the tissues.
Other: Groups the other components that don’t fit the description of the previous categories, such as resistances and flow valves [2].
The complete model sketch of the cardiovascular system in a “healthy condition” can be appreciated in Figure 1.
Figure 1.
Complete model [2].
The “healthy condition” refers to the simulation obtained of a healthy person, by using the CVST-2 tool. In addition, this simulation was previously validated by comparing its results with standard medical values of a healthy person [2]. This comparison between the simulation and the medical data is shown in Table 1. Since the simulation values are inside the established limits, this confirms the validity of the simulation for a healthy heart.
Table 1.
Comparison of hemodynamic parameters between a healthy person and the Cardiovascular Simulation Tool (CVST-2) simulation.
| Parameter | Units | Reference Value | Normal | |
|---|---|---|---|---|
| Min | Max | |||
| Heart Rate | bpm | 48–105 [6] | 75 | - |
| Cardiac output | L/min | 4.0–8.0 [6] | 6.7154 | - |
| Left Ventricular Volume | mL | 16–239 [7] | 62.5976 | 152.1365 |
| Right Ventricular Volume | mL | 50–160 [6] | 78.7093 | 152.6721 |
| Left Atrial Volume | mL | 25.3–109.7 [9] | 19.3332 | 102.0856 |
| Right Atrial Volume | mL | 26.4–121.5 [9] | 7.3287 | 79.7041 |
| Arterial Pressure | mmHg | 60–140 [10] | 68.47 | 144.3845 |
| Left Ventricular Pressure | mmHg | 0–140 [10] | 1.8499 | 147.8072 |
| Left Atrial Pressure | mmHg | 4.0–12 [6] | 0.4368 | 30.1822 |
| Right Ventricular Pressure | mmHg | 2.0–30 [6] | 2.1612 | 41.7744 |
| Right Atrial Pressure | mmHg | 2.0–6.0 [6] | 0.2426 | 21.4079 |
| LV Stroke Volume | mL | 60–100 [6] | 89.5389 | - |
| RV Stroke Volume | mL | 60–100 [6] | 73.9628 | - |
| LV End-Diastolic Volume | mL | 120 (65–239) [8] | 152.1365 | - |
| LV End-Systolic Volume | mL | 50 (16–143) [8] | 62.5976 | - |
| RV End-Diastolic Volume | mL | 100–160 [6] | 152.6721 | - |
| RV End-Systolic Volume | mL | 50–100 [6] | 78.7093 | - |
| LV Ejection Fraction | % | 59.9 (18–76) [8] | 58.8543 | - |
| RV Ejection Fraction | % | 40–60 [6] | 48.4455 | - |
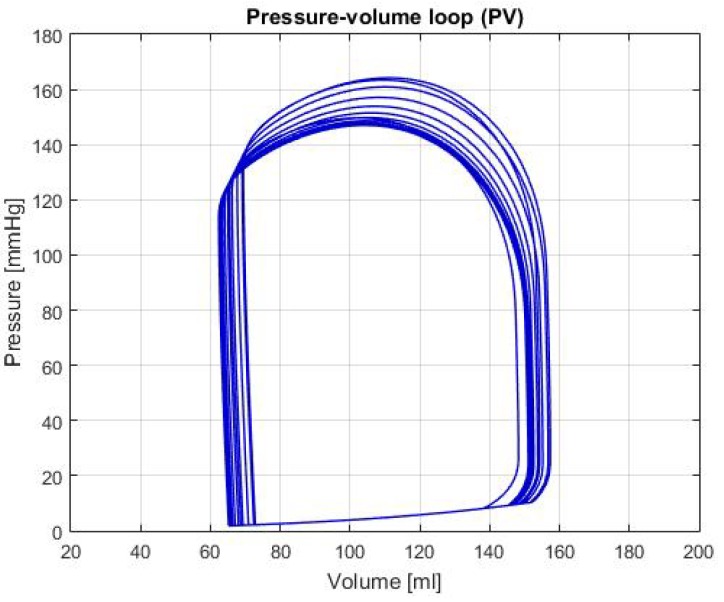
Moreover, this tool prints the curves or functions of the different hemodynamic parameters shown in Table 1. An example of this, which is not explicit in the previous table, is shown in the Figure 2, where a P-V loop can be observed. This specific graph allows us to identify a diversity of conditions, such as changes in the elastance, as well as hemodynamic parameters like the Left Ventricular End-Diastolic Volume (LVEDV), Left Ventricular End-Systolic Volume (LVESV) and Left Ventricular Stroke Volume (LVSV), among others [5]. With these parameters is possible to determine whether the heart is healthy or presents a failure condition. It should be noted that the data used for the reference values in Table 1, were obtained from [6,7,8,9,10].
Figure 2.
Graph of P-V loop curves in the left ventricle with a healthy condition.
3. About the Heart Failures
The simulated heart failures presented in this article are the following:
High-Output Heart Failure (HOHF): It happens when the body needs high levels of blood, due to that the heart beat faster than usual [11]. Causes of HOHF could be: Anemia, hipoertiroidism, arteriovenous fistula, Beriberi illnesses and Paget’s in Reference [12]. Lobato [13] mentions that HOHF is the result of an increase in the diastolic pressure and the volume on the left ventricle. Some effects are: marked vasodilatation, pulse increase, water and salt retention, renal fluid diminution and activation on the neuroendocrine system [13]. Also, heart function could be supra normal but this will be inadequate for the high metabolic necessities [4].
Low-Output Heart Failure (LOHF): It happens due to cardiac disorders that damages the adequate bombing function, due to diastolic and systolic dysfunctions. LOHF can produce damage to the valves, arrhythmia, vasoconstrictions and cyanotic and cold extremities. The cardiac output is normal but it tends to decrease when the body undergoes physical exertion [4].
Systolic Heart Failure (SHF): It is the heart’s incapacity of bombing blood at its normal speed. The ejection fraction in the left ventricle plays an important role when diagnosing it, due to its significant diminution. This is a lethal sickness hence, deaths are very spontaneous [14]. Some physical effects are: the cavity of the left ventricle dilates, although the thickness of the wall maintains in a similar way; the contractile function of the heart seems to reduce. Due to that fact, the ejection fraction reduces and so the systolic volume.
Diastolic Heart Failure (DHF): It relates with the difficulty of filling one or both ventricles, as also, the camera of the ventricle does not accept the appropriate level of normal blood pressure. In this case, the quantity of blood that is bombed every beat in the left ventricle is normal [14]. Some risk factors are: diabetes, hypertension, age, obesity and coronary artery sickness. Physically, the cavity of the left ventricle maintains the same or reduces but on the other hand, the thickness of the wall increases significantly.
Right-Ventricle Heart Failure (RVHF): It is a consequence from the damage resulted in the left side of the heart, the increase of blood pressure transfers to the lungs, thus going back to the right side of the heart. The blood accumulates in the veins, each time that the right ventricle loses pumping power. Some effects of RVHF are: inflammations in ankles and legs [15].
4. Results
The results of different simulations with input values in Table 2, are shown in Table 3. This is a comparative table between the output of the different parameters in the conditions previously described and the healthy condition.
Table 2.
Values of the input variables for the simulation of different conditions.
| Variable | Normal | SHF | RVHF | LOHF | HOHF | DHF |
|---|---|---|---|---|---|---|
| Heart Rate | 75 | 75 | 75 | 65 | 100 | 75 |
| LV Emax | 2.5 | 1 | 2.8 | 2 | 2.9 | 2.5 |
| LV P-V graph intercepted volume | 15 | 60 | 15 | 15 | 50 | 15 |
| LV End-Diastolic Volume | 112 | 137 | 120 | 112 | 132 | 112 |
| MV Resistance | 0.02 | 0.05 | 0.03 | 0.02 | 0.03 | 0.05 |
| AV Resistance | 0.002 | 0.005 | 0.003 | 0.006 | 0.008 | 0.005 |
| RV Emax | 0.85 | 0.35 | 0.3 | 0.85 | 0.85 | 0.85 |
| RV P-V graph intercepted volume | 50 | 60 | 50 | 50 | 50 | 50 |
| RV Initial Volume | 80 | 65 | 80 | 80 | 80 | 80 |
| TV Resistance | 0.02 | 0.05 | 0.03 | 0.03 | 0.03 | 0.05 |
| PV Resistance | 0.002 | 0.005 | 0.008 | 0.004 | 0.003 | 0.005 |
| LA Emax | 1 | 0.8 | 1 | 1 | 1 | 0.8 |
| LA BFR | 0.1 | 0.15 | 0.1 | 0.1 | 0.1 | 0.15 |
| RA Emax | 1 | 0.8 | 1 | 1 | 1 | 0.8 |
| RA BFR | 0.1 | 0.2 | 0.1 | 0.1 | 0.1 | 0.2 |
Table 3.
Output hemodynamic values for different heart failures in the CVST-2.
| Parameter | Units | Normal | SHF | RVHF | LOHF | HOHF | DHF | |||||||
|---|---|---|---|---|---|---|---|---|---|---|---|---|---|---|
| Min | Max | Min | Max | Min | Max | Min | Max | Min | Max | Min | Max | |||
| HR | Heart Rate | bpm | 75 | - | 75 | - | 75 | - | 65 | - | 100 | - | 75 | - |
| CO | Cardiac output | L/min | 6.7154 | - | 3.3494 | - | 5.5054 | - | 5.879 | - | 7.0117 | - | 3.7728 | - |
| LVV | Left Ventricular Volume | mL | 62.5976 | 152.1365 | 135.793 | 180.4515 | 50.9441 | 124.3494 | 70.7789 | 161.2252 | 90.635 | 160.7519 | 45.439 | 95.7433 |
| RVV | Right Ventricular Volume | mL | 78.7093 | 152.6721 | 117.8721 | 156.0561 | 128.5198 | 189.2988 | 78.5933 | 154.2769 | 77.3493 | 134.5208 | 74.253 | 115.8001 |
| LAV | Left Atrial Volume | mL | 19.3332 | 102.0856 | 27.195 | 83.431 | 18.7101 | 93.7377 | 20.826 | 114.4978 | 16.2727 | 80.9615 | 29.0205 | 84.0079 |
| RAV | Right Atrial Volume | mL | 7.3287 | 79.7041 | 11.3458 | 50.6052 | 11.3257 | 82.8504 | 9.0201 | 89.2757 | 6.2522 | 62.3506 | 9.909 | 50.3329 |
| AP | Arterial Pressure | mmHg | 68.47 | 144.3845 | 44.4787 | 81.3584 | 59.2085 | 122.4431 | 60.1552 | 129.1583 | 75.4493 | 146.3819 | 46.3871 | 89.3429 |
| LVP | Left Ventricular Pressure | mmHg | 1.8499 | 147.8072 | 7.9626 | 84.8965 | 1.3463 | 126.253 | 2.243 | 134.5208 | 3.4325 | 154.4136 | 1.1235 | 93.3702 |
| LAP | Left Atrial Pressure | mmHg | 0.4368 | 30.1822 | 0.5485 | 35.1587 | 0.4093 | 31.3536 | 0.4849 | 37.0309 | 0.3594 | 31.2227 | 0.5907 | 36.8683 |
| RVP | Right Ventricular Pressure | mmHg | 2.1612 | 41.7744 | 4.5958 | 30.7118 | 5.5388 | 37.0351 | 2.1566 | 41.3696 | 2.0972 | 41.3268 | 1.961 | 33.6142 |
| RAP | Right Atrial Pressure | mmHg | 0.2426 | 21.4079 | 0.2441 | 21.5873 | 0.2674 | 28.7435 | 0.2673 | 26.1614 | 0.1876 | 23.3241 | 0.2349 | 19.7209 |
| LVSV | Left Ventricular Stroke Volume | mL | 89.5389 | - | 44.6585 | - | 73.4053 | - | 90.4463 | - | 70.117 | - | 50.3043 | - |
| RVSV | Right Ventricular Stroke Volume | mL | 73.9628 | - | 38.184 | - | 60.779 | - | 75.6836 | - | 57.1715 | - | 41.5471 | - |
| LVEDV | Left Ventricular End-Diastolic Volume | mL | 152.1365 | - | 180.4515 | - | 124.3494 | - | 161.2252 | - | 160.7519 | - | 95.7433 | - |
| LVESV | Left Ventricular End-Systolic Volume | mL | 62.5976 | - | 135.793 | - | 50.9441 | - | 70.7789 | - | 90.635 | - | 45.439 | - |
| RVEDV | Right Ventricular End-Diastolic Volume | mL | 152.6721 | - | 156.0561 | - | 189.2988 | - | 154.2769 | - | 134.5208 | - | 115.8001 | - |
| RVESV | Right Ventricular End-Systolic Volume | mL | 78.7093 | - | 117.8721 | - | 128.5198 | - | 78.5933 | - | 77.3493 | - | 74.253 | - |
| LVEF | Left Ventricular Ejection Fraction | % | 58.8543 | - | 24.7482 | - | 59.0315 | - | 56.0993 | - | 43.6181 | - | 52.5409 | - |
| RVEF | Right Ventricular Ejection Fraction | % | 48.4455 | - | 24.4681 | - | 32.1075 | - | 49.057 | - | 42.5001 | - | 35.8783 | - |
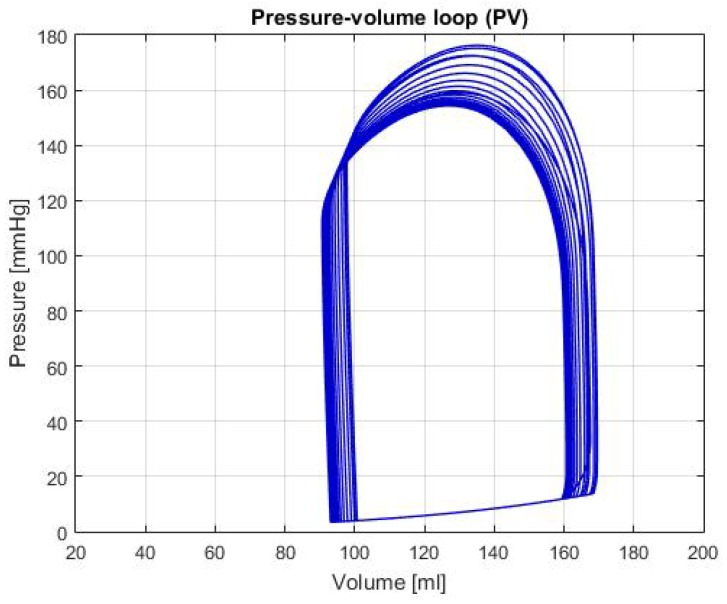
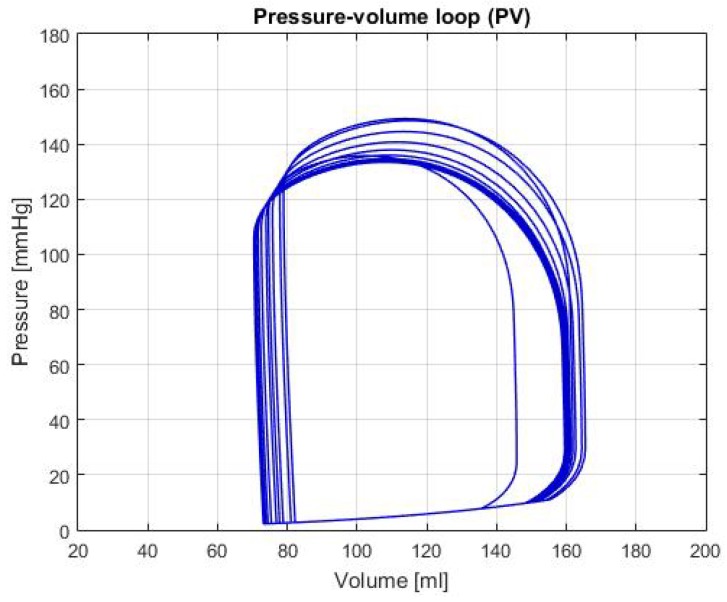
Moreover, the graphs of P-V loops will be shown for a further and more extensive comprehension of the simulated conditions. This type of graph helps us describe the behavior of the heart such as its effectiveness to pump blood and the internal efforts, among other characteristics. Figure 3 shows the P-V loop of the HOHf simulation in the CVST-2; similarly, Figure 4 shows in the same axes the P-V loop of the LOHF simulation.
Figure 3.
Graph of P-V loop curves with High Output Heart Failure (HOHF).
Figure 4.
Graph of P-V loop curves with Low Output Heart Failure (LOHF).
It should be noted, that depending of each simulation the curve in the graph shows displacements in the horizontal axis, which represents the amount of blood in the chamber. Also, the increase or decrease in height represents the rise or fall of pressure; which is also useful to describe health conditions in patients. For the first two graphs, although the curve stays centered between the volumes of 80 mL and 180 mL; we can see that each one has a different height, which means that the simulations predict conditions of high and low pressure.
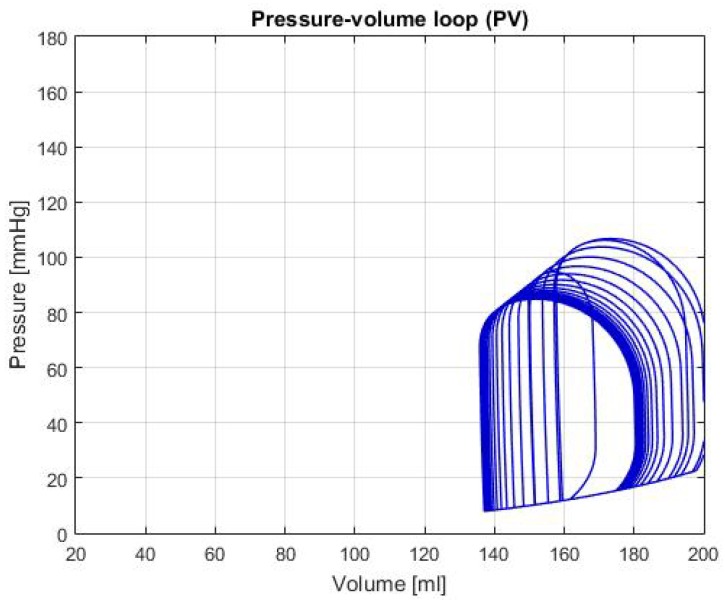
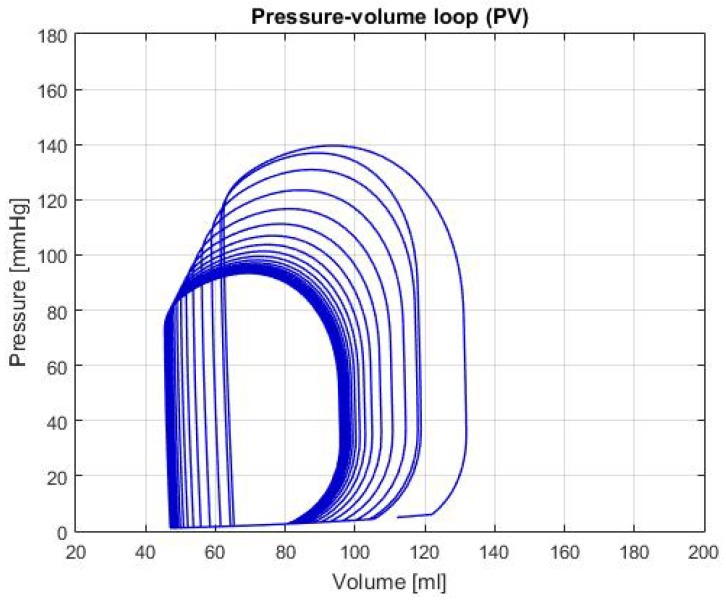
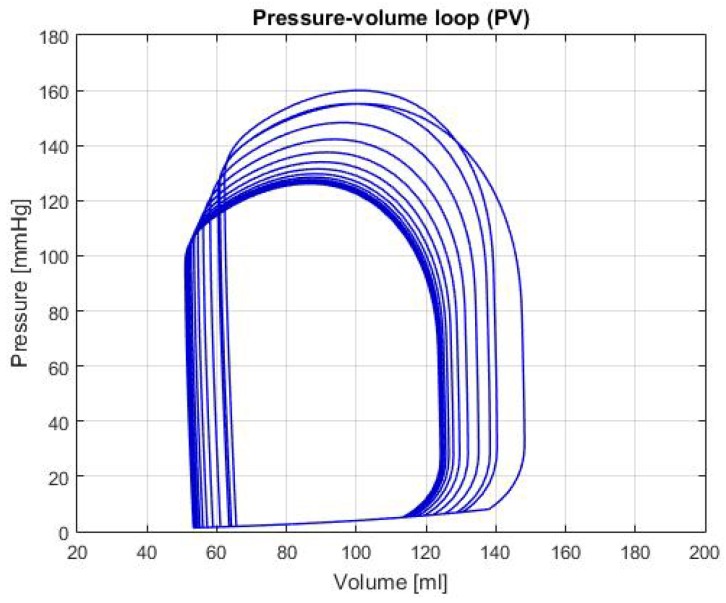
Figure 5 shows the P-V loop of the SHF simulation; Figure 6 shows the same type of curve and in the same axes used before for the DHF simulation. Finally, Figure 7 shows the P-V loop for the RVHF simulation. The conditions showed in the three previous graphs, shows that the curves are moved along the horizontal axis; this indicate that the simulations are related to conditions in which the structure of the heart (wall’s thickness and chamber’s cavities) could be altered.
Figure 5.
Graph of P-V loop curves with Systolic Heart Failure (SHF).
Figure 6.
Graph of P-V loop curves with Diastolic Heart Failure (DHF).
Figure 7.
Graph of P-V loop curves with Right Ventricle Heart Failure (RVHF).
5. Discussion
Given the results shown in the previous section, we analyzed the data and compared each simulation with the general characteristics, as well as some parameters from different authors, to evaluate if the simulated condition is representative of each heart failure.
HOHF: As shown in Figure 3, there’s a displacement to the right of the P-V loop curve, which indicates a raise of the volume in the left ventricle of the heart. In addition, the increase in pressure of curve represents a condition of exertion in the heart muscles, therefore, there’s an expected higher output of blood. This is demonstrated by the data shown in Table 2, where the CO and HB increase relative to the healthy condition; both conditions are typical in this type of failure. Furthermore, the expected values for the cardiac output and heart beats are around 8 L/min [16] and between 85 and 105 bpm [17]; in both cases, the values are approximately the same which demonstrates a consequent behavior with failure description.
LOHF: In Figure 4, there’s a light displacement of the curve of approximately 10 mL to the right, as well as a beat pressure diminution compared to the one shown in Figure 2. This condition indicates that, even though there’s a raise in volume, the heart suffers from a deficiency in the force excelled to pump blood correctly. Can also be observed in the output values of Table 2; this phenomenon in addition to the HB decrease, proves that the simulation has the same general characteristics as the description of the LOHF.
SHF: In the P-V loop curve shown in Figure 5 a significantly increase in volume in the left ventricle can be observed, as well as a decrease in pressure. These characteristics are caused by exhaustion in the heart chamber’s walls, which cause a bigger cavity and lower pressure due to the thinness of the walls [14]. Additionally, some of the characteristic values for this failure are: LVEDV of 192 ± 10 mL, LVESV of 137 ± 9 mL and LVEF of 31 ± 2% [14], in the Table 2, these values are respectively: LVEDV is 180.98 mL, LVESV is 136.54 mL and LVEF is 24.55%. With these values and the characteristics of the P-V loop, there’s enough evidence to that the general behavior of the simulation is similar to the description of SHF.
DHF: In Figure 6, the P-V loop shows a displacement to the left, which traduces to less volume in the ventricle relative to the healthy condition; this movement alongside the decrease pressure in the curve produces a reduction of the CO, as it is shown in the Table 2. As mentioned in Reference [14], this condition is caused by the thickening of the heart walls, which reduces its pumping capacity and its maximum blood volume. In addition, some theoretical range values for the hemodynamic parameters are presented in Reference [14]: LVEDV of 87 ± 10 mL, LVESV of 37 ± 9 mL and LVEF of 60 ± 2%. In the Table 2, these variables have a value of: LVEDV 95.97 mL, LVESV 45.71 mL and LVEF 52.36%; which then again, proves that the simulation for this heart failure is successfully represented.
RVHF: In Figure 7, the decrease in the pumping pressure for the systolic phase, reflects the reduction of the CO shown in Table 2. In addition, this table shows the average reduction of the right ventricle pressure, which is an important characteristic of this type of failure. It should be noted that with the information presented, the damage in the right ventricle also affects the other parts of the heart and the behavior is similar to the description given in Reference [15].
6. Input Parameters
Most heart failures produce damages such as the thickening of heart walls, diminution of the heart chamber’s contraction, reduction of the elastic tissues walls and increments of the heart valve’s resistance. These effects are meaningful in the simulation of heart failures, since those are a starting point in determining the input parameters values.
The modifications for the simulation model variables are shown in Table 3. Among the variables changes, it can be noted that the heart beat adjusts between the failures, as the description suggests. The chamber’s elastance was changed to represent damage or loss of elasticity in the tissues. Moving along these lines, the resistance of the valves and the initial volume were changed to affect the ejection fraction. It should be stressed, that these changes followed the description given before of each condition.
7. Conclusions
The CVST-2 tool, not only provides an adequate simulation of the hemodynamic parameters of a healthy person but it also allows the simulation of the heart conditions due to different failures. Due to the ease of these parameter’s manipulation, we achieved, through simulation, the general behavior of five different heart failures. With this, we can provide a more precise description of the heart’s behavior to study in vitro the effect of adding different devices or components in the cardiovascular system, such as artificial cardiac pacemaker or a ventricular assist device. It should be also noted that this tool provides help for students in the biological area, as they can see and manipulate a heart’s condition in a simulation, instead of having to look for records of previous patients. Which gives this tool a great importance in development of medical devices as well for academic purposes.
Abbreviations
The following abbreviations are used in this manuscript:
| HB | Heart Beat |
| CO | Cardiac Output |
| LVEDV | Left Ventricle End-Diastolic Volume |
| LVESV | Left Ventricle End-Systolic Volume |
| LVSV | Left Ventricle Stroke Volume |
| CVST | Cardiovascular Simulation Toolbox |
| HOHF | High Output Heart Failure |
| LOHF | Low Output Heart Failure |
| SHF | Systolic Heart Failure |
| DHF | Diastolic Heart Failure |
| RVHF | Right Ventricle Heart Failure |
Author Contributions
Conceptualization, G.O.-L. and M.V.-M.; Investigation, G.O.-L., H.J.B.-V. and M.V.-M.; Project administration, G.O.-L. and M.V.-M.; Writing—original draft, M.A.-S. and J.A.P.-C.; Writing—review & editing, H.J.B.-V.
Conflicts of Interest
The authors declare no conflict of interest.
References
- 1.Barnea O. Open-source programming of cardiovascular pressure-flow dynamics using SimPower toolbox in Matlab and Simulink. Open Pacing Electrophysiol. Ther. J. 2010;3:55–59. doi: 10.2174/1876536X01003010055. [DOI] [Google Scholar]
- 2.Ortiz-Leon G., Vilchez-Monge M., Montero-Rodriguez J.J. An updated cardiovascular simulation tool; Proceedings of the 2013 IEEE International Symposium on Circuits and Systems (ISCAS); Beijing, China. 19–23 May 2013; pp. 1901–1904. [Google Scholar]
- 3.Alpert J.S., Ewy G.A. Manual of Cardiovascular Diagnosis and Therapy. Lippincott Williams & Wilkins; Philadelphia, PA, USA: 2002. [Google Scholar]
- 4.Porth C. Essentials of Pathophysiology: Concepts of Altered Health States. Lippincott Williams & Wilkins; Philadelphia, PA, USA: 2011. [Google Scholar]
- 5.Bronzino J. The Biomedical Engineering Handbook. 2nd ed. CRC Press LLC; Danvers, MA, USA: 2000. [Google Scholar]
- 6.Edwards Lifesciences Normal Hemodynamic Parameters and Laboratory Values. [(accessed on 12 March 2014)];2011 :1–2. Available online: Http://ht.edwards.com/sci/edwardssitecollectionimages/edwards/products/presep/ar04313hemodynpocketcard.pdf.
- 7.Umetani K., Singer D.H., McCraty R., Atkinson M. Twenty-four hour time domain heart rate variability and heart rate: Relations to age and gender over nine decades. J. Am. Coll. Cardiol. 1998;31:593–601. doi: 10.1016/S0735-1097(97)00554-8. [DOI] [PubMed] [Google Scholar]
- 8.Schlosser T., Pagonidis K., Herborn C.U., Hunold P., Waltering K.-U., Lauenstein T.C., Barkhausen J. Assessment of left ventricular parameters using 16-MDCT and new software for endocardial and epicardial border delineation. Am. J. Roentgenol. 2005;184:765–773. doi: 10.2214/ajr.184.3.01840765. [DOI] [PubMed] [Google Scholar]
- 9.Keller M., Gopal S., King D.L. Left and right atrial volume by freehand three-dimensional echocardiography: In vivo validation using magnetic resonance imaging. Eur. J. Echocardiogr. J. Work. Group Echocardiogr. Eur. Soc. Cardiol. 2000;1:55–65. doi: 10.1053/euje.2000.0010. [DOI] [PubMed] [Google Scholar]
- 10.Lancashire & South Cumbria Cardiac Network Normal & Abnormal Intracardiac Pressures. [(accessed on 12 March 2014)]; Available online: Http://lane.stanford.edu/portals/cvicu/HCP_CV_Tab_1/Intracardiac_Pressures.pdf.
- 11.Pai R.K. High-Output Heart Failure—Topic Overview. [(accessed on 12 March 2014)]; Available online: https://www.uofmhealth.org/health-library/tx4092abc.
- 12.Hoeper M.M., Granton J. Intensive care unit management of patients with severe pulmonary hypertension and right heart failure. Am. J. Respir. Crit. Med. 2011;184:1114–1124. doi: 10.1164/rccm.201104-0662CI. [DOI] [PubMed] [Google Scholar]
- 13.Lobato E.B., Gravenstein N., Kirby R.R. Complications in anesthesiology. Ethics. 2004;27:391–414. [Google Scholar]
- 14.Chatterjee K., Massie B. Systolic and diastolic heart failure: Differences and similarities. J. Cardiac Failure. 2007;13:569–576. doi: 10.1016/j.cardfail.2007.04.006. [DOI] [PubMed] [Google Scholar]
- 15.Association A.H. Types of Heart Failure. [(accessed on 6 April 2015)]; Available online: https://www.heart.org/en/health-topics/heart-failure/what-is-heart-failure/types-of-heart-failure.
- 16.Nixon J.V., Aurigemma G.P., Bolger A.F., Crawford M.H., Fletcher G.F., Francis G.S., Gerber T.C., Gersony W.M., Ott P., Pape L.A., et al. The AHA Clinical Cardiac Consult. Lippincott Williams & Wilkins; Philadelphia, PA, USA: 2010. [Google Scholar]
- 17.Givertz M., Haghighat A. Causes and pathophysiology of High Output Heart Failure. [(accessed on 5 November 2012)]; Available online: https://www.uptodate.com/contents/causes-and-pathophysiology-of-high-output-heart-failure.


