Abstract
Background
Laparoscopic cholecystectomy (LC) is regarded as the criterion standard for gallstone therapy, but post-cholecystectomy syndrome (PCS) is a common complication. This study aimed to analyze and identify differences in gut microbiome in PCS patients.
Material/Methods
This study involved 8 PCS patients (RS1), 8 asymptomatic PCS patients (RS2), and 8 healthy individuals (RS3). Genomic DNA of gut microbiome was extracted and amplified with CTAB method. PCR products were sequenced with Illumina High-Through Sequencing. Sequencing data were analyzed with QIIME software. Effective sequence of bacterial 16S-rRNA gene was clustered into OTUs using UPARSE software. Species annotations were evaluated using Mothur software. QIIME software was used to conduct complexity analysis and calculate UniFrac distances. R software was used to generate PCoA plots.
Results
Bacterial 16S-rDNA gene sequences showed that the effective species annotative data were more than 97%. According to Ternary plot, Firmicutes and Bacteroidetes had similar abundance and contents among the 3 groups. Contents of Proteobacteria in RS1 were higher compared to RS2 and RS3. Bacterial genomic DNAs samples were clustered together in the same group; however, distances were relative far between different groups. RS1 illustrated significantly higher abundance of Proteobacteria colonies compared to healthy people (p<0.05), and illustrated higher abundance of Verrucomicrobia and lower abundance of Bacteroidetes and Firmicutes, but without significant differences (p>0.05).
Conclusions
Gut microbiome of PCS patients was dominated by Proteobacteria in feces and contained little Firmicutes and Bacteroidetes. The enhanced abundance of Proteobacteria might be the highly pathogenic risk factor for chronic abdominal pain and diarrhea in PCS patients.
MeSH Keywords: Microbiota, Postcholecystectomy Syndrome, Proteobacteria
Background
Gallstone is one the most critical digestive disorders, mainly affecting the gallbladder, and was first reported in the year 1507 [1,2]. The high prevalence of gallstones (ranging from 10% to 20%) in the adult population in developed countries makes it the costliest and the most prevalent gastrointestinal tract diseases in the world [3,4]. Gallstones are also epidemic in developing countries, reaching 10% in China. About 20% to 40% of gallstone patients diagnosed as having asymptomatic cholelithiasis progress to symptoms during the pathological process [5]. The high prevalence and costs of this gastrointestinal tract disease impose a substantial burden on health-care systems in many countries [6].
Gallstones (also referred to as cholecystolithiasis) are mainly composed of some solid mixtures, such as calcium carbonate, palmitate, cholesterol crystals, and glycoproteins [7]. Gallstone pain is characterized by a symptom complex with long duration and is distributes in the upper-right abdominal quadrant [8]. In clinical practice, laparoscopic cholecystectomy (LC) is considered the criterion standard for surgical therapy for gallstone patients, and is performed in more than 90% of such patients in the USA [3]. Although LC treatment is generally effective, a few postoperative complications occur, including post-cholecystectomy syndrome (PCS), which occurs in 10% to 40% of patients within several weeks or months [9]. The etiology of PCS has many pathophysiologies, including the unrelieved original symptoms, new clinical syndrome (non-specific digestive tract symptoms, such as nausea, belching, abdominal distention, diarrhea, and specific biliary symptoms such as typical biliary colic pain in the right-upper abdominal) [10]. Modern medicine recognizes main 2 risk factors for PCS: biliary tract factors (such as residual choledocholithiasis or neo-deposited stones in common bile duct, excessive residual cystic duct, and Oddi sphincter dysfunction) and non-biliary tract factors (such as acute or chronic gastritis, peptic ulcer, and malignant tumors in the gastrointestinal tract) [11,12].
Moreover, some PCS patients do have the symptoms mentioned above, and instead have demonstrate long-term and repeated abdominal distention, diarrhea, and abdominal pain. Therefore, we speculated that the changed gut microbiome and its abnormal metabolic functions might be associated with these kinds of PCS patients, which has not been proved previously. Previous studies [13,14] have found that the bacterial colonies exist in the bilirubinate gallstone, choledocholithiasis. Therefore, the bacteria growth might directly participate in the formation of gallstones. Gallstone composition analysis and analysis of microbial community diversity discovered that there are mainly Enterobacteriaceae, Salmonella, and Paratyphoid salmonella in the stones [13,15].
In this study, we analyzed and identified differences in the main gut microbiome in post-cholecystectomy syndrome patients, asymptomatic post-cholecystectomy syndrome patients, and healthy people, and propose a theoretical basis for clinical prevention and therapy. Our results should help in developing microecological agents for treatment of PCS.
Material and Methods
Subjects and sample collection
This study involved 16 gallstone patients undergoing laparoscopic cholecystectomy (LC) in our hospital from March 2015 to April 2015. The gallstone patients included 8 cases of post-cholecystectomy syndrome patients (RS1 group) and 8 cases of asymptomatic post-cholecystectomy syndrome (RS2 group). Two years after the LC surgery, fresh feces were collected from these patients as the test samples. Healthy individuals attending a regular checkup (RS3 group, n=8) were assigned as the controls and the fresh feces were collected as the test samples. The fresh fecal samples were stored at −80°C for subsequent testing. The basic characteristics assessed are listed in Table 1. The 3 groups were comparable in age and sex data (Table 1, p>0.05).
Table 1.
Comparison for the ages and genders of the post-cholecystectomy syndrome patients (RS1), asymptomatic post-cholecystectomy syndrome patients (RS2) and health people (RS3).
| Characteristics | RS1 | RS2 | RS3 | p |
|---|---|---|---|---|
| Age (years) | 55.25±16.82 | 59.87±9.31 | 50.38±8.62 | 0.194 |
| Gender | 0.454 | |||
| Male | 3 (37.50%) | 5 (62.50%) | 2 (25.00%) | |
| Female | 5 (62.50%) | 3 (37.50%) | 6 (75.00%) |
All subjects provided written informed consent. This study was approved by the Ethics Committee of the Second Affiliated Hospital, Kunming Medical University, Kunming, China.
Inclusive and exclusive criteria
Inclusion criteria for post-cholecystectomy syndrome patients were: 1) aged more than 18 years, 2) underwent LC surgery more than 2 years ago, and 3) diagnosed as having post-cholecystectomy syndrome combined with digestive tract symptoms such as nausea, belching, diarrhea, and abdominal pain.
Exclusion criteria for post-cholecystectomy syndrome patients were: 1) with confirmed biliary tract diseases such as residual choledocholithiasis or neo-deposited stones in common bile duct, excessive residual cystic duct, or Oddi sphincter dysfunction, 2) abdominal pain caused by extrabiliary diseases such as gastroesophageal reflux disease, hiatal hernia of esophagus, peptic ulcer, intrahepatic bile duct stones, chronic pancreatitis, postoperative intestinal adhesion, or chronic mesenteric ischemia, 3) orally administered or intravenously injected with any antibiotics within the past 2 months, 4) orally administered microecological agents or intestinal probiotics within the past 2 months.
The patients who underwent LC surgery more than 2 years before and who did not have any symptoms were included into the asymptomatic post-cholecystectomy syndrome group (RS2 group).
Extraction of genomic DNA of gut microbiome and PCR amplification
The genomic DAN was extracted from the feces samples of RS1, RS2, and RS3 patients by employing the hexadecyltrimethylammonium bromide (CTAB) approach according to the method described in a previous study [16]. Briefly, the higher-quality total microbial DNA was isolated by using the commercial E.Z.N.A Stool DNA kit (Omega Bio-Tek, Inc. (Norcross, GA, USA) according to the instructions of the manufacturer. The PCR assay was used to amplify the V4/V5 regions of 16S ribosomal RNA gene of bacteria by using the primer sequences synthesized by the method described in a previous study [17]. The PCR reaction system was a 20-μl reaction mixture, including template DNA (10 ng), primers (1 μl for both forward and reverse primer), 2.5 mM dNTPs (2 μl), FastPfu buffer (4 μl), and FastPfu polymerase (0.5 μl), supplemented with phosphate-buffered saline (PBS, Beyotime Biotech, Shanghai, China). The PCR amplification was conducted as: 95°C for 2 min for the initial step, followed by 30 cycles at 94°C for 30 s, 50°C for 30 s, and 72°C for 45 s, and terminating the extension at 72°C for 10 min.
Illumina Hiseq sequencing
The amplified PCR products were mixed and purified using a DNA-gel extracting kit (Cat. No. AP-GX-250, Axygen Biosci., Union City, CA, USA) following the instructions of the manufacturer. Then, the gene library was constructed by using the DNA PCR-Free Sample Preparation kit (Cat. No. FC-121-3003, Illumina, San Diego, CA, USA) supplemented with pooled PCR products as the templates. The purified amplified PCR products were pooled with equimolar amounts and sequenced using the Illumina High-Throughput Sequencing platform (Mode: Hiseq2500, Illumina, San Diego, CA, USA).
Analysis of sequencing data using QIIME software
The sequencing data were split and the 250-bp reads and the primer sequences were truncated according to previously described criteria [18]. FLASH software [19] was used to extend the short reads or sequences through discriminating overlaps between the paired-end reads to obtain the original number of total gene sequences (Tags) data. The low-quality sequences and singleton sequences were removed or filtered out using Quantitative Insights Into Microbial Ecology (QIIME) software (version: 1.7.0) [20]. According to the Tags quality control process of QIIME software, the chimeric sequences were identified and removed by blasting the sequences through comparing the UCHIME Algorithm software (http://www.drive5.com/usearch/manual/uchime_algo_html) [21] and Gold database. Eventually, the effective data was obtained.
OTU clustering and species annotation
All of the effective sequences of bacterial 16S-rRNA gene were clustered into operational-taxonomic units (OTUs) with 97% sequence-similarity with the UPARSE software (version: v7.0.1001, http://drive5.com/uparse) [22]. The species annotation, including species diversity, species coverage, species richness, alpha diversity, and rarefaction analysis, was conducted using Mothur software (version: v.1.30.1) [23] and the ssUrRNA of Silva 16S-rRNA database utilizing the confidence threshold ranging from 80% to 100% [24]. The fast multiple-sequence alignment was conducted by using Muscle software (version: 3.8.31, http://www.drive5.com/muscle/).
Complexity analysis of bacterial genomic DNA
The QIIME software (version: 1.7.0) [20] was employed to analyze the OTUs of bacterial genomic DNA and calculate the abundance-based coverage estimator (ACE), Goods-coverage, and PD whole-tree indexes. R software (version: 2.15.3, http://www.R-project.org) was used to draw the dilution curve according to the OTUs of bacterial genomic DNA. Finally, the differentiation analysis among different groups was conducted.
Comparative analysis of various products of bacterial genomic DNA
QIIME software (version: 1.7.0) [20] was utilized to calculate the UniFrac distances, as well as to construct the sample cluster tree by using the unweighted pair-group method with arithmetic mean (UPGMA) method. R software (version: 2.15.3, http://www.R-project.org) was used to generate the principal coordinate analysis (PCoA) plots.
Statistical analysis
Data were analyzed with SPSS20.0 software (SPSS, Inc., Chicago, IL, USA). Continuous variables are represented as mean ± standard deviation (SD) or interquartile range and analyzed using one-way ANOVA for comparisons among multiple groups. Categorical variables are represented as percentage (%) and were analyzed using the chi-square test to compare differences among multiple groups. p<0.05 was set as the level of statistical significant.
Results
Bacterial 16S-rDNA gene sequences were true and reliable
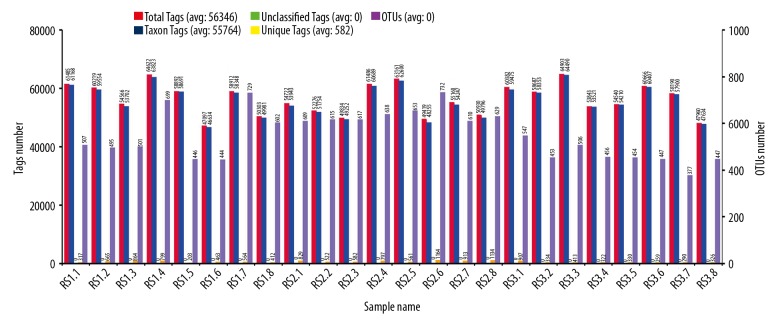
The OTUs clustering and species annotation results of bacterial genomic DNA showed that more than 97% of Tags amounts were qualified for constructing OTUs and obtaining species annotation (also defined as Taxon Tags (blue)/Total Tags(red) ≥97%) (Table 2, Figure 1); therefore, the effective species annotative data are more than 97% and the bacterial 16S-rDNA gene sequences of 24 cases of bacterial genomic DNA samples were true and reliable.
Table 2.
Ratio for the annotation information obtained Taxon Tags comparing with Total Tags.
| Samples | Total Tags | Taxon Tags | Total Tags/Taxon Tags (%) |
|---|---|---|---|
| RS1.1 | 61485 | 61168 | 99.48% |
| RS1.2 | 60219 | 59554 | 98.89% |
| RS1.3 | 54566 | 53702 | 98.41% |
| RS1.4 | 64622 | 63823 | 98.88% |
| RS1.5 | 58892 | 58691 | 99.65% |
| RS1.6 | 47097 | 46634 | 99.02% |
| RS1.7 | 58912 | 58348 | 99.04% |
| RS1.8 | 50303 | 49891 | 99.18% |
| RS2.1 | 54772 | 53943 | 98.49% |
| RS2.2 | 52276 | 51754 | 99.00% |
| RS2.3 | 49834 | 49252 | 98.83% |
| RS2.4 | 61486 | 60689 | 98.70% |
| RS2.5 | 63161 | 62600 | 99.11% |
| RS2.6 | 49419 | 48255 | 97.64% |
| RS2.7 | 55160 | 54247 | 98.34% |
| RS2.8 | 50930 | 49796 | 97.77% |
| RS3.1 | 60382 | 59475 | 98.50% |
| RS3.2 | 58687 | 58353 | 99.43% |
| RS.3.3 | 64903 | 64490 | 99.36% |
| RS3.4 | 53843 | 53521 | 99.39% |
| RS3.5 | 54540 | 54210 | 99.39% |
| RS3.6 | 60666 | 60407 | 99.57% |
| RS3.7 | 58190 | 57900 | 99.50% |
| RS3.8 | 47960 | 47634 | 99.32% |
RS1.1–RS1.8 represented the post-cholecystectomy syndrome patients, RS2.1–RS2.8 represented the asymptomatic post-cholecystectomy syndrome patients, RS3.1–RS3.8 represented the health people. Total Tags – number of total gene sequences, Taxon Tags – number of species annotated gene sequences.
Figure 1.
Statistical chart for the bacterial OTUs clustering and species annotation of 24 fecal samples. RS1.1–RS1.8 represents post-cholecystectomy syndrome patients, RS2.1–RS2.8 represents asymptomatic post-cholecystectomy syndrome patients, and RS3.1–RS3.8 represents healthy people. The horizontal ordinate represents the 24 fecal samples. The first longitudinal ordinate represents the amounts of Tags. Total Tags (red, number of total gene sequences) represent the effective data. Unique Tags are displayed in orange and represent the number of Tags that cannot cluster to OTUs. Taxon Tags (blue, number of species annotated gene sequences) represent the effective data that were successfully obtained from the species annotation information. Unclassified Tags (green tea color) represent the number of Tags that have not obtained species annotation information. The second longitudinal ordinate represents the number of OTUs. OTUs (purple) represent the OTU amounts in each fecal sample, also named as amounts of bacterial species annotation.
Demonstration for relative abundance of species of bacteria in feces samples
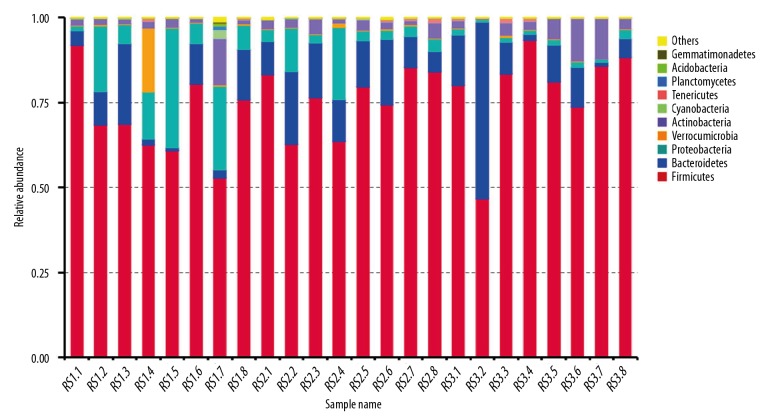
According to the species annotation results from 24 feces samples, the top 10 species annotation data were selected by sequencing the maximum abundance with phylum analysis, and the relative abundance of species cylindrical accumulative graph was synthesized (Figure 2). From the relative abundance of species graph based on the phylum levels, we could easily determine the higher relative abundance of species. The bacteria that dominated the top 10 species annotation data were: Firmicutes, Bacteroidetes, Proteobacteria, Verrucomicrobia, Actinobacteria, Cyanobacteria, Tenericutes, Planctomycetes, Acidobacteria, and Gemmatimonadetes.
Figure 2.
Relative abundance of species in a cylindrical accumulative graph of bacteria in 24 fecal samples. RS1.1–RS1.8 represents post-cholecystectomy syndrome patients, RS2.1–RS2.8 represents asymptomatic post-cholecystectomy syndrome patients, and RS3.1–RS3.8 represents healthy people. The horizontal ordinate represents the 24 fecal samples. The longitudinal ordinate represents the relative abundance of species. Others represent the sum of the relative abundance in the other bacteria except for the above top 10 species.
Differential species analysis of bacteria in feces samples
In this study, the Ternary plot was generated to analyze the differential species based on the top 10 species annotation data (Figure 3). According to the Ternary plot, Firmicutes and Bacteroidetes were located at the middle position, which suggested that these 2 bacteria had the similar abundance and similar contents among the 3 groups (RS1, RS2, and RS3). Meanwhile, the Proteobacteria was relatively close to RS1 and relatively far to RS2 and RS3, which suggested that the contents of Proteobacteria in RS1 were higher compared to that in the RS2 and RS3 groups (Figure 3).
Figure 3.
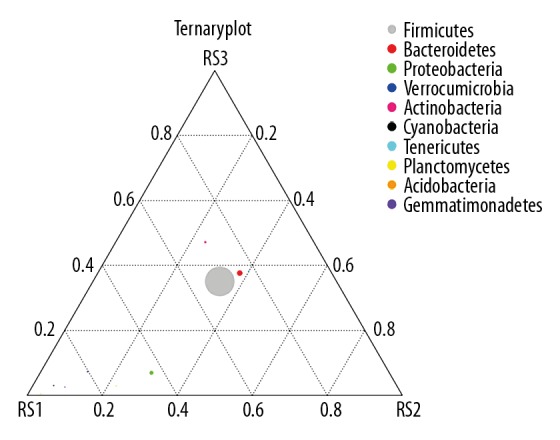
Ternary plot graph illustrating the different bacterial species in fecal samples. RS1 represents post-cholecystectomy syndrome patients, RS2 represents asymptomatic post-cholecystectomy syndrome patients, and RS3 represents healthy people. The 3 vertexes of the triangle graph represent samples of RS1, RS2, and RS3, respectively. One pie chart (small or large with different colors) represents a bacterium, the size of which represents the relative abundance of species. The distance between the vertex and pie chart represented the content ratio of this bacteria in this group (RS1, RS2 or RS3).
PCoA analysis of bacterial genomic DNA in feces samples
PCoA mainly extracts the most important elements and structures from the multidimensional data through a series of typical values and characteristic vector sorting. The PCoA results showed that the bacterial genomic DNAs samples were clustered together in the same group; however, the distances were relatively far between different groups (Figure 4).
Figure 4.
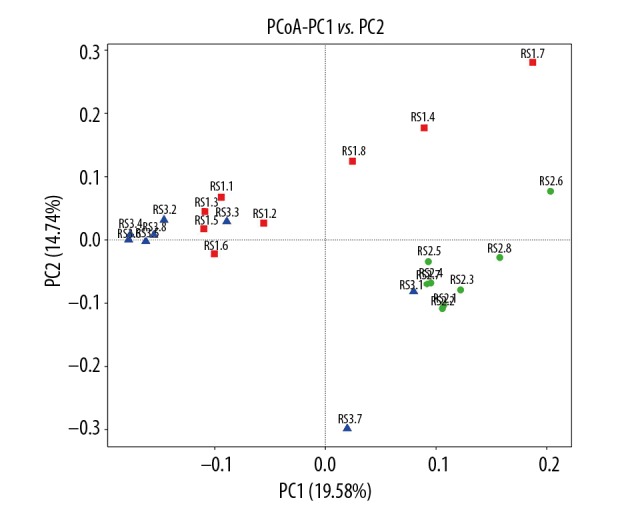
PCoA analysis based on the weighted UniFrac distance of bacterial genomic DNA in fecal samples. RS1 represents post-cholecystectomy syndrome patients, RS2 represents asymptomatic post-cholecystectomy syndrome patients, and RS3 represents healthy people.
Cluster tree construction using UPGMA of bacterial genomic DNA in feces samples
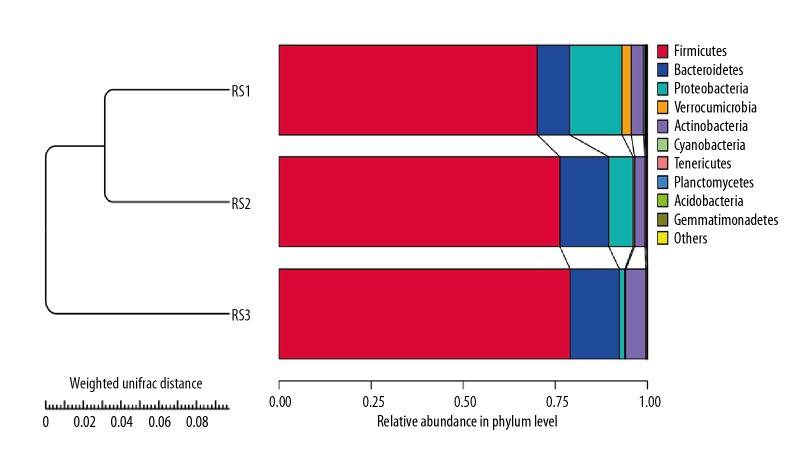
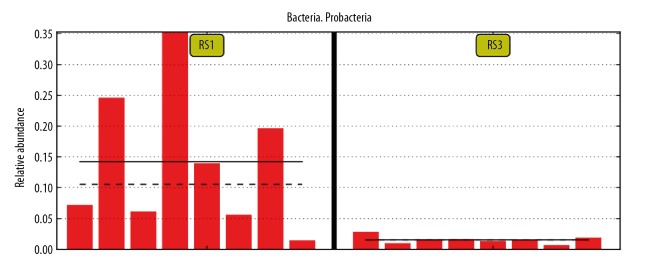
In order to study the similarity among different bacterial genomic DNA in feces samples, UPGMA was used to conduct clustering analysis. The clustering data of bacterial genomic DNA in 24 feces samples and the relative abundance in phylum levels are demonstrated in Figure 5. Comparing with the healthy people (RS3 group), there were significant differences in post-cholecystectomy syndrome patients (RS1 group), including higher abundance of Proteobacteria and Verrucomicrobia and lower abundance of Bacteroidetes and Firmicutes. The statistical analysis also indicated that compared with healthy people (RS3 group), the post-cholecystectomy syndrome patients (RS1 group) had higher abundance of Verrucomicrobia and lower abundance of Bacteroidetes and Firmicutes; however, there were no significant differences between the RS1 group and RS3 group (p>0.05). Furthermore, there were significant differences for the Proteobacteria colonies between the RS1 and RS3 group (Table 3, Figure 6, p=0.01).
Figure 5.
Construction of cluster tree using UPGMA of bacterial genomic DNA in fecal samples of 3 groups. RS1 represents post-cholecystectomy syndrome patients, RS2 represents asymptomatic post-cholecystectomy syndrome patients, and RS3 represents healthy people.
Table 3.
Differential comparison for the microbial colonies for the post-cholecystectomy syndrome patients (RS1), asymptomatic post-cholecystectomy syndrome patients (RS2) and health people (RS3).
| Microbial colonies | Comparison | p |
|---|---|---|
| Verrucomicrobia | RS1: RS3 | 0.4246 |
| Bacteroidetes | RS1: RS3 | 0.6773 |
| Firmicutes | RS1: RS3 | 0.3207 |
| Proteobacteria | RS1: RS3 | 0.01 |
| Verrucomicrobia | RS1: RS2 | 0.4749 |
| Bacteroidetes | RS1: RS2 | 0.6702 |
| Firmicutes | RS1: RS2 | 0.5847 |
| Proteobacteria | RS1: RS2 | 0.1498 |
Figure 6.
Differential comparison of Proteobacteria between post-cholecystectomy syndrome patients (RS1 group) and healthy people (RS3 group). RS1 represents post-cholecystectomy syndrome patients, and RS3 represents healthy people. The longitudinal ordinate represents the relative abundance of bacterial species. Each red band represents one sample.
Compared with asymptomatic post-cholecystectomy syndrome patients, there were Verrucomicrobia, Bacteroidetes, Firmicutes, and Proteobacteria in post-cholecystectomy syndrome patients, and there were no significant differences between the 2 groups (Table 3, p>0.05).
Discussion
In the present study, the bacterial genomic DNA was amplified and determined by using the 16S-rDNA gene amplification approach, which usually exhibits higher bacterial detection rates [25]. The distinguished bacteria could be classified and identified by sequencing the variable regions and constant regions of 16S-rDNA and BLAST with the established microbial gene library [26]. Our results showed that compared with healthy people (RS3 group) and asymptomatic post-cholecystectomy syndrome patients (RS2 group), the post-cholecystectomy syndrome patients (RS1 group) demonstrated obvious differences in relative abundance of bacterial species in feces samples (including Firmicutes, Bacteroidetes, Proteobacteria, Verrucomicrobia, Actinobacteria, Cyanobacteria, Tenericutes, Planctomycetes, Acidobacteria, and Gemmatimonadetes). Among these bacterial species, the Proteobacteria had the highest degree of enhancement. Therefore, compared to traditional bacterial culture methods, the 16S-rDNA PCR amplification technology exhibited a few remarkable merits in screening and identifying bacteria, including explicit and existent bacterial colonies, relatively higher abundance, undifferentiated bacterial colony growth, and higher efficacy [27].
Post-cholecystectomy syndrome has many causes, including biliary tract diseases, primary diseases outside biliary tract (gastroesophageal reflux disease, duodenogastric reflux, acute or chronic gastritis, gastrointestinal ulcer), and abnormal metabolism of intestinal microorganisms (patients with abdominal distention and diarrhea, but without obvious anatomical abnormalities and primary diseases outside biliary tract) [28,29]. Therefore, it may be helpful to investigate and compare the gut microbiome and its abnormal metabolic functions between the people with post-cholecystectomy syndrome and healthy people to discover the etiological factors and provide novel insights or therapeutic approaches for post-cholecystectomy syndrome.
In this study, fresh feces were collected from 8 post-cholecystectomy syndrome patients and 8 asymptomatic post-cholecystectomy syndrome patients at 2 years after the LC surgery. Because the contents of bacterial colonies in feces are influenced by many risk factors [30], these 16 patients were not orally administrated or intravenously injected with any antibiotics, microecological agents, or intestinal probiotics within the last 2 months. However, the dietary ingredients of the patients and living environments in the past 2 year of cholecystectomy could not be evaluated due to lack of consistency. Therefore, there might be serious deviation for the bacterial colonies in the involved feces samples, and enhancing the consistency would be better for the true findings.
According to the relative abundance data, the gut microbiome in the feces of post-cholecystectomy syndrome patients was dominated by Proteobacteria, and the healthy people were dominated by Firmicutes. A few post-cholecystectomy syndrome patients lacked clear causes of symptoms of long-term abdominal pain and diarrhea, which are different with the pains caused by biliary or extrabiliary factors. Therefore, we speculated that the long-term abdominal pain and diarrhea might caused by the changes of gut microbiome, especially for Proteobacteria. Previous studies [31] also reported that Proteobacteria multiply at the body surface and in vivo, inducing chronic abdominal pain/diarrhea and a series of inflammations, which is consistent with our results. Therefore, the abdominal pain and diarrhea in the post-cholecystectomy syndrome patients could be relieved by using anti-Proteobacteria drugs or regents. Moreover, we also discovered a novel hypothesis that the cholecystectomy causes gallbladder dysfunction, which induces continuous excretion of small amounts of bile, which damages the microecological environments of the gut microbiome and thus reduces the abundance of beneficial Bacteroidetes and Firmicutes in the gut. However, the abundance of the pathological Proteobacteria in the gut is significantly enhanced, which damages the normal intestinal digestive functions.
For the clinical application and therapy of post-cholecystectomy syndrome patients, the patients with chronic abdominal pain and diarrhea could be treated with intestinal probiotics and intestinal microecological agents, both of which could enhance the contents of Bacteroidetes and Firmicutes, adjust the balance of gut microbiome, inhibit growth of opportunistic pathogens, and promote intestinal microecological balance.
There were significantly different gut microbiomes in the feces of post-cholecystectomy syndrome patients and healthy people, but we cannot confirm the correlation between changes of gut microbiome and the periods after cholecystectomy. In future research we hope to clarify the correlations at 3 months, 1 year, and 5 years in post-cholecystectomy syndrome between post-cholecystectomy syndrome patients and healthy people.
Conclusions
The present study evaluated the gut bacterial colonies contents and distributions in post-cholecystectomy syndrome patients, asymptomatic post-cholecystectomy syndrome patients, and healthy people, by using 16S-rDAN amplification and sequencing strategy. We found that compared with the healthy group, the gut microbiome was dominated by Proteobacteria in feces of post-cholecystectomy syndrome patients, with little Firmicutes and Bacteroidetes. The higher abundance of Proteobacteria might be a highly pathogenic risk factor for chronic abdominal pain and diarrhea in post-cholecystectomy syndrome patients.
Footnotes
Source of support: The study wad funded by Hundreds of Young and Middle-Aged Academic and Technical Backbone Projects in Kunming Medical University (Grant No. 60117190431)
Conflict of interest
None.
References
- 1.Sahiner IT, Kendirci M. Retrospective clinical study of the effects of T-tube placement for bile duct stricture. Med Sci Monit. 2017;23:4328–33. doi: 10.12659/MSM.906630. [DOI] [PMC free article] [PubMed] [Google Scholar]
- 2.Shehadi WH. The biliary system through the ages. Int Surg. 1979;64:63–78. [PubMed] [Google Scholar]
- 3.Nagorni EA, Kouklakis G, Tsaroucha A, et al. Post-laparoscopic cholecystectomy Mirizzi syndrome induced by polymeric surgical clips: A case report and review of the literature. J Med Case Rep. 2016;10:135. doi: 10.1186/s13256-016-0932-5. [DOI] [PMC free article] [PubMed] [Google Scholar]
- 4.Acalovschi M. Gallstones in patients with liver cirrhosis: Incidence, etiology, clinical and therapeutical aspects. World J Gastroenterol. 2014;20:7277–85. doi: 10.3748/wjg.v20.i23.7277. [DOI] [PMC free article] [PubMed] [Google Scholar]
- 5.Minutolo V, Licciardello A, Arena M, et al. Laparoscopic cholecystectomy in the treatment of acute cholecystitis: Comparison of outcomes and costs between early and delayed cholecystectomy. Eur Rev Med Pharmacol Sci. 2014;18:40–46. [PubMed] [Google Scholar]
- 6.Li QF, Xu X, Ge X. Gallstones recurrence after minimally-invasive cholecystolithotomy with gallbladder reservation: A follow up of 720 cases. Eur Rev Med Pharmacol Sci. 2015;19:1403–6. [PubMed] [Google Scholar]
- 7.Li X, Guo X, Ji H, et al. Gallstones in patients with chronic liver diseases. Biomed Res Int. 2017;2017 doi: 10.1155/2017/9749802. 9749802. [DOI] [PMC free article] [PubMed] [Google Scholar]
- 8.Guerra F, Balestra F, Sacchetti R, et al. An unsuspected cause of abdominal pain and fever: Lost gallstone-related perisplenic abscess. J Dig Dis. 2016;17:554–56. doi: 10.1111/1751-2980.12366. [DOI] [PubMed] [Google Scholar]
- 9.Jaunoo SS, Mohandas S, Almond L. Postcholecystectomy syndrome (PCS) Int J Surg. 2010;8:15–17. doi: 10.1016/j.ijsu.2009.10.008. [DOI] [PubMed] [Google Scholar]
- 10.Lim MS, Jeon JY, Kwon, et al. Laparoscopic treatment for post-cholecystectomy Mirizzi syndrome. Korean J Heapatobiliary Pancreat Surg. 2013;17:79–82. doi: 10.14701/kjhbps.2013.17.2.79. [DOI] [PMC free article] [PubMed] [Google Scholar]
- 11.Judd S, Miller L, Antaki F. Symptomatic calculi in a remnant gallbladder: A rare cause of post-cholecystectomy syndrome and biliary pancreatitis. Endoscopy. 2014;46(Suppl 1):E67–68. doi: 10.1055/s-0033-1359193. [DOI] [PubMed] [Google Scholar]
- 12.Tarnasky PR. Post-cholecystectomy syndrome and sphincter of Oddi dysfunction: Past, present and future. Expert Rev Gastroenterol Hepatol. 2016;10:1359–72. doi: 10.1080/17474124.2016.1251308. [DOI] [PubMed] [Google Scholar]
- 13.Peng Y, Yang Y, Liu Y, et al. Cholesterol gallstones and bile host diverse bacterial communities with potential to promote the formation of gallstones. Microb Pathog. 2015;83–84:57–63. doi: 10.1016/j.micpath.2015.05.002. [DOI] [PubMed] [Google Scholar]
- 14.Maki T. Pathogenesis of calcium bilirubinate gallstone: Role of E. coli, beta-glucuronidase and coagulation by inorganic ions, polyelectrolytes and agitation. Ann Surg. 1966;164:90–100. doi: 10.1097/00000658-196607000-00010. [DOI] [PMC free article] [PubMed] [Google Scholar]
- 15.Wu T, Zhang Z, Liu B, et al. Gut microbiota dysbiosis and bacterial community assembly associated with cholesterol gallstones in large-scale study. BMC Genomics. 2013;14:669. doi: 10.1186/1471-2164-14-669. [DOI] [PMC free article] [PubMed] [Google Scholar]
- 16.Arseneau JR, Steeves R, Laflamme M. Modified low-salt CTAB extraction of high-quality DNA from contaminant-rich tissues. Mol Ecol Resour. 2017;17:686–93. doi: 10.1111/1755-0998.12616. [DOI] [PubMed] [Google Scholar]
- 17.Zhou J, Wu L, Deng Y, et al. Reproducibility and quantitation of amplicon sequencing-based detection. ISME J. 2011;5:1303–13. doi: 10.1038/ismej.2011.11. [DOI] [PMC free article] [PubMed] [Google Scholar]
- 18.Wang Q, Jiao L, He C, et al. Alteration of gut microbiota in association with cholesterol gallstone formation in mice. BMC Gastroenterol. 2017;17:74. doi: 10.1186/s12876-017-0629-2. [DOI] [PMC free article] [PubMed] [Google Scholar]
- 19.Magoc T, Salzberg SL. FLASH: Fast length adjustment of short reads to improve genome assemblies. Bioinformatics. 2011;27:2957–63. doi: 10.1093/bioinformatics/btr507. [DOI] [PMC free article] [PubMed] [Google Scholar]
- 20.Caporaso JG, Kuczynski J, Stombaugh J, et al. QIIME allows analysis of high-throughput community sequencing data. Nat Methods. 2010;7:335–36. doi: 10.1038/nmeth.f.303. [DOI] [PMC free article] [PubMed] [Google Scholar]
- 21.Edgar RC, Haas RJ, Clemente JC, et al. UCHIME improves sensitivity and speed of chimera detection. Bioinformatics. 2011;27:2194–200. doi: 10.1093/bioinformatics/btr381. [DOI] [PMC free article] [PubMed] [Google Scholar]
- 22.Edaac RC. UPARSE: Highly accurate OTU sequences from microbial amplicon reads. Nat Methods. 2013;10:996–98. doi: 10.1038/nmeth.2604. [DOI] [PubMed] [Google Scholar]
- 23.Schloss PD, Westcott SL, Ryabin T, et al. Introducing Mothur: Open-source, platform-independent, community-supported software for describing and comparing microbial communities. Appl Environ Microbiol. 2009;75:7537–41. doi: 10.1128/AEM.01541-09. [DOI] [PMC free article] [PubMed] [Google Scholar]
- 24.Quast C, Pruesse E, Yilmaz P, et al. The SILVA ribosomal RNA gene database project: Improved data processing and web-based tools. Nucleic Acids Res. 2013;41:D590–96. doi: 10.1093/nar/gks1219. [DOI] [PMC free article] [PubMed] [Google Scholar]
- 25.Woo PC, Lau SK, Teng JL, et al. Then and now: Use of 15S rDNA gene sequencing for bacterial identification and discovery of novel bacteria in clinical microbiology laboratories. Clin Microbiol Infect. 2008;14:908–34. doi: 10.1111/j.1469-0691.2008.02070.x. [DOI] [PubMed] [Google Scholar]
- 26.Hellberg RS, Haney CJ, Shen Y, et al. Development of a custom 16S rRNA gene library for the identification and molecular subtyping of salmonella enterica. J Microbiol Methods. 2012;91:448–58. doi: 10.1016/j.mimet.2012.09.018. [DOI] [PubMed] [Google Scholar]
- 27.Tian Y, Li YH. Comparative analysis of bacteria associated with different by 16S rRNA and 16S rDNA sequencing. J Basic Microbiol. 2017;57:57–67. doi: 10.1002/jobm.201600358. [DOI] [PubMed] [Google Scholar]
- 28.Moore T, Amin A. Post-cholecystectomy syndrome. Clin Pract Cases Emerg Med. 2017;1:446–47. doi: 10.5811/cpcem.2017.6.33321. [DOI] [PMC free article] [PubMed] [Google Scholar]
- 29.Arora D, Kaushik R, Kaur R, et al. Post-cholecystectomy syndrome: A new look at an old problem. J Minim Access Surg. 2018;14:202–7. doi: 10.4103/jmas.JMAS_92_17. [DOI] [PMC free article] [PubMed] [Google Scholar]
- 30.Han H, Ogata Y, Yamamoto Y, et al. Identification of lactic acid bacteria in the rumen and feces of dairy cows fed total mixed ration silage to assess the survival of silage bacteria in the gut. J Dairy Sci. 2014;97:5754–62. doi: 10.3168/jds.2014-7968. [DOI] [PubMed] [Google Scholar]
- 31.Valentin N, Camilleri M, Carlson P, et al. Potential mechanisms of effects of serum-derived bovine immunoglobulin/protein isolate therapy in patients with diarrhea-predominant irritable syndrome. Physiol Rep. 2017;5:e13170. doi: 10.14814/phy2.13170. [DOI] [PMC free article] [PubMed] [Google Scholar]


