Supplemental Digital Content is available in the text.
Keywords: Instrumental variable; Mendelian randomization; Selection bias, Simulation; Survival bias
Abstract
It has been argued that survival bias may distort results in Mendelian randomization studies in older populations. Through simulations of a simple causal structure we investigate the degree to which instrumental variable (IV)-estimators may become biased in the context of exposures that affect survival. We observed that selecting on survival decreased instrument strength and, for exposures with directionally concordant effects on survival (and outcome), introduced downward bias of the IV-estimator when the exposures reduced the probability of survival till study inclusion. Higher ages at study inclusion generally increased this bias, particularly when the true causal effect was not equal to null. Moreover, the bias in the estimated exposure-outcome relation depended on whether the estimation was conducted in the one- or two-sample setting. Finally, we briefly discuss which statistical approaches might help to alleviate this and other types of selection bias. See video abstract at, http://links.lww.com/EDE/B589.
It has been argued that, in Mendelian randomization studies in older populations, survival bias may distort results, as these populations necessarily consist of the nonrandom subset of the population who have survived long enough to be included.1,2 We aimed to investigate the impact of survival bias on Mendelian randomization analyses with a continuous outcome through a simulation study. In particular, we will examine whether instrumental variable (IV) estimators become biased within aging populations, for one- or two-sample Mendelian randomization settings. We will also discuss which statistical approaches may help to minimize or address this bias.
METHODS
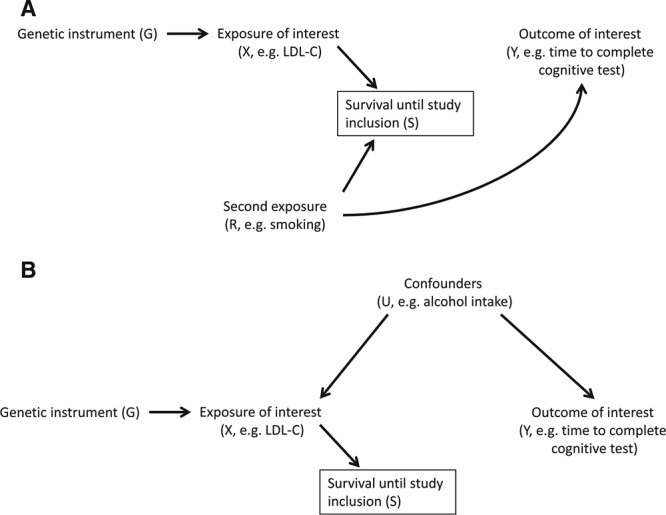
Suppose we are interested in estimating the causal effect of X (e.g., cholesterol) on an outcome Y (e.g., cognitive test performance) in older individuals (Figure 1), where survival until study inclusion (S) is influenced by the exposure of interest X. If there is a second, uncorrelated exposure R (e.g., smoking) (Figure 1A) that also affects S, conditioning on survival (S = 1) will induce an association between X and R, and therefore also between G and R. We therefore expect that the previously uncorrelated variables will become associated, as an indirect path from G to Y going through R is opened.
FIGURE 1.

For two exposures increasing the risk of death, conditioning on survival (S) may induce an association between the previously uncorrelated risk factors X (and its genetic proxy G) and R (panel A). Additionally, conditioning on survival may induce an association between the genetic instrument G and any confounders U of the X–Y association (panel B), even in the absence of risk factor R.
In addition, conditioning on S implies partial conditioning on X. Therefore, if confounders U (e.g., alcohol intake) of the X–Y association were to exist, G and U may become correlated (Figure 1B).
Data Generation
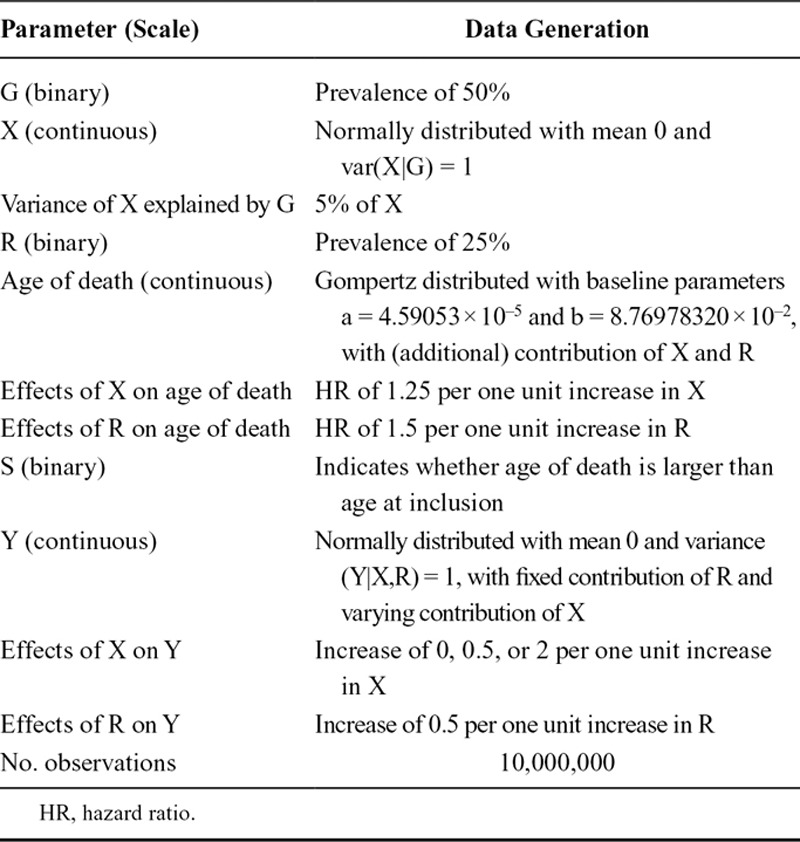
All simulation scenarios assume the basic causal structure shown in Figure 1A. The causal associations are chosen such that an increase in cause will lead to an increase in the consequence, except for the effect on survival where higher values in exposures correspond to lower survival times. In our simulations, we used linear models to generate the exposure and outcome. We assumed a homogeneous treatment effect, meaning that there was no additive effect modification by the confounder, the instrument, and the other exposure. For each scenario we generated a dataset of 10 million observations with multiple randomly generated variables: a binary genetic instrument (G), a continuous exposure (X) influenced by G, a binary exposure (R), a continuous outcome (Y) influenced by R and variably influenced by X, and finally an age of death influenced by both X and R. In secondary analyses, we added a continuous confounder (U) with equal effects on X and Y. We also repeated the simulations for a normally distributed R, and when interaction exists between X and R on age of death.3 Details of data generation and parameters values are presented in the Table, and results of the secondary analyses are presented in eAppendix 1; http://links.lww.com/EDE/B568.
TABLE.
Parameters Values and Details of Data Generation

To generate survival time we used the 2016 mortality data of the United States from the Human Mortality Database.4 Using the MortalityLaws R-package we estimated the parameters of the Gompertz model (eFigure 1; http://links.lww.com/EDE/B568), which were subsequently used to generate survival times for our simulated population. Effects of both X and R on age of death were modeled as hazard ratios, with having higher levels of X and/or R translating into an earlier death (on average). Subsequently, we considered different age boundaries for study inclusion, from 75 to 95 years, thereby steadily decreasing the number of surviving participants (S = 1). We used R (version 3.4.1) for all data generation and analyses. Annotated code is provided as eAppendix 2; http://links.lww.com/EDE/B569.
Effects on Instrumental Variable Estimators
Increasingly, summarized data (coefficients and standard errors) from large genome-wide association study consortia are made publicly available, which enables researchers to perform two-sample Mendelian randomization even if their own study does not allow for estimation of both coefficients necessary to calculate the Wald ratio.5 These external datasets are generally more likely to have primarily included middle-aged participants,6,7 and thus less likely to be affected by survival bias. Therefore, under the assumption of no age-related effect modification, we not only considered the scenario where both coefficients are estimated in the same increasingly selected dataset (i.e., “internal” estimation), but also what happens if the association measure between G and X is taken from an external dataset not selected on survival (i.e., “external” estimation, by taking the fixed value of our total population). We assumed different true effects of X on Y (Table). We calculated confidence intervals for the internally estimated Wald ratio using the SEM R-package.
RESULTS
For our instrument, which explained 5% of variance in the exposure in the unselected (i.e., entire) sample, the R2 declined from 4.9% at 75 years to 4.5% at 95 years. The prevalence of G declined from 0.49 at age 75 years to 0.46 at age 95. Furthermore, of the population alive at 75 years, 15.6% were still alive at 95 years.
Bias to Instrumental Variable Estimator
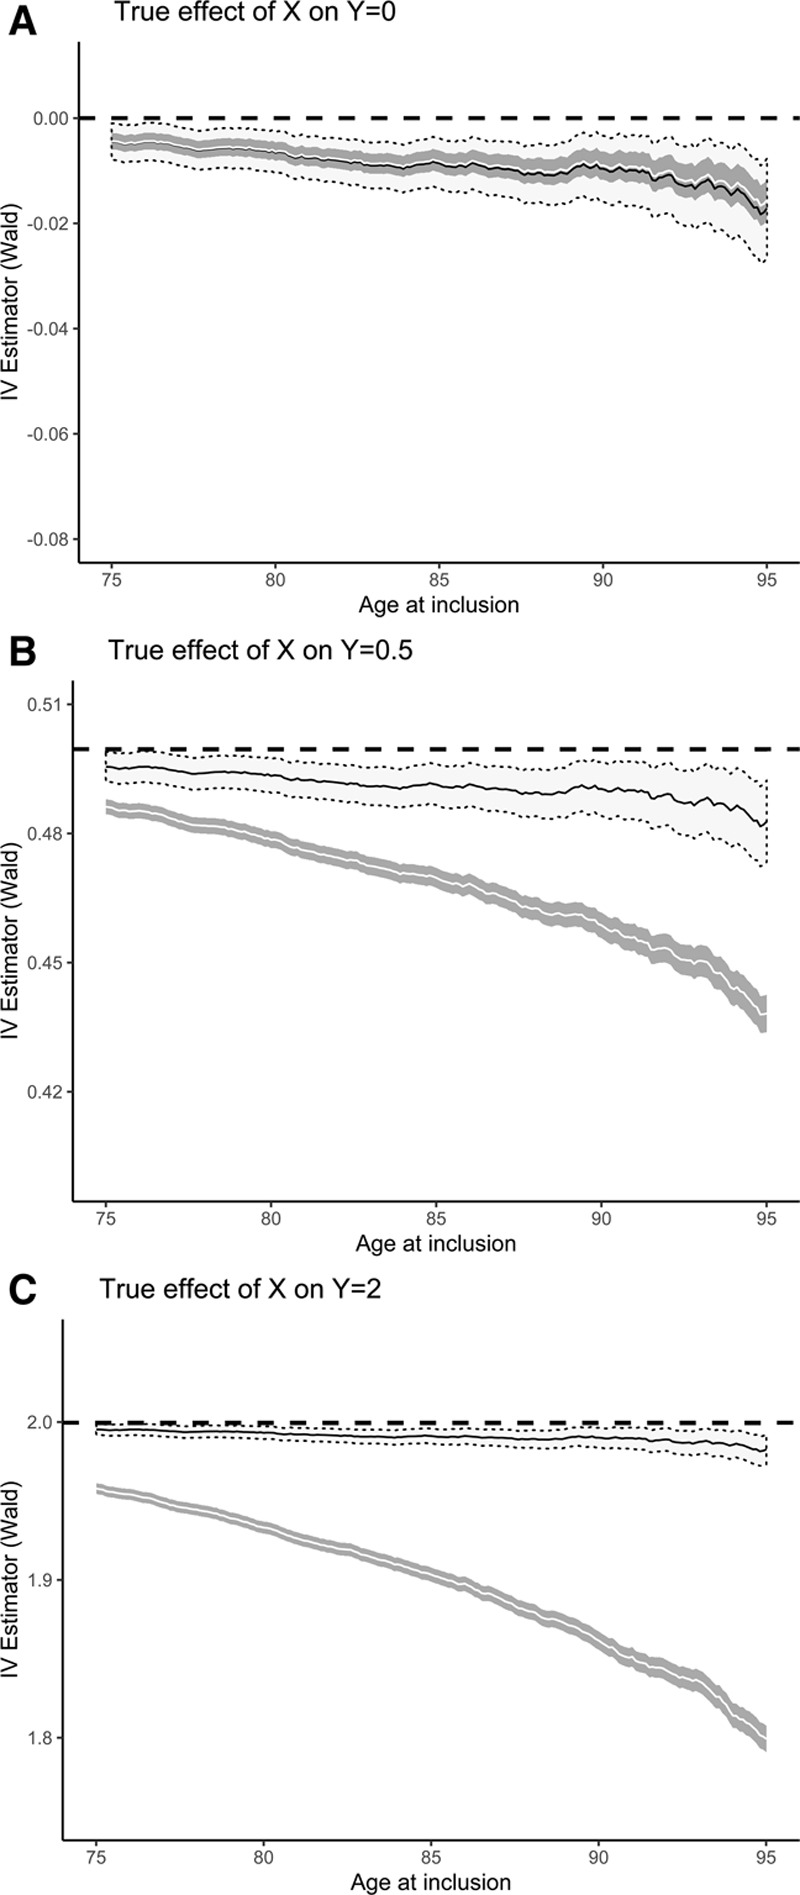
The bias in the IV-estimator depended on (a) whether the association between G and X is estimated within the same selected dataset as the association between G and Y was, or within an external source not selected on age and (2) whether the true effect of X on Y is null or not (Figure 2). In general, selecting higher ages at study inclusion increased the amount of bias. In cases where the true effect >0, a clear downward bias was seen, underestimating the true effect. Where the true effect of X on Y was null, the resulting association became nominally negative (Figure 2A).
FIGURE 2.

Estimating the causal effect of X on Y. Wald ratios (95% CI) based on internally (white ribbon) versus externally (gray ribbon) estimated X–Y association, for different true effects of exposure X on outcome Y. Dashed lines denote the true (i.e., unselected) Wald ratio, which equals the true causal effect of X on Y. CI, confidence interval.
When both the numerator (Y ~ G) and denominator (X ~ G) of the Wald ratio are estimated in the same selected dataset, we observed that they were similarly biased. Taking the ratio, therefore seemingly cancels out much of the bias, compared to the situation where only the numerator is estimated in the selected population. In this latter situation, the relative degree of the bias equals that seen for the association measure between G and Y (eFigures 2–3; http://links.lww.com/EDE/B568). The two IV-estimators diverge more strongly as the true effect of X on Y is stronger.
Secondary Analyses
Simulation results for the causal structure depicted under Figure 1B, and for the combination of Figure 1A and B, did not show markedly different results (eFigures 4–6; http://links.lww.com/EDE/B568). For the normally distributed R, we observed similar results, though selection bias partially persisted for the internally estimated IV-estimator (eFigure 3; http://links.lww.com/EDE/B568). Positive interaction between X and R on age of death increased the amount of downward bias. In contrast, sufficiently strong negative interaction led to upward bias (eFigure 7; http://links.lww.com/EDE/B568).
DISCUSSION
We observed that, for selection-related exposures with directionally concordant effects on survival (and outcome), the IV-estimator based on a genetic proxy of that exposure became downwardly biased. In addition, we observed that when selection increased the instrument strength decreased, as measured by R2.
While our simulations specifically examined age-related selection, researchers with data on populations selected on alternative characteristics (e.g., disease status) will similarly have to consider the possible influence of selection bias in genetic analyses.8–10 Alternative causal structures that might give rise to selection bias in Mendelian randomization studies have been presented elsewhere.11
Recent work by Canan et al.2 suggests that, for the causal structure under investigation in our simulations, selection bias may be corrected via inverse probability weighting. In general, we expect that if the selection gradient solely depends on measured variables which are available for the entire original study population (i.e., also for those individuals who are not selected in the study sample), and assuming a constant treatment effect, both inverse probability weighting and multiple imputation could be suitable solutions for selection bias. If data are only available for the selected individuals, but a sufficient set of selection-related variables are precisely measured, then inclusion of these selection-related variables in multivariable regression models may resolve the bias if the models are well-specified. The value of representative cohorts with little selection (e.g., birth cohorts) cannot be overstated in this context,11,12 though genotyping genetically informative family members may hold promise as well.13 Alternative strategies have been proposed in the context of hazard models,14–16 which may fare better when selection depends on (partially) unobserved variables. In addition, methods of using covariate balance to detect dependent censoring in longitudinal studies exist, though these approaches have not been extended to IV-analysis where bias amplification may occur.17,18
In our simulations, we assumed that survival bias would similarly affect different components of the causal structure (e.g., both the numerator and denominator of the Wald ratio). In addition, we solely considered one commonly occurring genetic instrument and uncorrelated exposures with directionally concordant effects on survival (and the outcome of interest), though R could be considered a combined vector for many possible competing causes of death. Furthermore, we did not consider a binary outcome, to avoid the issue of non-collapsibility, and restricted our investigations to a linear instrument-exposure association.
It will be of interest to examine more detailed simulations using greater numbers of instruments and exposures to derive bias formulas (as others have done for collider bias in binary variable structures19). Of particular interest would be to examine whether sets of polygenic instruments, whose individual metabolic pathways to the intermediate phenotype may differ, might be differentially affected by survival bias. Finally, future work should explore the implications of using different IV assumptions such as monotonicity.
Supplementary Material
Footnotes
The authors report no conflicts of interest.
Supplemental digital content is available through direct URL citations in the HTML and PDF versions of this article (www.epidem.com).
Computing code availability: Annotated code uploaded as supplemental material.
REFERENCES
- 1.Boef AG, le Cessie S, Dekkers OM. Mendelian randomization studies in the elderly. Epidemiology. 2015;26:e15–e16. [DOI] [PubMed] [Google Scholar]
- 2.Canan C, Lesko C, Lau B. Instrumental variable analyses and selection bias. Epidemiology. 2017;28:396–398. [DOI] [PMC free article] [PubMed] [Google Scholar]
- 3.Hernán MA, Hernández-Díaz S, Robins JM. A structural approach to selection bias. Epidemiology. 2004;15:615–625. [DOI] [PubMed] [Google Scholar]
- 4.University of California, Berkeley (USA), and Max Planck Institute for Demographic Research (Germany). Human Mortality Database. Available at: www.mortality.org or www.humanmortality.de. Accessed July 30 2018.
- 5.Burgess S, Butterworth A, Thompson SG. Mendelian randomization analysis with multiple genetic variants using summarized data. Genet Epidemiol. 2013;37:658–665. [DOI] [PMC free article] [PubMed] [Google Scholar]
- 6.Locke AE, Kahali B, Berndt SI, et al. ; LifeLines Cohort Study; ADIPOGen Consortium; AGEN-BMI Working Group; CARDIOGRAMplusC4D Consortium; CKDGen Consortium; GLGC; ICBP; MAGIC Investigators; MuTHER Consortium; MIGen Consortium; PAGE Consortium; ReproGen Consortium; GENIE Consortium; International Endogene Consortium. Genetic studies of body mass index yield new insights for obesity biology. Nature. 2015;518:197–206. [DOI] [PMC free article] [PubMed] [Google Scholar]
- 7.Willer CJ, Schmidt EM, Sengupta S, et al. ; Global Lipids Genetics Consortium. Discovery and refinement of loci associated with lipid levels. Nat Genet. 2013;45:1274–1283. [DOI] [PMC free article] [PubMed] [Google Scholar]
- 8.Yaghootkar H, Bancks MP, Jones SE, et al. Quantifying the extent to which index event biases influence large genetic association studies. Hum Mol Genet. 2017;26:1018–1030. [DOI] [PMC free article] [PubMed] [Google Scholar]
- 9.Anderson CD, Nalls MA, Biffi A, et al. The effect of survival bias on case-control genetic association studies of highly lethal diseases. Circ Cardiovasc Genet. 2011;4:188–196. [DOI] [PMC free article] [PubMed] [Google Scholar]
- 10.Hu YJ, Schmidt AF, Dudbridge F, et al. Impact of selection bias on estimation of subsequent event risk. Circ Cardiovasc Genet. 2017;10:e001616. [DOI] [PMC free article] [PubMed] [Google Scholar]
- 11.Munafò MR, Tilling K, Taylor AE, et al. Collider scope: when selection bias can substantially influence observed associations. Int J Epidemiol. 2018;47:226–235. [DOI] [PMC free article] [PubMed] [Google Scholar]
- 12.Domingue BW, Belsky DW, Harrati A, et al. Mortality selection in a genetic sample and implications for association studies. Int J Epidemiol. 2017;46:1285–1294. [DOI] [PMC free article] [PubMed] [Google Scholar]
- 13.Chen L, Weinberg CR, Chen J. Using family members to augment genetic case-control studies of a life-threatening disease. Stat Med. 2016;35:2815–2830. [DOI] [PMC free article] [PubMed] [Google Scholar]
- 14.Vansteelandt S, Dukes O, Martinussen T. Survivor bias in mendelian randomization analysis. Biostatistics. 2018;19:426–443. [DOI] [PubMed] [Google Scholar]
- 15.Stensrud MJ. Interpreting Hazard Ratios: Insights from Frailty Models. arXiv:1701.06014 [stat.ME] 2018.
- 16.Carlin CS, Solid CA. An approach to addressing selection bias in survival analysis. Stat Med. 2014;33:4073–4086. [DOI] [PMC free article] [PubMed] [Google Scholar]
- 17.Zubizarreta JR. Stable weights that balance covariates for estimation with incomplete outcome data. J Am Stat Assoc. 2015;110:910–922. [Google Scholar]
- 18.Jackson JW. Diagnostics for confounding of time-varying and other joint exposures. Epidemiology. 2016;27:859–869. [DOI] [PMC free article] [PubMed] [Google Scholar]
- 19.Nguyen TQ, Dafoe A, Ogburn EL. The Magnitude and Direction of Collider Bias for Binary Variables. Epidemiologic Methods, 2019. doi:10.1515/em-2017-0013. [Google Scholar]


