OBJECTIVES:
Eosinophilic esophagitis (EoE), a chronic food allergic disease, lacks sensitive and specific peripheral biomarkers. We hypothesized that levels of EoE-related biomarkers captured using a 1-hour minimally invasive Esophageal String Test (EST) would correlate with mucosal eosinophil counts and tissue concentrations of these same biomarkers. We aimed to determine whether a 1-hour EST accurately distinguishes active from inactive EoE or a normal esophagus.
METHODS:
In a prospective, multisite study, children and adults (ages 7–55 years) undergoing a clinically indicated esophagogastroduodenoscopy performed an EST with an esophageal dwell time of 1 hour. Subjects were divided into 3 groups: active EoE, inactive EoE, and normal esophageal mucosa. Eosinophil-associated protein levels were compared between EST effluents and esophageal biopsy extracts. Statistical modeling was performed to select biomarkers that best correlated with and predicted eosinophilic inflammation.
RESULTS:
One hundred thirty-four subjects (74 children, 60 adults) with active EoE (n = 62), inactive EoE (n = 37), and patient controls with a normal esophagus (n = 35) completed the study. EST-captured eosinophil-associated biomarkers correlated significantly with peak eosinophils/high-power field, endoscopic visual scoring, and the same proteins extracted from mucosal biopsies. Statistical modeling, using combined eotaxin-3 and major basic protein-1 concentrations, led to the development of EoE scores that distinguished subjects with active EoE from inactive EoE or normal esophagi. Eighty-seven percent of children, 95% of parents, and 92% of adults preferred the EST over endoscopy if it provided similar information.
DISCUSSION:
The 1-hour EST accurately distinguishes active from inactive EoE in children and adults and may facilitate monitoring of disease activity in a safe and minimally invasive fashion.
INTRODUCTION
Eosinophilic esophagitis (EoE) is a chronic immune-mediated food-allergic inflammatory disease affecting children and adults worldwide (1). An increasing number of studies have identified mucosal inflammatory patterns, novel therapeutic targets, and the natural history of the disease (2–4). Left untreated, active EoE seems to lead to esophageal fibrosis as the duration of diagnostic delay, based on symptom history, predicts the presence of stricture (2); treatment that reduces inflammation may limit complications (4,5). Thus, monitoring eosinophilic esophageal inflammation is critical to guide treatment decisions and permit forecasting of long-term patient outcomes.
Quantification of mucosal eosinophilia provides a meaningful metric to assess inflammation, but endoscopic procurement of mucosal samples has been hampered by the need for anesthesia/sedation, potential complications, high costs, time away from work and school, and limited assessment of the full esophageal mucosal surface. To address these concerns, a number of studies have sought to identify laboratory, functional, or radiographic biomarkers to replace mucosal eosinophilia as a diagnostic and monitoring metric. Our work and others have shown that eosinophil-associated proteins (EAPs) from the esophageal lumen correlate with EoE disease activity (6–9). We showed in children that eosinophil-derived granule proteins (EDGPs) captured in a 16-hour dwell time by the Esophageal String Test (EST) (16-hour EST) significantly correlated with the same biomarkers in endoscopically obtained mucosal biopsy samples (6). Notably, the 16-hour EST discriminated between children with active EoE from those with treated EoE in remission, gastroesophageal reflux disease (GERD), and a normal esophagus (6). Here we sought to determine whether the EST could capture EAPs in a clinically practical timeframe of 1 hour in children and adults, and whether these proteins correlated with EoE disease activity. EAPs included EDGPs as well as 2 eosinophil chemokines, eotaxin-2 (Eot2) and eotaxin-3 (Eot3).
METHODS
Subject recruitment
This prospective study was conducted at Children's Hospital Colorado, Ann & Robert H. Lurie Children's Hospital of Chicago, Northwestern University Hospital and Medical Center, University of Colorado Hospital, and Riley Children's Hospital. Subjects were recruited if they were (i) between the ages of 7–55 and (ii) undergoing a clinically indicated upper endoscopy with biopsy for symptoms of abdominal pain, vomiting, growth failure, dysphagia, or a history of EoE. Exclusion criteria included a history of esophageal stenosis defined as <10 mm diameter, gelatin allergy, or other factors placing subjects at increased risk of endoscopic complications (bleeding diatheses and connective tissue diseases). After review of the medical record, subject diagnoses were confirmed according to the following criterion: (i) EoE-active—symptoms of esophageal dysfunction, esophageal eosinophilia ≥15 eosinophils/high-power field (HPF), in whom other causes of symptoms and esophageal eosinophilia were excluded as per consensus recommendations (10,11); (ii) EoE-inactive—EoE as defined above but lack of symptoms and esophageal eosinophilia <15 eosinophils/HPF, after at least 8 weeks of EoE treatment (topical steroids, dietary elimination, elemental diet) and (iii) patient controls with normal esophagus—symptoms leading to endoscopic testing and normal mucosal appearance and histology of the upper gastrointestinal tract assessed. All enrolled subjects with EoE had failed treatment with proton pump inhibitors. The study was approved by the Institutional Review Boards (IRBs) of University of Colorado School of Medicine and Children's Hospital of Colorado (Colorado Multi-institutional IRB), University of Illinois at Chicago, Ann & Robert H. Lurie Children's Hospital, Northwestern University, and Indiana University and is listed at clinicaltrials.gov as protocol NCT02008903.
EST performance and histological assessment
The Enterotest string device (HDC Corporation, Milpitas, CA) was used to capture esophageal contents (12–17). The device consists of a weighted gelatin capsule containing 90 cm of nylon string. The capsule was swallowed no more than 4 hours before the scheduled endoscopic procedure, and the proximal end of the string was taped to the subject's cheek. One hour after swallowing the capsule, the string was removed, the esophageal segment was harvested and placed in EST elution buffer, and the eluate was frozen for EAP analyses as described previously (6). Subjects then underwent endoscopy with biopsy while pinch biopsies were obtained from proximal and distal esophageal mucosal surfaces and snap frozen. Both string and biopsies were stored at −80 °C until processed and batch analyzed at a later time. Diagnostic biopsies were placed in neutral buffered formalin for pathology processing, hematoxylin and eosin staining, and eosinophil enumeration as previously described; results were reported as peak eosinophils/HPF (eos/HPF) (surface area = 0.26 mm2) (6). To determine subject satisfaction with the 1-hour EST, study participants were asked to complete a survey. For pediatric subjects, both children and parents were asked to participate in the survey, and for adult subjects, only the participant responded.
Mucosal appearance assessment
An EoE Endoscopic Reference Score (EREFS) was recorded for each subject. Scores noted and graded the presence of the following esophageal features: edema, rings, exudates, furrows, and stricture. Assessments were made in real time or retrospectively using images taken during endoscopy as previously described (18).
EST and mucosal biopsy processing and analysis
EST samples and mucosal biopsies were processed for EAP quantification as previously described (6). EAP concentrations in biopsy extracts were normalized based on extracted protein concentration and reported as ng biomarker/mg protein. EAP concentrations in EST samples are reported as ng/mL of EST supernatant. For the purposes of this study, EAPs were proteins associated with eosinophils and EoE. Measured EAPs included the EDGPs eosinophil-derived neurotoxin (EDN), eosinophil peroxidase (EPX), and major basic protein 1 (MBP-1), the eosinophil cytosolic protein Charcot-Leyden crystal protein/Galectin-10 (CLC/Gal-10), Eot2, and Eot3. ELISA was performed on biopsy extracts and EST samples using either commercially available or in-house tests as follows: EDN (MBL International, Woburn, MA), EPX (Lee Laboratory assay, Scottsdale, AZ), MBP-1, CLC/Gal-10, (Ackerman Laboratory assay, Chicago, IL), Eot2 (Quantikine; R&D Systems, Minneapolis, MN), and Eot3 (DuoSet, R&D Systems, Minneapolis, MN) as previously described (6,19).
Statistical analysis
SAS 9.4 (SAS Institute, Cary, NC) and R (R Foundation for Statistical Computing, Vienna, Austria. URL https://www.R-project.org/) (20) software were used for analysis. Continuous data were summarized using mean plus SD or median plus interquartile or range. Parametric and nonparametric one-way Analysis of Variance (ANOVA), as appropriate, and χ2 test for association were used to compare 3 groups of subjects (i.e., EoE active, EoE inactive, and normal) with respect to continuous and categorical variables. Pearson or Spearman correlation coefficients, as appropriate, were used to examine the correlation of biomarkers with other continuous variables. Receiver operating characteristic (ROC) analysis using the SAS logistic regression procedure was used to examine the discriminating ability of biomarker(s) to differentiate active EoE (≥15 eos/HPF) from inactive EoE (<15 eos/HPF) in subjects with diagnosed EoE, and to differentiate subjects with active EoE from those with inactive EoE or patient controls with a normal esophagus. The integrated discrimination improvement (IDI) index (21) was analyzed using the SAS macro by Kennedy and Pencina (22). An EoE score was developed based on the predicted probability of having active EoE (≥15 eos/HPF) using a logistic regression model with logit link; a nomogram for this algorithm was generated using the R package, “rms”.
RESULTS
Subject characterization
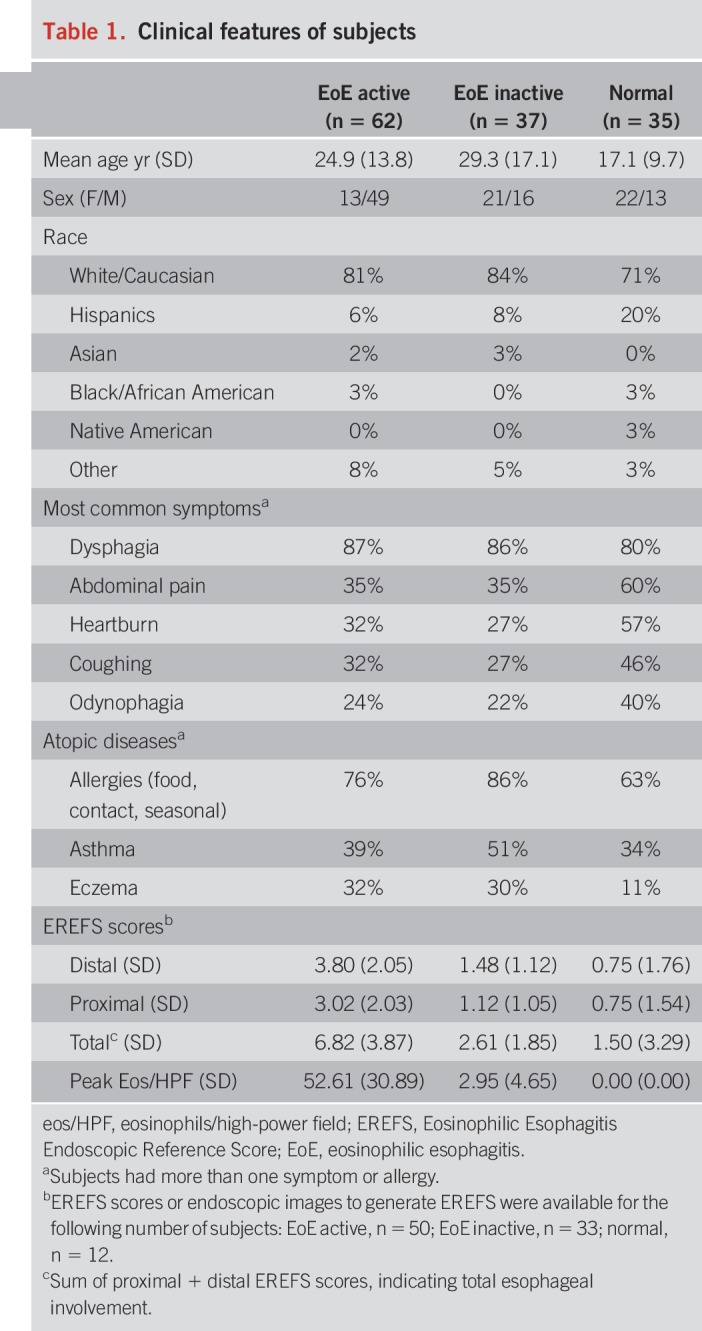
One hundred thirty-four (134) subjects (74 children, 60 adults) completed the study from participating sites (Children's Hospital Colorado, n = 52; Lurie Children's Hospital, n = 23; Northwestern University Hospital, n = 49; Riley Children's Hospital, n = 2; University of Colorado Hospital, n = 8). Demographics and clinical features are shown in Table 1. Patients were treated with topical steroids, elimination diet, or both steroids and diet. No serious adverse events were recorded and side effects noted during the EST included gagging (n = 30), nausea (n = 5), and sore throat (n = 6). Because of gagging, 14% of consented patients were not able to complete the study; no subjects required medications for gagging.
Table 1.
Clinical features of subjects
EAP levels from biopsy and EST samples correlate with mucosal eosinophil counts
We first sought to determine whether EAPs measured in samples from mucosal biopsies and the 1-hour EST correlated with peak eosinophil density in mucosal samples. As shown in Figure 1, all EAPs from mucosal biopsy sample extracts correlated significantly with mucosal eosinophil counts, ranging from r = 0.61 for Eot3 to 0.40 for Eot2 (all P < 0.0001). Similarly, there was a significant correlation of all EAPs from 1-hour EST string samples with mucosal eosinophil counts, ranging from r = 0.70 and 0.68 for CLC/Gal-10 and Eot3, respectively, to r = 0.53 for Eot2) (all P < 0.0001). Consistent with our previous study, our results indicate that both mucosal (biopsy) and luminal (EST) concentrations of EAPs can serve as surrogate markers of peak intraepithelial eosinophil counts, the present gold standard for assessing esophageal inflammation in EoE.
Figure 1.
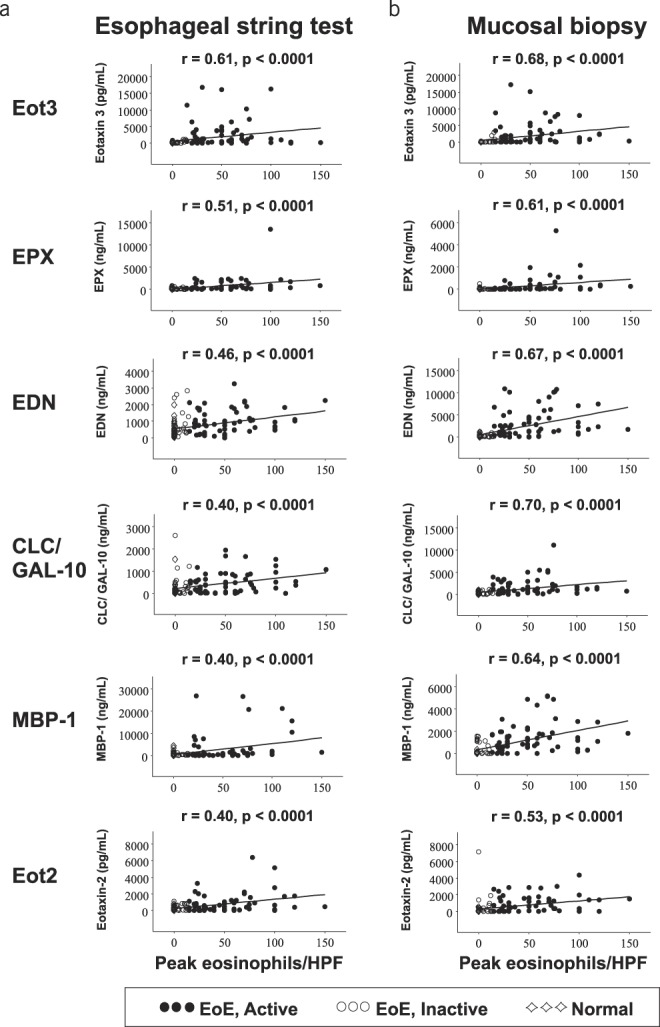
Eosinophil-associated biomarkers in EST and biopsy extract samples correlate with peak histologic eosinophil counts. Spearman analyses correlating EST samples (left panel) and biopsy extracts (right panel) with peak eosinophils/HPF were performed. Spearman rank correlation coefficients (r) and associated P-values are shown. Symbols denote subjects with (●) EoE, active; (◯) EoE, inactive; (◇) normal esophagus. CLC/GAL-10, Charcot-Leyden crystal protein/Galectin-10; EDN, eosinophil-derived neurotoxin; EoE, eosinophilic esophagitis; eos/HPF, eosinophils/high-power field; Eot2, eotaxin 2; Eot3, eotaxin 3; EPX, eosinophil peroxidase; EST, esophageal string test; MBP-1, eosinophil granule major basic protein 1.
EAP levels from EST samples correlate with those in biopsy samples
Because EAPs captured by the EST were strongly associated with esophageal eosinophilia, we next determined whether EAPs captured by the 1-hour EST correlated with the same EAPs extracted and quantified from esophageal biopsies. All EAP concentrations measured in samples obtained from the 1-hour EST and mucosal biopsies were found to significantly correlate with one another (Figure 2), these correlations being greatest for Eot3 (r = 0.73), followed by Eot2 (r = 0.60), EPX (r = 0.49), and MBP-1 (r = 0.46) (all P < 0.0001).
Figure 2.
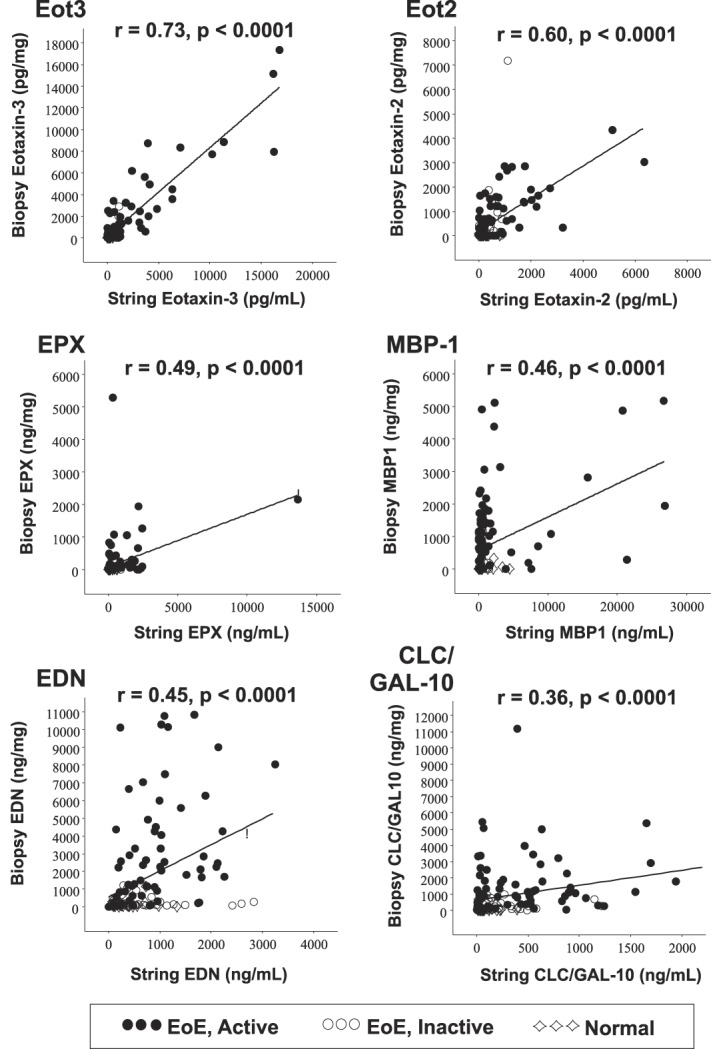
Eosinophil-associated biomarkers captured by the EST are significantly correlated with those measured in esophageal mucosal biopsies. Spearman rank correlation coefficients (r) and associated P-values are shown. Symbols denote subjects with (●) EoE, active; (◯) EoE, inactive; (◇) normal esophagus. CLC/GAL-10, Charcot-Leyden crystal protein/Galectin-10; EDN, eosinophil-derived neurotoxin; EoE, eosinophilic esophagitis; Eot2, eotaxin 2; Eot3, eotaxin 3; EPX, eosinophil peroxidase; EST, esophageal string test; MBP-1, eosinophil granule major basic protein 1.
Endoscopic appearance of EoE correlates with EST and biopsy EAP levels
Previous studies revealed that EREFS scores correlate with mucosal eosinophilia in adult and pediatric patients with EoE (18). We determined whether this visual analog of EoE disease activity correlated with eos/HPF and EAP concentrations in 1-hour EST and biopsy samples. Consistent with previous reports, pediatric and adult EREFS from subjects with active EoE, inactive EoE, and controls with a normal esophagus correlated significantly with eos/HPF in proximal, distal, and total esophagus (rs from 0.31 to 0.74) (see Table S1A, Supplementary Digital Content 1, http://links.lww.com/AJG/B281). Notably, EREFS also correlated significantly with both EST and mucosal biopsy concentrations of all EAPs measured (rs from 0.31 to 0.680 (see Table S1B, Supplementary Digital Content 1, http://links.lww.com/AJG/B281); no differences were observed between pediatric and adult subjects in analyzing these data (not shown).
EAPs captured by the EST distinguish active from inactive EoE, and from normal esophagus.
Because EAPs collected with the 1-hour EST correlated with mucosal eosinophilia, EAP levels in mucosal biopsies, and the endoscopic appearance of the esophageal mucosa, we next determined whether EAP levels from the EST were associated with disease activity. As shown in Figure 3, EAP concentrations obtained from EST samples were significantly higher in the active EoE group compared to inactive EoE and normal groups (see Table S2, Supplementary Digital Content 1, http://links.lww.com/AJG/B281). To determine whether 1-hour EST-based biomarker measurements have utility for monitoring esophageal inflammation, we generated ROC curves for the 1-hour EST-obtained individual EAPs. Consistent with our previous study (6), ROC analyses of the 1-hour EST individual EAPs showed considerable sensitivity and specificity for distinguishing between active EoE, inactive EoE, and a normal esophagus (see Figure S1, Supplementary Digital Content 1, http://links.lww.com/AJG/B281), with area under the curve (AUC) values for EST samples between 0.84 and 0.70 for Eot3 and Eot2, respectively, comparable to AUC values for biopsy extracts ranging from 0.85 for Eot3 to 0.76 for Eot2; AUC values >0.80 are considered highly predictive. Thus, the levels of Eot3 measured in both EST samples and biopsy extracts showed the greatest sensitivity and specificity for distinguishing patients with active EoE from those with inactive EoE or a normal esophagus.
Figure 3.
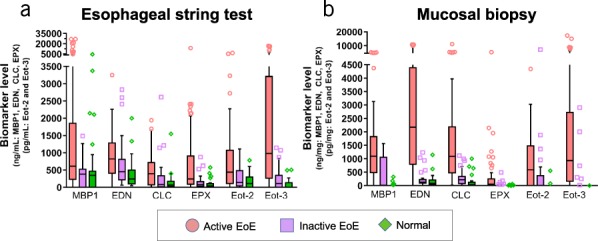
Luminal concentrations of eosinophil-associated biomarkers measured in EST samples differentiate subjects with active EoE, inactive EoE, or normal esophagus. Biomarkers were measured by ELISA in EST and mucosal biopsy samples. Levels in biopsy extracts were normalized to total protein content and are reported as ng biomarker/mg total protein. Biomarker levels in EST samples are reported as ng/mL of EST supernatant. Results are presented as box/whisker plots where the horizontal line and diamond inside the box are median and mean values, respectively; the box is the interquantiles; the lower and upper ends of whiskers are 5th and 95th percentiles, respectively; and symbols are data points with extreme values. Differences in protein biomarker levels across patient groups were compared using nonparametric ANOVA (refer to Supplemental Table S1 for P-values, see Supplementary Digital Content 1, http://links.lww.com/AJG/B281). CLC, Charcot-Leyden crystal protein; EoE, eosinophilic esophagitis; EDN, eosinophil-derived neurotoxin; Eot2, eotaxin 2; Eot3, eotaxin 3; EPX, eosinophil peroxidase; EST, esophageal string test; MBP-1, eosinophil granule major basic protein 1.
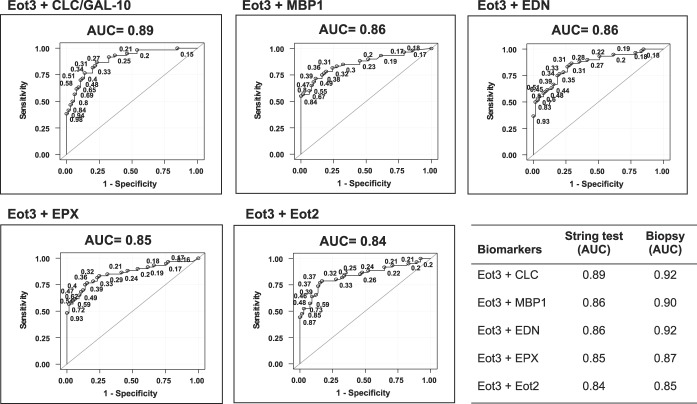
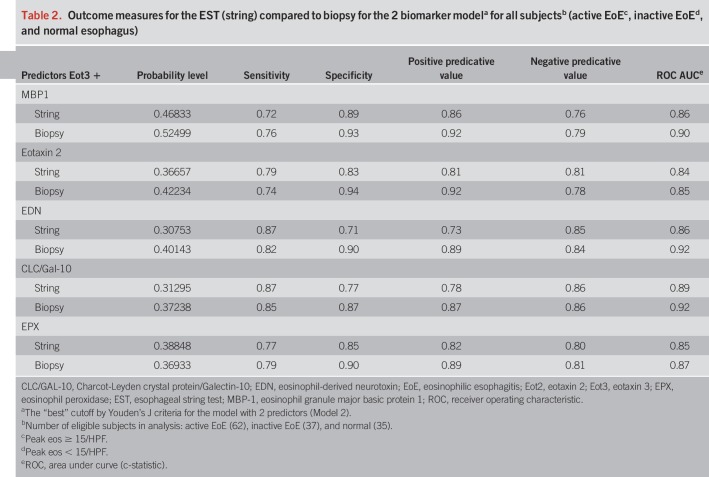
To further maximize the discriminating ability of these biomarker analytes to distinguish active EoE among these subject groups, we performed additional ROC analyses using combined sets of Eot3 plus each of the EDGPs in the EST samples as shown in Figure 4. The combination of Eot3 with MBP-1 in this model, for distinguishing active EoE from inactive EoE and normal patient controls (AUC = 0.86 and 0.90 for EST and biopsy, respectively), improved the average sensitivity (true positives) by 0.039 (0.693 vs 0.652) and also improved the average 1-specific (false positive rate) by 0.014 (0.261 vs 0.275), resulting in an IDI of 0.053 (see Tables S3 and S4, Supplementary Digital Content 1, http://links.lww.com/AJG/B281); the IDI, a summary of the change in detection rate and false positive rate (i.e., 1-specificity), is shown graphically in Figure S4 (see Figure S4 Supplementary Digital Content 1, http://links.lww.com/AJG/B281) (23). Similar ROC analyses using combined sets of Eot3 plus each of the individual EDGPs in biopsy extracts are shown in Figure S2 (see Supplementary Digital Content 1, http://links.lww.com/AJG/B281). Outcome measures for the EST (string) compared to biopsies (extracts) for the two-biomarker model for subjects with active EoE, inactive EoE, or normal esophagus are shown in Table 2 for the combination of Eot3 with each of the EDGPs studied; these combinations showed highly significant and comparable outcome measures including probability, sensitivity, specificity, positive predictive value (PPV), negative predictive value (NPV), and area under the curve (AUC), further supporting use of the EST for capturing active esophageal eosinophilic inflammation among all study patients performing the EST.
Figure 4.
ROC curves show significant sensitivity and specificity for identifying active EoE (≥15 Eos/hpf) among all patients (active or inactive EoE, or normal esophagus). ROC analyses used the level of Eot3 plus one additional biomarker as indicated captured by the 1-hour EST or measured in mucosal biopsy extracts (lower right panel; see Figure S2, Supplementary Digital Content 1, http://links.lww.com/AJG/B281). Results are shown for Eot3, Eot3 plus CLC (Gal-10), Charcot-Leyden crystal protein/Galectin-10; MBP-1, EDN, eosinophil-derived neurotoxin; EPX, eosinophil peroxidase; and Eot2, eotaxin 2. Points on the ROC curves are labeled by their predictive probabilities. The AUC is indicated above each panel; AUC values >0.80 are considered highly predictive. The table (lower right panel) shows the comparative AUC values for the 1-hour EST vs mucosal biopsy extracts for the indicated biomarker combinations. AUC, area under the curve; CLC, Charcot-Leyden crystal protein; EoE, eosinophilic esophagitis; EDN, eosinophil-derived neurotoxin; Eot2, eotaxin 2; Eot3, eotaxin 3; EPX, eosinophil peroxidase; MBP-1, eosinophil granule major basic protein 1; ROC, receiver operating characteristic.
Table 2.
Outcome measures for the EST (string) compared to biopsy for the 2 biomarker modela for all subjectsb (active EoEc, inactive EoEd, and normal esophagus)
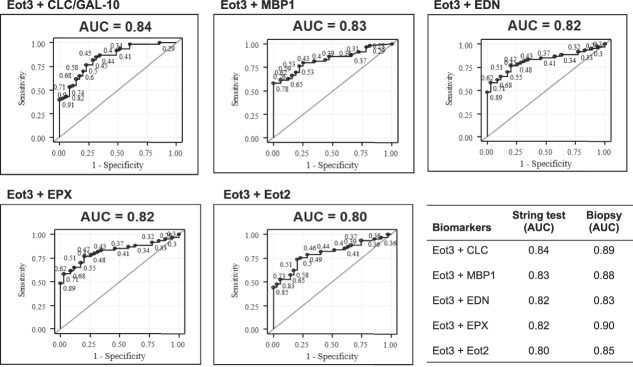
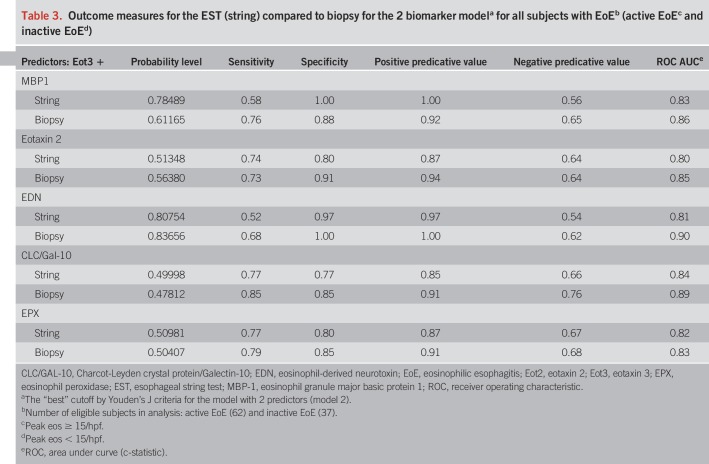
We next performed similar ROC analyses for the ability of Eot3 + MBP-1 combined in this model to improve the probability of discriminating between subjects with active vs inactive (treated) EoE in subjects with a confirmed diagnosis of EoE (Figure 5). Combined, Eot3 + MBP-1 significantly improved the average sensitivity (true positives) by 0.046 (0.766 vs 0.72) and also improved 1-specific (false positive rate) by 0.032 (0.438 vs 0.471), leading to an IDI value of 0.078 (see Tables S3 and S4, Supplementary Digital Content 1, http://links.lww.com/AJG/B281). Combining levels of CLC/Gal-10 or EPX with Eot3 similarly improved false positive rates, but had smaller influences on sensitivity, with smaller IDI values for CLC/Gal-10 and EPX compared to MBP-1 (see Table S3, Supplementary Digital Content 1, http://links.lww.com/AJG/B281). Similar ROC analyses using combined sets of Eot3 plus the EDGPs in biopsy extracts are shown in Figure S3(see Figure S3, Supplementary Digital Content 1, http://links.lww.com/AJG/B281). Outcome measures for ESTs (string) compared to biopsies (extracts) for the two-biomarker (Eot3 + EDGP) model for distinguishing subjects with active vs inactive EoE among all subjects with a confirmed diagnosis of EoE are shown in Table 3; these combinations similarly showed highly significant and comparable outcome measures for probability, sensitivity, specificity, PPV, NPV, and AUC for EST vs biopsy samples, further demonstrating utility of the 1-hour EST for distinguishing active from inactive esophageal inflammation among study patients with an EoE diagnosis. Overall, the combined biomarker model (model 2) using Eot3 + MBP-1 showed the greatest ability to assess mucosal eosinophilic inflammation, being optimal for differentiating active EoE from normal esophagus, and for discriminating between EoE subjects with active vs inactive disease.
Figure 5.
ROC curves distinguish subjects with active EoE (≥15 Eos/hpf) from inactive EoE (<15 Eos/hpf). ROC analyses used the level of Eot3 plus one additional biomarker captured by the 1-hour EST or measured in mucosal biopsy extracts (lower right panel; see Figure S3, Supplementary Digital Content 1, http://links.lww.com/AJG/B281). Results are shown for Eot3, Eot3 plus CLC (Gal-10), Charcot-Leyden crystal protein/galectin-10; MBP-1, major basic protein-1; EPX, eosinophil peroxidase; EDN, eosinophil-derived neurotoxin; and Eot2, eotaxin 2. Points on the ROC curves are labeled by their predictive probabilities. The AUC is indicated above each panel; AUC values >0.80 are considered highly predictive. The table (lower right panel) shows the comparative AUC values for the 1-hour EST vs mucosal biopsy extracts for the indicated biomarker combinations. AUC, area under the curve; CLC/GAL-10, Charcot-Leyden crystal protein/Galectin-10; EoE, eosinophilic esophagitis; EDN, eosinophil-derived neurotoxin; Eot2, eotaxin 2; Eot3, eotaxin 3; EPX, eosinophil peroxidase; MBP-1, eosinophil granule major basic protein 1; ROC, receiver operating characteristic.
Table 3.
Outcome measures for the EST (string) compared to biopsy for the 2 biomarker modela for all subjects with EoEb (active EoEc and inactive EoEd)
With the finding that measuring a combination of Eot3 and the EDGPs (particularly MBP-1) permits detection of mucosal inflammation in subjects with EoE, we used statistical modeling to provide a means of translating these biomarkers into the probability of having a threshold number of esophageal eosinophils. This model utilizes a combination of the concentrations of Eot3 and MBP-1 from a 1-hour EST sample to generate the probability of a subject having mucosal eosinophilia ≥15 eosinophils/HPF. The nomogram in Figure S5 (see Figure S5, Supplementary Digital Content 1, http://links.lww.com/AJG/B281) was generated using Eot3 and MBP-1 levels captured by 1-hour ESTs from all patients with a confirmed diagnosis of EoE for the purpose of discriminating between subjects with active EoE (≥15 peak eos/HPF) and those with inactive disease (<15 eos/HPF), i.e., treated EoE subjects in remission. It provides the probability of a subject with a known diagnosis of EoE being in remission or continuing to have active esophageal inflammation during treatment, e.g., following a food elimination diet or during food reintroductions.
Subjects prefer the EST over traditional endoscopy
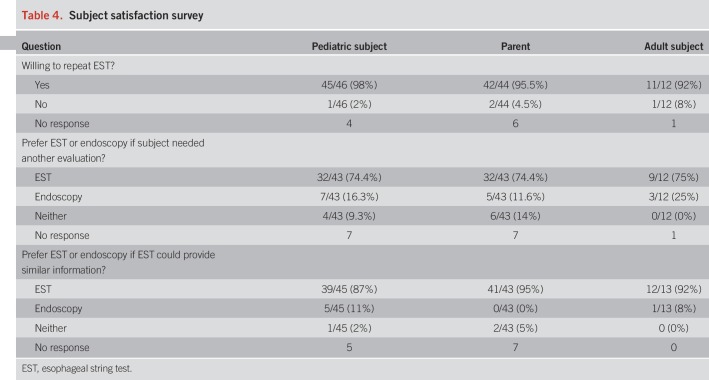
Of the 134 subjects completing the study, 44% completed a follow-up survey. Of those responding, 98% of children and 96% of parents were willing to repeat the EST, and 74% and 78% of children and parents respectively preferred the 1-hour EST over endoscopy if the child was to need another evaluation (Table 4). Finally, 87% of children and 95% of parents indicated a preference for performing an EST over endoscopy if it could provide similar information. Of adult respondents who completed the EST, 92% were willing to repeat the test, and of these, 75% preferred the EST over endoscopy if another evaluation was needed. Finally, 92% of adults indicated a preference for performing an EST over endoscopy if it could provide similar information.
Table 4.
Subject satisfaction survey
DISCUSSION
Accumulated clinical experience and natural history studies have documented the widespread and chronic nature of EoE (2). Untreated EoE may lead to the development of esophageal strictures, whereas treatment may prevent food impaction (24,25). Thus, assessment of esophageal inflammation has become important for optimizing clinical outcomes for children and adults with EoE. Since the present standard approach for measuring inflammation relies on sedated endoscopy and biopsy, development of alternatives to this approach are imperative. Here, we demonstrate that the EST can capture biomarkers relevant to EoE in a clinically useful time frame of 1 hour.
Biomarker measurements in fluids surrounding diseased organs have been used to assess inflammation in a number of diseases. For instance, tears, bronchial washes, and stool effluent can provide valuable information in allergic conjunctivitis, asthma, and inflammatory bowel diseases (26,27). Currently, monitoring esophageal inflammation in EoE patients necessitates sedated endoscopy with biopsy and histologic assessment of esophageal eosinophilia. To limit costs, maximize data capture, eliminate endoscopic and anesthetic complications, and save time, we hypothesized that the minimally invasive EST could capture EAPs in a convenient time frame of 1 hour, and EAP concentrations would reflect that found in the tissue.
We previously reported the ability of the 16-hour EST to successfully capture esophageal EAPs in an overnight sampling period, and that the EDGP concentrations significantly correlated with those measured in mucosal biopsies (6). Here, we extend these findings to capture samples in a shorter time frame of 1 hour and to include EoE relevant cytokine analyses. In this regard, pairing of the EST-derived concentrations of eosinophil granule MBP-1, with Eot3/CCL26, led to a significant correlation with mucosal biopsy-derived levels of those same proteins as well as eosinophil counts. Similar to our previous study in children (6), these results support the use of the EST to monitor inflammation in both children and adults with EoE, and provide support for its use in a clinically relevant time frame of 1 hour.
Our results support not only the EST's ability to capture mucosal inflammation but also in its ability to reflect gross evidence of surface inflammation. Comparison of EST-captured biomarkers to a pediatric- and adult-validated endoscopic EoE reference score (EREFS) (18) identified significant correlations of proximal, distal, and total EREFS with the levels of EST-captured EAPs, including Eot2 and Eot3, which showed the greatest correlations to total EREFS scores. These findings further validate the EST as a correlate for endoscopic assessment of disease activity in pediatric and adult patients with EoE.
Since symptoms do not always correlate with mucosal inflammation, and peripheral biomarkers of EoE such as blood (28), stool (29), urine (30), nasopharynx (31,32), or breath condensate (33) have not attained sufficient sensitivity and specificity to be clinically useful for determining the status of EoE disease activity, the clinical impact of the EST is broad and significant. The EST could be used in office-based settings, research studies, or clinical trials to monitor inflammation following institution of new therapy or changes in diet treatments. Current practice patterns and research studies rely on sedated endoscopy and mucosal biopsy after a change in treatment; in some cases, this can result in multiple endoscopies over the course of a year. Use of the EST would eliminate these repeat endoscopic studies, thus saving money, time, and reducing potential complications. In clinical practice, EoE patients may experience unexplained symptoms that may be related to inflammation; in these circumstances, instead of endoscopy, the EST could be used to assess for the presence (or absence) of inflammation that would then dictate further diagnostics or treatment changes. The EST could also be used for screening for occult inflammation in individuals at higher risk or suspicion of EoE. For example, siblings or family members of patients affected by EoE with subtle symptoms or highly allergic patients considering oral immunotherapy could be tested with the EST, because oral immunotherapy has been linked to the development or unmasking of EoE in some individuals (34). Results of these tests may lead to, or eliminate the need for, further testing.
Future studies will identify novel EoE-related biomarkers that may predict various EoE phenotypes, such as those prone to food impactions or stricturing, or therapeutic responsiveness to topical steroids, diet, or future treatment with biologics (35). Finally, the 1-hour EST-based measurements of pathophysiologically relevant biomarkers (3), such as those related to the esophageal microbiome (36,37), epithelial barrier function (38,39), esophageal motility (40,41), and mucosal remodeling (42,43) may provide insights into novel therapeutic targets or personalized medicine approaches. With respect to these proposed uses, studies to date support the present clinical use of the EST to monitor inflammation in patients with EoE, especially since most children/parents, and adult patients preferred the option of performing the 1-hour EST over undergoing additional endoscopies with biopsy.
Other novel methods to assess the esophageal mucosa in patients with EoE include transnasal endoscopy (44), the Cytosponge (7,8,45), and tethered confocal microscopy (46,47). Transnasal endoscopy requires an endoscopic device, specialized training, provides a small sample size, and requires consultation with a pathologist. The Cytosponge may be more challenging to swallow and retrieve in children (7,8,45). Tethered microscopy requires specialized equipment. In contrast to mucosal biopsy, the EST is able to capture biomarkers along the entire length of the esophagus, thus maximizing epithelial and luminal interrogation.
Limitations of the study include the use of patient controls with an endoscopically and histologically normal esophagus, and that comparisons between subjects with active/inactive EoE were cross-sectional rather than longitudinal in the same subject. Since the study was not designed to track patients with respect to treatments, this was not fully addressed and will be the focus of future studies. Limitations of the 1-hour EST include that it cannot be used in patients who are unable to swallow pills or in those with esophageal narrowing or allergy to the gelatin capsule. A potential confounding variable is that atopic patients may swallow EAPs derived from nasal, pulmonary, or ocular secretions; these secretions may adhere to the EST and increase the EST EAP concentrations. We have not noted any correlation between self-reported comorbid allergic disease and increased levels of the EAPs in EST samples (6).
Results from the current study support use of the 1-hour EST as a surrogate for quantifying mucosal eosinophilic inflammation in patients with a known or suspected diagnosis of EoE. Dual quantitation of the EST-captured EAPs, Eot3 and MBP-1, can be converted by nomogram or its underlying algorithm into an “EoEScore” with multiple relevant uses including monitoring disease activity and screening for undiagnosed EoE. Use of this minimally invasive tool can improve the quality of patient's lives, reduce costs in clinical practice, and accelerate progress of therapeutic trials.
CONFLICTS OF INTEREST
Guarantor of the article: Steven J. Ackerman, PhD and Glenn T. Furuta, MD accept full responsibility for the conduct of the study, have had access to the data, and have control of the decision to publish the findings.
Specific author contributions: S.J.A. planned and conducted the study, obtained IRB protocol approvals, supervised clinical sample processing and biomarker analyses, development of biomarker immunoassays, data collection, interpretation, presentation, and wrote/edited the manuscript. A.F.K., I.H., P.M.-K., S.G. and J.W. conducted the study, enrolled subjects, collected clinical samples, obtained IRB protocol approvals and edited the manuscript. M.G. processed samples, performed biomarker analyses, collected, collated, and analyzed research data, and drafted/edited the manuscript. Z.P. analyzed the data, performed statistical analyses, and edited the manuscript. J.C.M. supervised clinical sample processing and biomarker analyses, and edited the manuscript. J.D. developed biomarker immunoassays, processed, and analyzed clinical samples. R.J.F. and P.A. processed and analyzed biomarkers in clinical samples. J.J.L. and S.O. supervised and performed biomarker (EPX) immunoassay. K.C. and H.M.-A. performed pathologic assessments of biopsies, F.A., K.B., A.D., K.A., K.K., M.S., and A.Z. recruited subjects, performed the EST, and collected clinical samples. D.A. supervised research coordinators, recruited subjects, interpreted data, and edited the manuscript. All authors have reviewed the manuscript and approved the final submitted version. G.T.F. planned and conducted the study, obtained IRB protocol approvals, supervised subject recruitment, collection of clinical samples, presentation, analysis, and interpretation of data, and drafted/edited the manuscript.
Financial support: This study was supported by FDA grant R01FD004086 (to SJA/GTF), awarded through the RFA-FD-11-001 “Clinical Studies of Safety and Effectiveness of Orphan Products Research Project Grants (R01)”. The Research Open Access Publishing (ROAAP) Fund of the University of Illinois at Chicago provided financial support towards open access publication of this article. The study sponsors have not had any role in the study design, collection, analysis, or interpretation of the data, nor in the writing of this report.
Potential competing interests: S.J.A. and G.T.F. are coinventors of the EST, and cofounders and members of the board of managers of EnteroTrack, LLC. The remainder of the coauthors have no competing interests to declare.
Study Highlights.
WHAT IS KNOWN
✓ The current care of patients with EoE is challenging because of the need to perform invasive and costly endoscopy with multiple esophageal biopsies and the lack of meaningful peripheral biomarkers to monitor disease activity.
✓ Repeated endoscopies are typically performed to assess response during the course of medical or dietary therapy.
✓ Use of an overnight 16-hour EST demonstrated that the concentrations of EAPs significantly correlated with the histologic numbers of eosinophils in the esophageal mucosa and distinguished between active EoE and inactive (treated) EoE in children.
WHAT IS NEW HERE
✓ A clinically convenient 1-hour EST captured EAPs that distinguished patients with active EoE from those in remission.
✓ The 1-hour EST is a nonendoscopic surrogate for quantification of mucosal esophageal eosinophils in both adult and pediatric patients with EoE.
✓ The 1-hour EST could be used in lieu of repeat endoscopies to monitor EoE mucosal inflammation and thereby guide treatment decisions.
ACKNOWLEDGMENTS
We thank all of the patients and families who participated in this study, the seminal contributions of gastroenterology physicians who performed endoscopic assessments, and the nurses and research coordinators at participating sites without whom this study would not have been possible. We also thank Anushri Kartik-Narayan for assisting with EST and esophageal biopsy sample organization, cataloging, and preparation of biopsy extracts.
Footnotes
SUPPLEMENTARY MATERIAL accompanies this paper at http://links.lww.com/AJG/B281
REFERENCES
- 1.Furuta GT, Katzka DA. Eosinophilic esophagitis. N Engl J Med 2015;373:1640–8. [DOI] [PMC free article] [PubMed] [Google Scholar]
- 2.Dellon ES, Hirano I. Epidemiology and natural history of eosinophilic esophagitis. Gastroenterology 2018;154:319–32. [DOI] [PMC free article] [PubMed] [Google Scholar]
- 3.O'Shea KM, Aceves SS, Dellon ES, et al. Pathophysiology of eosinophilic esophagitis. Gastroenterology 2018;154:333–45. [DOI] [PMC free article] [PubMed] [Google Scholar]
- 4.Straumann A, Katzka DA. Diagnosis and treatment of eosinophilic esophagitis. Gastroenterology 2018;154:346–59. [DOI] [PubMed] [Google Scholar]
- 5.Schoepfer AM, Straumann A, Safroneeva E. Pharmacologic treatment of eosinophilic esophagitis: An update. Gastrointest Endosc Clin N Am 2018;28:77–88. [DOI] [PubMed] [Google Scholar]
- 6.Furuta GT, Kagalwalla AF, Lee JJ, et al. The oesophageal string test: A novel, minimally invasive method measures mucosal inflammation in eosinophilic oesophagitis. Gut 2013;62:1395–405. [DOI] [PMC free article] [PubMed] [Google Scholar]
- 7.Katzka DA, Smyrk TC, Alexander JA, et al. Accuracy and safety of the cytosponge for assessing histologic activity in eosinophilic esophagitis: A two-center study. Am J Gastroenterol 2017;112:1538–44. [DOI] [PMC free article] [PubMed] [Google Scholar]
- 8.Katzka DA, Geno DM, Ravi A, et al. Accuracy, safety, and tolerability of tissue collection by cytosponge vs endoscopy for evaluation of eosinophilic esophagitis. Clin Gastroenterol Hepatol 2015;13:77–83. [DOI] [PubMed] [Google Scholar]
- 9.Hiremath G, Gupta SK. Promising modalities to identify and monitor eosinophilic esophagitis. Clin Gastroenterol Hepatol 2017;15:1655–64. [DOI] [PubMed] [Google Scholar]
- 10.Liacouras CA, Furuta GT, Hirano I, et al. Eosinophilic esophagitis: Updated consensus recommendations for children and adults. J Allergy Clin Immunol 2011;128:3–20. [DOI] [PubMed] [Google Scholar]
- 11.Furuta GT, Liacouras CA, Collins MH, et al. Eosinophilic esophagitis in children and adults: A systematic review and consensus recommendations for diagnosis and treatment. Gastroenterology 2007;133:1342–63. [DOI] [PubMed] [Google Scholar]
- 12.Goldsmid JM, Davies N. Diagnosis of parasitic infections of the small intestine by the Enterotest duodenal capsule. Med J Aust 1978;1:519–20. [DOI] [PubMed] [Google Scholar]
- 13.Thomas GE, Goldsmid JM, Wicks AC. Use of the enterotest duodenal capsule in the diagnosis of giardiasis. A preliminary study. S Afr Med J 1974;48:2219–20. [PubMed] [Google Scholar]
- 14.Beukeveld GJ, Bijleveld CM, Kuipers F, et al. Evaluation and clinical application of the enterotest for the determination of human biliary porphyrin composition. Eur J Clin Chem Clin Biochem 1995;33:453–62. [PubMed] [Google Scholar]
- 15.Kopanski Z, Schlegel-Zawadzka M, Witkowska B, et al. Role of the enterotest in the diagnosis of the helicobacter pylori infections. Eur J Med Res 1996;1:520–2. [PubMed] [Google Scholar]
- 16.Liebman WM, Rosenthal P. The string test for gastroesophageal reflux. Am J Dis Child 1980;134:775–6. [DOI] [PubMed] [Google Scholar]
- 17.Guiney WJ, Beaumont C, Thomas SR, et al. Use of Entero-Test, a simple approach for non-invasive clinical evaluation of the biliary disposition of drugs. Br J Clin Pharmacol 2011;72:133–42. [DOI] [PMC free article] [PubMed] [Google Scholar]
- 18.Hirano I, Moy N, Heckman MG, et al. Endoscopic assessment of the oesophageal features of eosinophilic oesophagitis: Validation of a novel classification and grading system. Gut 2013;62:489–95. [DOI] [PubMed] [Google Scholar]
- 19.Ochkur SI, Kim JD, Protheroe CA, et al. A sensitive high throughput ELISA for human eosinophil peroxidase: A specific assay to quantify eosinophil degranulation from patient-derived sources. J Immunol Methods 2012;384:10–20. [DOI] [PMC free article] [PubMed] [Google Scholar]
- 20.Team RC. R: A Language and Environment for Statistical Computing The R Foundation for Statistical Computing, Vienna, Austria, 2017. https://www.R-project.org/. Accessed September 9, 2019. [Google Scholar]
- 21.Pencina MJ, D'Agostino RB, Sr, D'Agostino RB, Jr, et al. Evaluating the added predictive ability of a new marker: From area under the ROC curve to reclassification and beyond. Stat Med 2008;27:157–12. [DOI] [PubMed] [Google Scholar]
- 22.Kennedy KF, Pencina MJ. A SAS® Macro to Compute Added Predictive Ability of New Markers Predicting a Dichotomous Outcome. Conference Proceedings. Paper no. SDA-07, 2010. https://www.semanticscholar.org/paper/A-SAS-%C2%AE-Macro-to-Compute-Added-Predictive-Ability-a-Kennedy-Pencina/20ee3621676a919456309349c108f7cd93701a60. Accessed September 9, 2019. [Google Scholar]
- 23.Pickering JW, Endre ZH. New metrics for assessing diagnostic potential of candidate biomarkers. Clin J Am Soc Nephrol 2012;7:1355–64. [DOI] [PubMed] [Google Scholar]
- 24.Dellon ES, Kim HP, Sperry SL, et al. A phenotypic analysis shows that eosinophilic esophagitis is a progressive fibrostenotic disease. Gastrointest Endosc 2014;79:577–85. [DOI] [PMC free article] [PubMed] [Google Scholar]
- 25.Kuchen T, Straumann A, Safroneeva E, et al. Swallowed topical corticosteroids reduce the risk for long-lasting bolus impactions in eosinophilic esophagitis. Allergy 2014;69:1248–54. [DOI] [PubMed] [Google Scholar]
- 26.Chang JY, Cheon JH. Fecal immunochemical test and fecal calprotectin measurement are noninvasive monitoring tools for predicting endoscopic activity in patients with ulcerative colitis. Gut Liver 2018;12:117–8. [DOI] [PMC free article] [PubMed] [Google Scholar]
- 27.Mak WY, Buisson A, Andersen MJ, Jr, et al. Fecal calprotectin in assessing endoscopic and histological remission in patients with ulcerative colitis. Dig Dis Sci 2018;63:1294–301. [DOI] [PubMed] [Google Scholar]
- 28.Konikoff MR, Blanchard C, Kirby C, et al. Potential of blood eosinophils, eosinophil-derived neurotoxin, and eotaxin-3 as biomarkers of eosinophilic esophagitis. Clin Gastroenterol Hepatol 2006;4:1328–36. [DOI] [PubMed] [Google Scholar]
- 29.Subbarao G, Rosenman MB, Ohnuki L, et al. Exploring potential noninvasive biomarkers in eosinophilic esophagitis in children. J Pediatr Gastroenterol Nutr 2011;53:651–8. [DOI] [PubMed] [Google Scholar]
- 30.Cunnion KM, Willis LK, Minto HB, et al. Eosinophil quantitated urine kinetic: A novel assay for assessment of eosinophilic esophagitis. Ann Allergy Asthma Immunol 2016;116:435–9. [DOI] [PubMed] [Google Scholar]
- 31.Schroeder S, Ochkur SI, Shim KP, et al. Throat-derived eosinophil peroxidase is not a reliable biomarker of pediatric eosinophilic esophagitis. J Allergy Clin Immunol Pract 2017;5:1804–5. [DOI] [PubMed] [Google Scholar]
- 32.Saffari H, Baer K, Boynton KK, et al. Pharyngeal mucosa brushing does not correlate with disease activity in patients with eosinophilic esophagitis. J Allergy Clin Immunol Pract 2017;5:1455–6. [DOI] [PubMed] [Google Scholar]
- 33.Leung J, Nguyen-Traxler A, Lee EM, et al. Assessment of fractionated exhaled nitric oxide as a biomarker for the treatment of eosinophilic esophagitis. Allergy Asthma Proc 2012;33:519–24. [DOI] [PMC free article] [PubMed] [Google Scholar]
- 34.Lucendo AJ, Arias A, Tenias JM. Relation between eosinophilic esophagitis and oral immunotherapy for food allergy: A systematic review with meta-analysis. Ann Allergy Asthma Immunol 2014;113:624–9. [DOI] [PubMed] [Google Scholar]
- 35.Shoda T, Wen T, Aceves SS, et al. Eosinophilic oesophagitis endotype classification by molecular, clinical, and histopathological analyses: A cross-sectional study. Lancet Gastroenterol Hepatol 2018;3:477–88. [DOI] [PMC free article] [PubMed] [Google Scholar]
- 36.Harris JK, Fang R, Wagner BD, et al. Esophageal microbiome in eosinophilic esophagitis. PLoS One 2015;10:e0128346. [DOI] [PMC free article] [PubMed] [Google Scholar]
- 37.Fillon SA, Harris JK, Wagner BD, et al. Novel device to sample the esophageal microbiome—The esophageal string test. PLoS One 2012;7:e42938. [DOI] [PMC free article] [PubMed] [Google Scholar]
- 38.Sherrill JD, Kc K, Wu D, et al. Desmoglein-1 regulates esophageal epithelial barrier function and immune responses in eosinophilic esophagitis. Mucosal Immunol 2014;7:718–29. [DOI] [PMC free article] [PubMed] [Google Scholar]
- 39.Rochman M, Travers J, Miracle CE, et al. Profound loss of esophageal tissue differentiation in patients with eosinophilic esophagitis. J Allergy Clin Immunol 2017;140:738–749. [DOI] [PMC free article] [PubMed] [Google Scholar]
- 40.Kwiatek MA, Pandolfino JE, Hirano I, et al. Esophagogastric junction distensibility assessed with an endoscopic functional luminal imaging probe (EndoFLIP). Gastrointest Endosc 2010;72:272–8. [DOI] [PMC free article] [PubMed] [Google Scholar]
- 41.Kahrilas JM, Clayton SB, Richter JE. Intrabolus pressure on high-resolution manometry distinguishes fibrostenotic and inflammatory phenotypes of eosinophilic esophagitis. Dis Esophagus 2016;29:551–7. [DOI] [PubMed] [Google Scholar]
- 42.Kagalwalla AF, Akhtar N, Woodruff SA, et al. Eosinophilic esophagitis: Epithelial mesenchymal transition contributes to esophageal remodeling and reverses with treatment. J Allergy Clin Immunol 2012;129:1387–e7. [DOI] [PMC free article] [PubMed] [Google Scholar]
- 43.Muir AB, Dods K, Noah Y, et al. Esophageal epithelial cells acquire functional characteristics of activated myofibroblasts after undergoing an epithelial to mesenchymal transition. Exp Cell Res 2015;330:102–10. [DOI] [PMC free article] [PubMed] [Google Scholar]
- 44.Friedlander JA, DeBoer EM, Soden JS, et al. Unsedated transnasal esophagoscopy for monitoring therapy in pediatric eosinophilic esophagitis. Gastrointest Endosc 2016;83:299–306. [DOI] [PMC free article] [PubMed] [Google Scholar]
- 45.Januszewicz W, Tan WK, Lehovsky K, et al. Safety and acceptability of esophageal cytosponge cell collection device in a pooled analysis of data from individual patients. Clin Gastroenterol Hepatol 2019;17(4):647–56.e1. [DOI] [PMC free article] [PubMed] [Google Scholar]
- 46.Tabatabaei N, Kang D, Kim M, et al. Clinical translation of tethered confocal microscopy capsule for unsedated diagnosis of eosinophilic esophagitis. Sci Rep 2018;8:2631. [DOI] [PMC free article] [PubMed] [Google Scholar]
- 47.Tabatabaei N, Kang D, Wu T, et al. Tethered confocal endomicroscopy capsule for diagnosis and monitoring of eosinophilic esophagitis. Biomed Opt Express 2013;5:197–207. [DOI] [PMC free article] [PubMed] [Google Scholar]


