Abstract
The rich semantic representation and sophisticated structure definition of the HL7 Fast Healthcare Interoperability Resources (FHIR) specification require relatively great efforts to understand and utilize. The objective of our study is to design, develop, and evaluate an open-source and user-friendly visualization interface for exploring the FHIR specification. We prototyped an interactive visualization tool for navigating and manipulating the FHIR core resources, profiles, and extensions. The utility of the tool was evaluated using evaluation metrics mainly focusing on its interactive mechanism and content expressiveness. We demonstrated that the visualization techniques are helpful for navigating the HL7 FHIR specification and aiding its profiling.
Keywords: HL7 FHIR, Visualization, Interactive browsing, Model profiling, Clinical data model
Introduction
With the rapid increase of modeling diversity and data scale for health data, multi-dimensional health information standardization from modeling to representation is widely acknowledged as a key for the successful data exchange and interoperation of healthcare information systems. Efforts of standardization have been investigated by many healthcare organizations, including the Health Level Seven (HL7) International [1], the Observational Health Data Sciences and Informatics (OHDSI) [2], and the Patient-Centered Outcomes Research Institute (PCORI) [3], thereupon several different health data standards have been developed and spread both in the research and industrial communities [4, 5].
The HL7 Fast Healthcare Interoperability Resources (FHIR) [6] is emerging as a next-generation standards framework for the exchange of electronic health records (EHR) data, after the development of several families of HL7 interoperability standards, including HL7 v2, HL7 v3, and Clinical Document Architectures [7]. FHIR is a common platform standard which defines a set of core resources and an infrastructure for handling resources [8]. FHIR specification provides a series of definitions and constraints for clinical elements within a particular resource, including attributes for an element, data type, data range, and data references. On the one hand, FHIR’s rich structure definition and extensibility enable broad supportability of health data representation for the EHR data. On the other hand, FHIR defines a great amount of model elements and relations, which require tremendous efforts to understand and utilize. Currently, the HL7 provides a HTML-based browsing method for the FHIR models, which guides users reading the FHIR specification through content classifications and hyperlinks. To better understand the FHIR model structure and then utilize the FHIR model in real-world clinical scenarios, there is an urgent need on the tooling support in the model browsing and interactive authoring for the FHIR model researchers and implementers. Although HL7 provides the detailed model description, and the hyperlinks embedded in the descriptive documents have been helpful for navigating users to understand the FHIR specification, it is still desirable to bring more interactive features such as graphical browsing, element searching, and profiling support for the FHIR specification.
Even though no single browser could meet all the model visualization requirements, a number of model browsing tools have been developed to assist different users and different tasks. These browsers play various roles in model visualization to help model users better understand target model. Some of these tools are described as follows.
CIMI Archetype Browser [9]
The Clinical Information Modeling Initiative (CIMI) community develops a CIMI archetype browser for navigating the CIMI archetype models. The CIMI defines the formalized representation and the logical structure of data elements used in healthcare [10]. It also provides formalism services of expressing the detailed clinical models in a series of different granular and computable formalisms.
OpenEHR CKM [11]
The Clinical Knowledge Manager (CKM) is a library of clinical knowledge artifacts, which includes openEHR archetypes and templates. CKM supports the searching, browsing, and detailed information displaying of the archetypes in an integrated platform. Besides, CKM supports the full life cycle management of openEHR archetypes through a review and publication process and provides governance of the knowledge artifacts [12].
caDSR CDE Browser [13]
National Cancer Institute (NCI) [14] develops the Cancer Data Standards Registry and Repository (caDSR) Common Data Element (CDE) Browser. The CDE browser is used for exploring the content of the NCI caDSR. The CDE Browser supports searching, downloading, and sharing of CDEs within or across contexts.
ClinFHIR [15]
ClinFHIR is an integrated work platform on FHIR model. Currently, it has two main components: a resource builder and a profile builder. A resource builder takes the definition of a resource, and allows users to enter data using the resource definition to produce real resource instances. A profile builder allows a resource definition to be customized to a specific use case [16].
In addition to ClinFHIR, there are also a number of other tools that support FHIR model browsing or profiling, such as FHIR Browser [17] and Forge [18]. The FHIR Browser is a FHIR hierarchy and documentation browser developed for the FHIR DSTU Release 1.1,1 which is not well updated to support the latest FHIR version. Node.js was leveraged as the key technology for its web-based browsing solution; in addition, this tool has the limitation of the real-time interaction function and extensibility because the FHIR JSON file preprocessing is needed. Another related tool is Forge, which is a Windows-based desktop application with powerful graphical user interface that allows modelers to easily create, edit, and validate FHIR profiles, extensions, and implementation guides. The Windows.NET2 and the Simplifier.NET3 are the core technologies to facilitate the Forge implementation. As a result, Forge’s advanced functions are not free to use and its open-source availability is limited. These tools have provided great capabilities to help the modelers for learning and manipulating of HL7 FHIR. However, there are still many open research questions that need to be studied given the sophistication of the FHIR models. The tooling features related to these research questions include (1) powerful searching and filtering capability for FHIR browsing; (2) direct integration capability of the visualization browsing/profiling platform connecting with existing FHIR server/endpoint through RESTful service4; (3) predesigned common use cases and customized workflows for quickly facilitating FHIR utilization. The breakthrough of these technological and functional challenges would advance the future utilization of FHIR.
Therefore, the objective of the study is to design, implement, and evaluate a prototype of a visualization tool for the FHIR specification in an integrated platform. Since FHIR is such a sophisticated modeling system that is developed with elaborate implementation details for the support of a wide variety of healthcare scenarios, we currently focused on the study of the interactive browsing and basic manipulation of the FHIR core components, including FHIR resource schemas, profiles, and extensions. Note that we did not intend to develop a comprehensive solution for all aspects of FHIR.
FHIR Resources are the basic building blocks to model healthcare data and support data exchanging and utilization. FHIR also supports an extension mechanism that allows users to restrict/extend the FHIR core resources into profiles for specific implementations. For the tool implementation, FHIR defines its own model structure and representation language. The FHIR models are also represented using the FHIR resources StructureDefinition5 and ElementDefinition6 [19], so it allows the same tools to navigate both FHIR models and their instances, which then enables the tooling reusability. FHIR initially defined two official data representation formats—XML7 and JSON8; the third format—the Resource Description Format (RDF)9 was added in the latest STU3 version. We extended our preliminary work known as Visual FHIR [20], and explored more advanced interaction functions on browsing and profiling the FHIR models in this paper.
Materials
Our solution for visualizing the FHIR models covers three main model components: FHIR resources, profiles, and extensions. The tools that used for our visualization implementation are introduced as follows:
FHIR Resources
A FHIR resource is a small, discrete concept that can be maintained independently, and as the smallest unit of transaction. The core FHIR resources satisfy the majority of common use cases, and represent a wide range of healthcare-related concepts and elements, both clinical and administrative. For example, the Patient resource contains elements: patient name, gender, birthdate, contact, etc. According to the latest FHIR version STU3 (Standard for Trial Use 3) [6], FHIR community has defined 117 Resources and the resource development is still in progress.
FHIR Profiles
FHIR specification is a common platform standard that could be used in many different contexts in healthcare. A FHIR profile allows a particular FHIR resource to be adapted for real-world scenarios, which defines the way the users want to use or exchange the resource. A FHIR profile is a group of Structure Definitions, Value Sets, and examples that are all defined with a common purpose.
FHIR Extensions
With the built-in extension mechanism, the FHIR resource definition sticks to the 80/20 rule, i.e., elements and data types used by 80% of the healthcare implementation are defined in the FHIR data model; all other elements and data types are handled as extensions. In other words, for those contents that are not defined in the FHIR core resources, an extension mechanism is supported. For example, the elements, such as race, ethnicity, organ donor status, and nationality, are defined as extension elements in the FHIR core Patient resource. Extensions work as parts of FHIR profiles to extend the usage and data types of FHIR core resources.
JavaScript Library
We utilized D3.js (Data-Driven Documents) [21] to generate tree graph automatically for FHIR model visualization. D3.js is a JavaScript library that combines powerful visualization and interaction techniques for data-driven visualization. D3.js is advanced in quick response, supporting large datasets and dynamic behaviors for interaction and animation.
HAPI FHIR API
HAPI FHIR API was used in our implementation to support the FHIR profiling validation. HAPI FHIR API is an open-source implementation of the FHIR specification in Java [22]. It defines model classes for each resource type and data type as defined in the FHIR specification. In addition, HAPI FHIR API supports model validation. Therefore, we used the HAPI FHIR API to validate standard FHIR JSON representations after a customized profile is created.
Methods
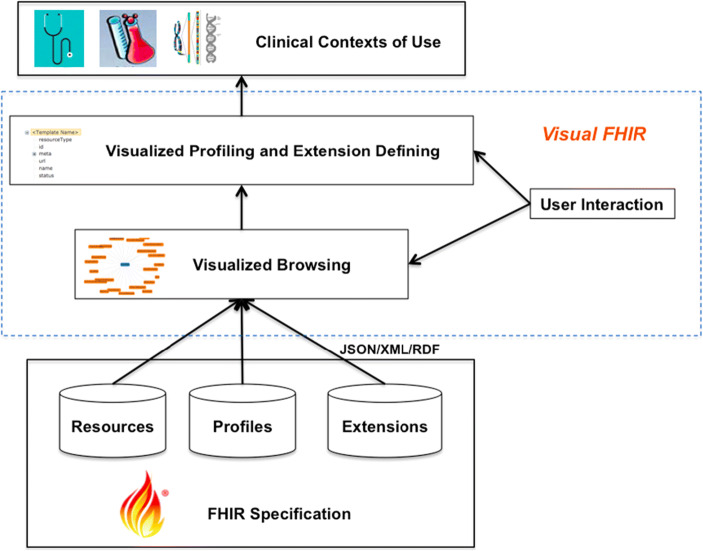
An interactive visualization tool known as “Visual FHIR” was designed to facilitate the navigation and manipulation of the FHIR models. Figure 1 shows the system architecture of our visualization tool.
Fig. 1.
The system architecture of our FHIR model visualization tool
A Prototype Implementation for Browsing a FHIR Resource
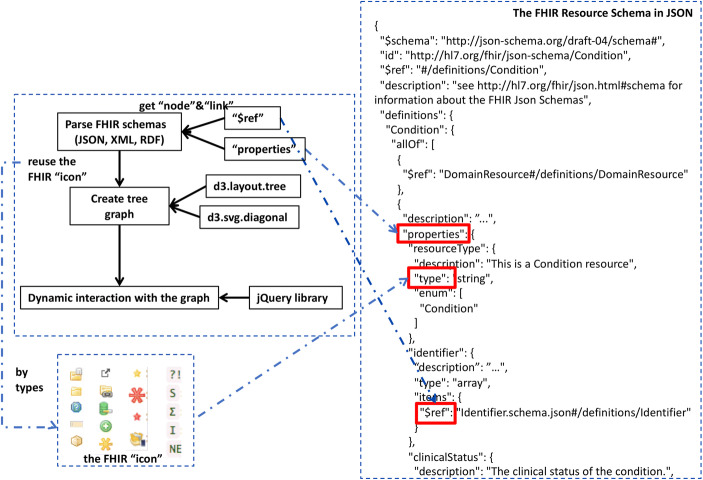
Our implementation method of the FHIR resource browsing is shown in Fig. 2. First, we parsed the schemas of the FHIR resources. All the resources are constrained by specific content structure and the schemas follow the FHIR format standards JSON, XML, and RDF. The FHIR resource schema in JSON contains two types of key elements “$ref” and “properties.” Our method supports the automatic parsing of the schema to get all the URIs which direct a resource to itself or any other FHIR data schema file by following the “$ref” links, and then further to find all the content elements belonging to each FHIR schema file by parsing the “properties.” Next, tree graphs were created for the schemas. The functions d3.layout.tree and d3.svg.diagonal were used to construct the element nodes and relations of a FHIR schema into a collapsible tree [23], which is originally based on the interactive version of Reingold–Tilford algorithm [24]. Furthermore, in order to respect user’s habit and help users understand the model, we keep the same display icons with FHIR HTML, and the node styles are classified in terms of element “type.” Finally, the interactive functions are supported by jQuery library [25].
Fig. 2.
The implementation of the FHIR resource schema browsing
A Prototype Implementation for Browsing a FHIR Profile or Extension
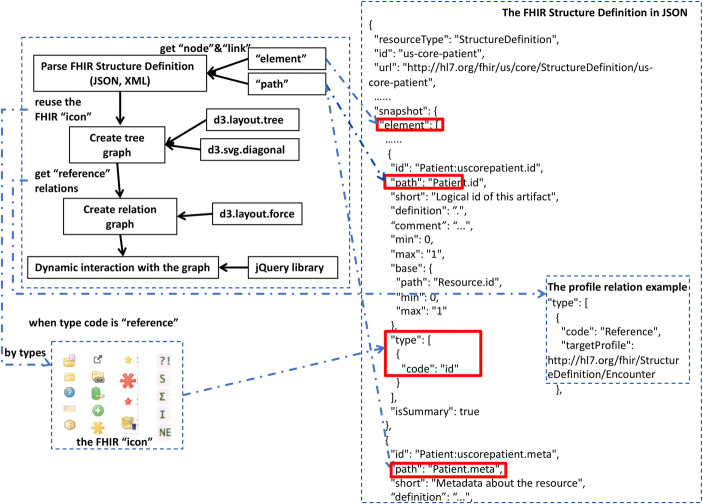
In addition to the FHIR resource schema browsing, our visualization tool includes a module for the FHIR profile and extension browsing as well, which is also supported by D3.js. and jQuery. All the profile and extension definitions are specified using the FHIR resource StructureDefinition [26]. Therefore, the FHIR profile and extension interactive graph were created through parsing the metadata and logic specified in the corresponding StructureDefinition file. Figure 3 shows a flowchart illustrating our implementation method for the FHIR profile and extension browsing. First, our tool automatically parsed the structure of a StructureDefinition file to get all the elements under the node “snapshot,” and the node tree relations were generated through parsing the node property “path.” For the profile visualization, in addition to the tree graph browsing, our tool also supports the display of reference relations between profiles, which are built on the recognition of a particular element type: “reference.” The extension browsing used the same implementation method as both profiles and extensions are represented using the FHIR resource StructureDefinition.
Fig. 3.
The implementation of FHIR profile and extension browsing
A Prototype Implementation for the FHIR Profile and Extension Creation
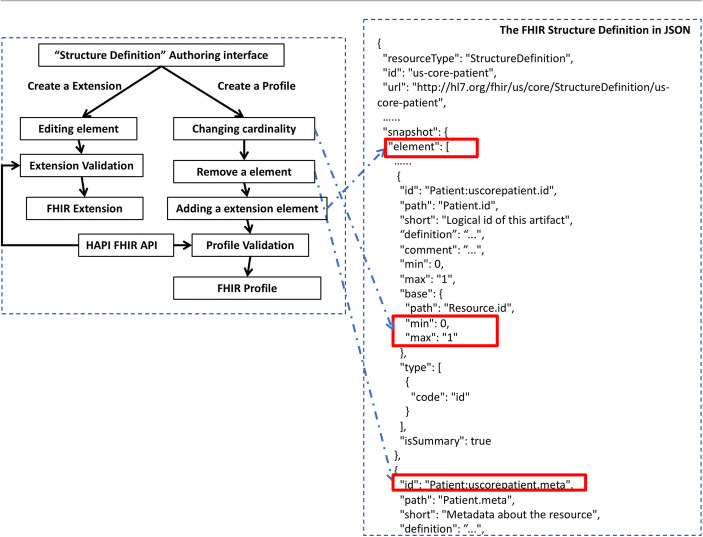
Our visualization tool also enables basic functions for the creation of customized FHIR profiles and user-defined extensions in a specific user context. When using a FHIR resource for a particular use case, its specification usually requires adapting the FHIR resource by a group of rules and restrictions according to a particular context of use [27]. Some particular use cases are common or important enough to be described into reusable profiles and extensions, as a part of the FHIR specification. For example [28], the “Observation-genetics-profile” extends the Observation resource to enable reporting of structured genetic test results, and the “Common extensions for HumanName data type” defines a collection of “common” extensions for use with the “HumanName” data type. There are specific rules that need to conform with when conducting the FHIR profiling [27]: (1) A Profile cannot break the rules established in the base specification; (2) a Profile cannot specify default values or meanings for elements; (3) a Profile cannot give more specific names to elements. In our prototype, we currently only focus on the three basic profiling functions: changing cardinality, removing the elements that not used in the use case context, and adding a use case extension. The use case extension is also supported through our “StructureDefinition” authoring interface, and we currently focused on the implementation of the extension definition for a specific element in a resource. A validation processing is performed using the HAPI FHIR Profile/StructureDefinition validation API [29] to ensure the user-customized extensions and profiles conform to the FHIR specification. Figure 4 shows the key implementation steps of our FHIR profile and extension creation.
Fig. 4.
The implementation of the FHIR profile and extension creation
Evaluation Method
In order to establish the criteria for evaluating our tool “Visual FHIR,” we investigated the current data visualization evaluation methods [30]. Taking into account the FHIR visualization requirements and referring the existing evaluation methods, we designed the evaluation criteria in terms of interactive mechanism and cognitive complexity to demonstrate the utility of the tool.
The measures of the interactive mechanism describe to what extent the visualization system could facilitate to organize, explore, and arrange displayed content. We evaluated the system interactive mechanism using three sub-dimensions: (1) speed of response, (2) navigation and manipulation, and (3) user orientation (Table 1). Furthermore, as a sophisticated model standard, FHIR has a comprehensive knowledge architecture to present, and cognition is defined as the process of knowledge acquisition and reasoning, it is a reasonable goal of visualization to place a burden on users’ cognitive process as small as possible [31]. Therefore, we further measured the cognitive complexity of our tool from three aspects: (1) content expressiveness, (2) learning easiness, and (3) supported display types (Table 1).
Table 1.
Evaluation criteria, objectives, and task examples
| Criteria | Objectives | Task examples | |
|---|---|---|---|
| Interactive mechanism | Speed of response | It measures how quickly the system responds to a request | The response time when a user clicks a resource/profile/extension to display |
| Navigation and manipulation | It reflects the supporting degree of how users select, manipulate, search, and explore the data elements and other related specific information | The function support for a user to search any piece of content of a FHIR model | |
| User orientation | It estimates the user-friendly interactivity | The functions of the support for a user to control the display of the element details, redo/undo of user actions, etc. | |
| Cognitive complexity | Content expressiveness | It reflects the revealed knowledge extent of the FHIR specification | Does the tool support the full content display of a FHIR resource/profile/extension? |
| Learning easiness | It is difficult to acquire full FHIR knowledge in one time; therefore, the Learning easiness here describes how a platform can help users learn the model when needed | Does the tool help the user quickly find the elements they are interested in and return the element-related information? | |
| Supported display types | This criterion reflects how many content display types are supported by the platform | Does the tool support the diverse display types for different content, such as graph, table, and source file? |
Results
To test the performance of the “Visual FHIR,” we used the JSON schemas from FHIR STU3 [32], and the core profiles and extensions released from US Core Implementation Guide (Release 1.0.1) [33].
Implemented Prototype
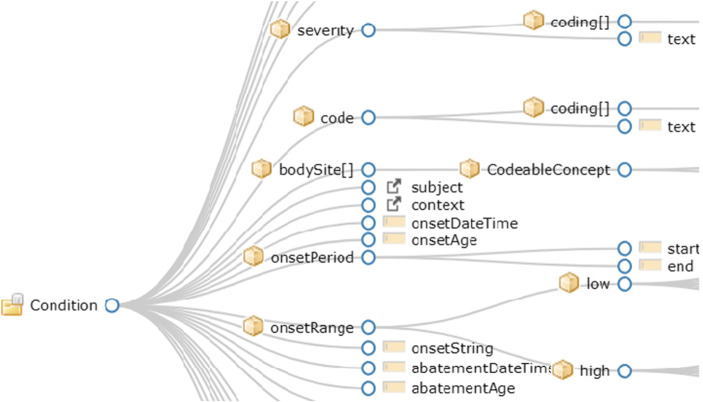
For the interactive browsing perspective, according to our parsing algorithms, the initial JSON schema files and JSON structure definitions are automatically parsed for element display. The browsing examples for the resource schema, profile and extension are shown in Figs. 5, 6, and 7, respectively. Figure 5 shows our visualization graph to support the FHIR resource browsing using the FHIR resource Condition as an example. Conditions are frequently a result of a clinician’s assessment and assertion of a particular aspect of a patient’s state of health, such as clinician’s diagnosis, exposure to communicable disease, and patient having had coronary bypass graft.10 The detailed resource content and element hierarchy defined by FHIR are interactively displayed in the diagram. This visualization interface shows a collapsible and tidy arrangement of node-link diagrams, which could be triggered by the interactions from a user.
Fig. 5.
The FHIR resource browsing (using the FHIR resource Condition as an example)
Fig. 6.
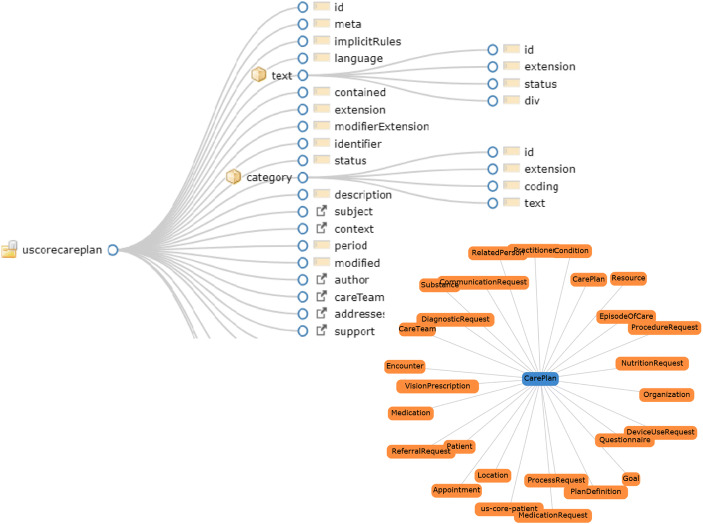
The FHIR profile and resource relations browsing (using the FHIR profile us-core-careplan as an example)
Fig. 7.
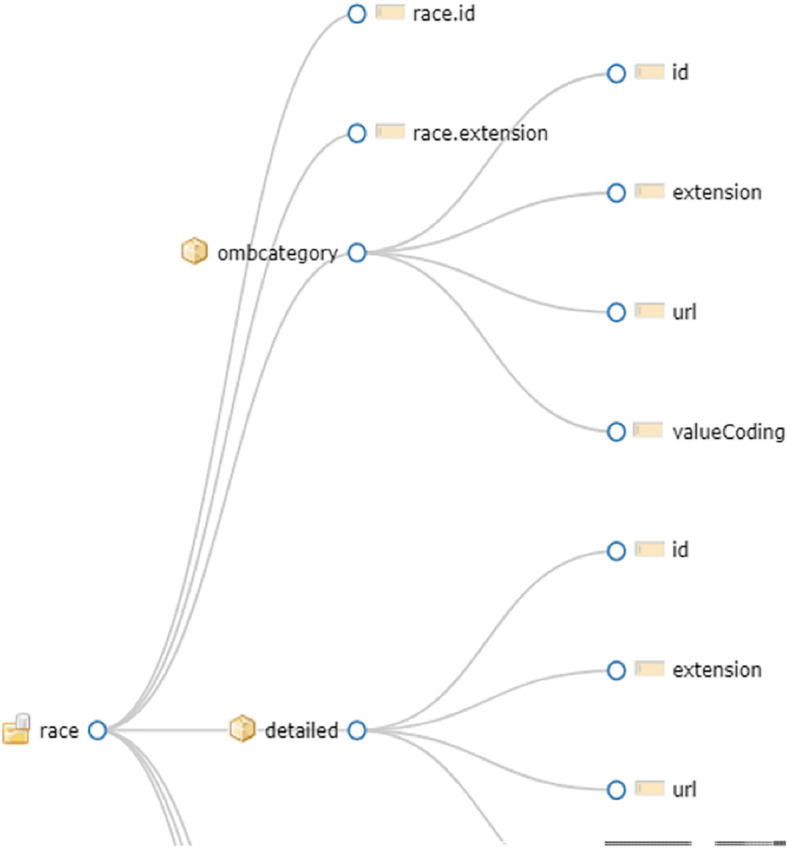
The FHIR extensions browsing (using the FHIR extension us-core-race as an example)
In addition to displaying content elements and tree hierarchy, the profile reference relations are also displayed in a direct relation graph to help users understand the relations between FHIR resources and elements. For example, the profile us-core-careplan11 has a collection of reference relations with the resources Patient, Condition, CareTeam, MedicationRequest, etc., as shown in Fig. 6. As an important part of a FHIR model, the FHIR extension browsing is also supported (an example extension us-core-race12 is displayed in Fig. 7). The above visualization interfaces for the browsing support can be generalized to be applied to all the standard FHIR resources, profiles, and extensions.
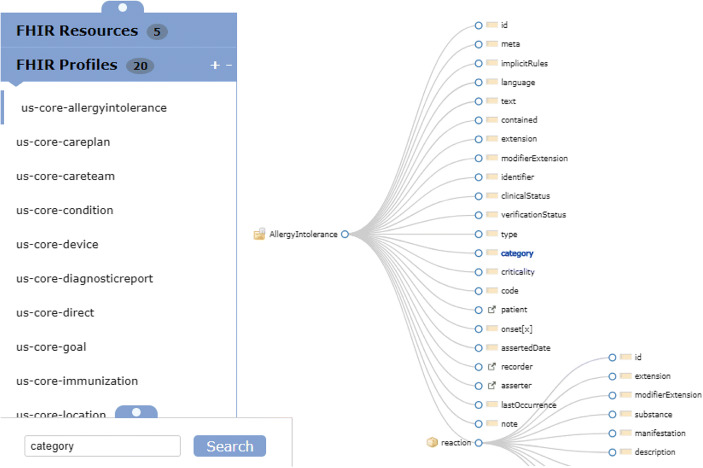
The node navigation and search functions are also supported, as shown in Fig. 8. A user can explore the FHIR model by dragging and clicking the node. The sub-tree structures collapse and expand through a user’s clicking of each node; when clicking the node name, a detailed description/definition of each FHIR element is displayed at the right side of the layout, including a structured summary table and a JSON source file. When users click to load a new resource/profile/extension, the initial JSON schema tree graph will be replaced by the new JSON schema tree graph directly. When users input an element name that they would like to search for, the search function is also supported and the target node will be located in the center of the layout with highlighted blue color.
Fig. 8.
The navigation and search functions
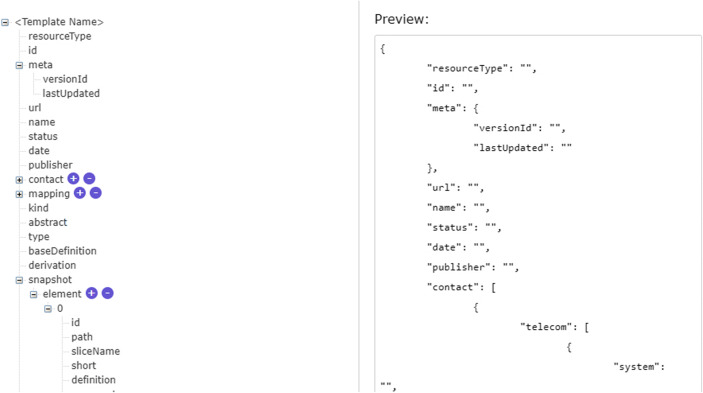
In our prototype, we also implemented preliminary functions for the FHIR profile and extension creation. The profile authoring interface is shown in Fig. 9. The use case extension creation uses the similar interface as profiling since they both conform to the FHIR StructureDefinition resource. The only difference is the user manipulation restriction. Under the extension creation module, a user could edit the element details to customize an extension. However, the user could only add extension elements or remove non-required elements, and change the element cardinality when the user customizes a profile. The user-defined extensions could be flexibly included in a FHIR profile. Customized profiles are managed as context-specific templates that could be combined and reused in future clinical scenarios.
Fig. 9.
The authoring interface for FHIR profiling
Evaluation Results
Three group members of this study conducted a preliminary evaluation of the prototype using 6 criteria as previously described. We used a 4-rating scale to remark the performance (4, Excellent; 3, Good; 2, Fair; 1, Poor). Table 2 shows the evaluation results.
Table 2.
Evaluation results of the “Visual FHIR”
| Criteria | Participant A | Participant B | Participant C | |
|---|---|---|---|---|
| Interactive mechanism | Speed of response | 3 | 3 | 4 |
| Navigation and manipulation | 3 | 3 | 3 | |
| User orientation | 2 | 3 | 4 | |
| Cognitive complexity | Content expressiveness | 4 | 2 | 3 |
| Learning easiness | 4 | 3 | 3 | |
| Supported display types | 3 | 4 | 3 |
Discussion
In this study, we have implemented a prototype that supports the FHIR model browsing and profiling using visualization techniques via D3.js. Considering the sophistication of the FHIR model, we have not completed all the model visualization tasks on the current stage. The overall results are positive from our preliminary testing and evaluation, though we noticed a number of limitations as follows.
The first limitation is about the model navigation and manipulation. The user selection of a node is a main interaction feature. It can be applied to any node in order to bring out the details of the node. The basic searching and querying for a specific node are supported as well, which help a user handle the model efficiently. However, more advanced features like the FHIR profiling and authoring interface have not been fully completed in our current implementation. Profiling is a complete course that contains many necessary procedures. In addition to the resource element adapting and cardinality changing as implemented in our prototype, there are still many advanced profiling functions we have not covered. These advanced functions include adding additional FHIR operations and search parameter, changing coded value set and terminology binding, concept mapping, and profile registering. Our current implementation on the FHIR profiling can only be considered as a preliminary exploration, and advanced profiling functions will be added in our future study.
The second limitation is regarding the user orientation. The user-friendliness needs to be further improved according to the evaluation feedback. Although our tool improves the model browsing through fast navigation and query, for a new model learner, more guiding information would be expected to help understand the FHIR model as these models are quite sophisticated.
For the evaluation, we have developed metrics to assess the usability of our visualization tool focusing on the interactive mechanism and the cognitive complexity. Most of the feedback from the three participants are positive, scoring on 3, Good, or 4, Excellent, except for a scoring of 2, Fair, on the User orientation from participant A and a scoring of 2, Fair, on the content expressiveness from participant B. We have followed up with participants A and B for their feedback on the fair scoring. From participant A, we received some suggestions on improving user orientation for the reason that different users may see the model from different perspectives. Specifically, it is expected to improve our visualization tool through establishing different user scenarios to satisfy the needs of different users, including patients, developers, and researchers. In addition, participant B indicated that the users who have the background knowledge of clinical data modeling would benefit from our visualization tool, and it is expected to display more details of the model elements for new model learner. As the next step, we plan to incorporate detailed FHIR model knowledge to the tool design and improve our design framework to balance the content expressiveness and visualization simplicity. Note that the evaluation work is conducted in a relatively small group, which is the third limitation of our study. In the future, we plan to conduct more rigorous evaluation by recruiting more evaluators with more elaborate evaluation criteria [34].
Conclusion
We have presented our visualization study on navigating and utilizing the HL7 FHIR specification by designing and prototyping a visual browser to support users’ interactions with the FHIR models. The platform currently supports basic browsing and authoring functions in viewing the FHIR model elements through a navigation tree with interactive features. The user interface usability and expressiveness have been inspected in a preliminary evaluation, and the results demonstrated that our visualization tool provides a user-friendly interface to support users’ interactions with the FHIR specification for model exploration and manipulation. We expect our visualization work could provide users an open-source solution to better explore, interpret, and utilize the FHIR specification.
Funding Information
This study is supported in part by NIH grants U01 HG009450, the Mayo Clinic Center for Clinical and Translational Science grant (UL1TR002377), and the National Library of Medicine grant (5K01LM012102).
Compliance with Ethical Standards
Conflict of Interest
All the authors declare that there are no conflicts of interest related to this article.
Footnotes
Publisher’s Note
Springer Nature remains neutral with regard to jurisdictional claims in published maps and institutional affiliations.
Resources available:
Publisher’s Note
Springer Nature remains neutral with regard to jurisdictional claims in published maps and institutional affiliations.
References
- 1.Health level seven (HL7). http://www.hl7.org/. Accessed Dec. 2017
- 2.The Observational Health Data Sciences and Informatics (OHDSI). https://ohdsi.org/. Accessed Dec 2017
- 3.Patient-Centered Outcomes Research Institute (PCORI). https://www.pcori.org/. Accessed Aug. 2018
- 4.Richesson RL, Krischer J. Data standards in clinical research: gaps, overlaps, challenges and future directions. J Am Med Inform Assoc: JAMIA. 2007;14(6):687–696. doi: 10.1197/jamia.M2470. [DOI] [PMC free article] [PubMed] [Google Scholar]
- 5.Decker C (2010) The past, present, and future of clinical data standards. In: SAS Global Forum 2010 Conference. Seattle, WA, USA, p. 14
- 6.The HL7 Fast Healthcare Interoperability Resources (FHIR) https://www.hl7.org/fhir/index.html. Accessed Dec. 2017
- 7.Bender D, Sartipi K (2013) HL7 FHIR: an agile and RESTful approach to healthcare information exchange. In: Computer-Based Medical Systems (CBMS), 2013 IEEE 26th International Symposium on 2013, pp. 326–331. IEEE
- 8.(2017) FHIR: guide to resources https://www.hl7.org/fhir/resourceguide.html. Accessed Aug. 2017
- 9.IntermountainHealthcare: CIMI Browser. http://www.clinicalelement.com/cimi-browser/- /. Accessed Dec. 2017
- 10.(2013) CEM browser user guide - clinical element models. http://www.clinicalelement.com/partials/user-guide.html. Accessed Dec 2017
- 11.openEHR: openEHR Clinical Knowledge Manager. http://www.openehr.org/ckm/. Accessed Dec. 2017
- 12.(2017) OpenEHR clinical information models, Clinical Knowledge Manager. https://openehr.atlassian.net/wiki/display/healthmod/Clinical+Knowledge+Manager. Accessed Dec 2017
- 13.caDSR CDE browser. https://cdebrowser.nci.nih.gov/cdebrowserClient/cdeBrowser.html. Accessed Dec. 2017
- 14.National Cancer Institute (NCI). https://www.cancer.gov/. Accessed Dec. 2017
- 15.clinFHIR. http://clinfhir.com/. Accessed Jan. 2018
- 16.Hay D Clinfhir wiki. https://clinfhir.atlassian.net/wiki/spaces/CLIN/overview. Accessed Jan. 2018
- 17.Gottlieb D FHIR resource browser. http://gotdan.github.io/fhirbrowser/index.html. Accessed Dec. 2017
- 18.firely: Forge. http://fire.ly/forge/. Accessed Dec. 2017
- 19.Solbrig HR, Hong N, Jiang G (2018) Automated population of an i2b2 clinical data warehouse using FHIR. AMIA Annu Symp [PMC free article] [PubMed]
- 20.Hong, N., Wang, K., Yao, L., Jiang, G. (2017) Visual FHIR: an interactive browser to navigate HL7 FHIR specification. In: Healthcare Informatics (ICHI), IEEE International Conference on 2017, pp. 26–30. IEEE
- 21.(2017) D3, Data-Driven Documents https://d3js.org/.
- 22.HAPI FHIR. http://hapifhir.io/. Accessed Mar. 2017
- 23.D3.js Collapsible Tree. http://bl.ocks.org/robschmuecker/7880033. Accessed Dec. 2017
- 24.Reingold EM, Tilford JS. Tidier drawings of trees. IEEE Trans Softw Eng. 1981;SE-7(2):223–228. doi: 10.1109/TSE.1981.234519. [DOI] [Google Scholar]
- 25.jQuery JavaScript Library. http://api.jquery.com/. Accessed Dec. 2017
- 26.FHIR Resource: StructureDefinition. https://www.hl7.org/fhir/structuredefinition.html. Accessed Dec. 2017
- 27.(2017) Profiling FHIR. https://www.hl7.org/fhir/profiling.html. Accessed Dec 2017
- 28.(2017) Profiles defined as part of FHIR. https://www.hl7.org/fhir/profilelist.html. Accessed Dec 2017
- 29.HAPI FHIR Profile/StructureDefinition validation. http://hapifhir.io/doc_validation.html. Accessed Dec. 2017
- 30.Luzzardi PR, Cava RA, Winckler, MA, Pimenta MS, Nedel LP (2002) Evaluating usability of information visualization techniques.
- 31.Anderson EW (2012) Evaluating scientific visualization using cognitive measures. In: the 2012 BELIV Workshop: Beyond Time and Errors-Novel Evaluation Methods for VisualizationBELIV, vol. 10.1145, p. 2442576.2442581
- 32.FHIR download. http://hl7.org/fhir/downloads.html. Accessed Dec. 2017
- 33.US core implementation guide (release 1.0.1) http://hl7.org/fhir/us/core/profiles.html. Accessed Dec. 2017
- 34.Sharma DK, Peterson KJ, Hong N, Jiang G. The D2Refine platform for the standardization of clinical research study data dictionaries: usability study. JMIR Hum Factors. 2018;5(3):e10205. doi: 10.2196/10205. [DOI] [PMC free article] [PubMed] [Google Scholar]


