

Abstract
Skeletal muscle has a nonconventional Golgi complex (GC), the organization of which has been a subject of controversy in the past. We have now examined the distribution of the GC by immunofluorescence and immunogold electron microscopy in whole fibers from different rat muscles, both innervated and experimentally denervated. The total number of GC elements, small polarized stacks of cisternae, is quite similar in all fibers, but their intracellular distribution is fiber type-dependent. Thus, in slow-twitch, type I fibers, ∼75% of all GC elements are located within 1 μm from the plasma membrane, and each nucleus is surrounded by a belt of GC elements. In contrast, in the fast-twitch type IIB fibers, most GC elements are in the fiber core, and most nuclei only have GC elements at their poles. Intermediate, type IIA fibers also have an intermediate distribution of GC elements. Interestingly, the distribution of microtubules, with which GC elements colocalize, is fiber type-dependent as well. At the neuromuscular junction, the distribution of GC elements and microtubules is independent of fiber type, and junctional nuclei are surrounded by GC elements in all fibers. After denervation of the hindlimb muscles, GC elements as well as microtubules converge toward a common pattern, that of the slow-twitch fibers, in all fibers. Our data suggest that innervation regulates the distribution of microtubules, which in turn organize the Golgi complex according to muscle fiber type.
Keywords: acetylcholine receptor, endoplasmic reticulum, flexor digitorum brevis, Golgi complex, neuromuscular junction, red gastrocnemius, trans-Golgi network, tensor fascia latae
During development, skeletal muscle fibers diversify into at least four major types (I, IIA, IIB, and IIX) based on the myosin heavy chain isoform they express. They also differ in their speed of contraction, type of metabolism, fatigue resistance, and other properties (Schiaffino and Reggiani, 1996). Some aspects of this regulation are relatively well understood. For example, it is known that the expression of specific isoforms of several protein families (myosin heavy and light chains, troponins, Ca2+ ATPases) is regulated by activity at the level of transcription (for review, see Buonanno and Fields, 1999).
There also are a number of observations regarding fiber type-dependent differences in subcellular organization of mitochondria (Gauthier and Padykula, 1966; Eisenberg, 1983), T-tubules (Luff and Atwood, 1971), sarcoplasmic reticulum (Franzini-Armstrong, 1994), and in the nucleocytoplasmic ratio (Schmalbruch, 1985). To what degree other elements of muscle subcellular organization are fiber type-dependent and how these differences are regulated is not known.
In the present study, we asked whether the organization of the Golgi complex is fiber type-dependent. The GC is the strategic cell center for membrane protein trafficking. Its distribution in a giant cell such as a muscle fiber may determine the organization of the subcellular membrane systems. Skeletal muscle is one of several cell types that do not have a conventional GC. In undifferentiated myoblasts, the GC is a compact organelle resembling that of other dividing mammalian cells, but during muscle differentiation, the GC reorganizes into a network of smaller elements (Tassin et al., 1985a,b). What happens to the GC in the later stages of myogenesis has been controversial. Whereas some papers claimed that the GC disappears from the extrajunctional part of the fibers but is reexpressed after denervation (Jasmin et al., 1989,1995; Antony et al., 1995), others reported that GC markers are found along innervated rat muscle fibers in a pattern similar to that of myotubes (Ralston, 1993; Rahkila et al., 1996, 1997; Ploug et al., 1998). At the neuromuscular junction (NMJ), the GC organization was proposed to be similar to that of undifferentiated cells (Jasmin et al., 1989), to that of myotubes (Ralston, 1993; Ralston and Ploug, 1996), or different from both (Rahkila et al., 1997). By an interesting coincidence, nearly each of these studies focused on a different muscle, each predominantly containing one different fiber type. Therefore, we reasoned that fiber type-related differences might be the cause of some of the discrepancies and decided to reexamine the distribution of GC markers in muscles with different fiber type composition and their changes after denervation. We have used antibodies to proteins of the cis-, medial-, andtrans-GC to stain whole fibers from the rat soleus, tensor fasciae latae (TFL), and red gastrocnemius (RG) muscles for immunofluorescence and immunogold electron microscopy (EM). We now report that the distribution of the GC is, indeed, fiber type-dependent, as is the distribution of the microtubule cytoskeleton. Furthermore, we find that denervation results in the convergence of the patterns.
MATERIALS AND METHODS
Antibodies and reagents. A rabbit antibody against the cis-Golgi protein GM130 (Nakamura et al., 1996) was donated by Drs. N. Nakamura and G. Warren (Imperial Cancer Research Fund, London, UK); a mouse monoclonal antibody against GM130 was later purchased from Transduction Laboratories (Lexington, KY). Mouse hybridoma supernatants against the medial-Golgi protein MG160 (Gonatas et al., 1989, 1995; Mourelatos et al., 1995) were a gift from Dr. N. Gonatas (University of Pennsylvania, Philadelphia, PA), and hybridoma supernatants against the trans-Golgi network (TGN) protein TGN38 (2F7.1; Horn and Banting, 1994) were a gift from Dr. K. E. Howell (University of Colorado, Denver, CO). The mouse monoclonal anti-α-tubulin DM1a was initially received from Dr. S. Doxsey (University of Massachusetts, Worcester, MA) and later purchased from Sigma (St. Louis, MO). Rabbit antibodies against Tyr-, Glu-, and Δ2-tubulin (Sato et al., 1997) were a gift from Dr. G. Cooper IV (Veterans Administration Medical Center, Charleston, SC). The rabbit anti-GLUT4 antibody P-1 has been described previously (Ploug et al., 1998). A mouse anti-SR Ca2+ATPase I was purchased from Affinity Bioreagents (Golden, CO). Hybridomas BA-D5, BF-F3 (Schiaffino et al., 1989), and SC-71 (Bottinelli et al., 1991), which produce antibodies specific for myosin heavy chain I, IIB, and IIA, respectively, were obtained from the American Type Culture Collection (Rockville, MD). We did not distinguish type IIB from type IIX fibers; the fibers we refer to as type IIB presumably contain IIB and IIX fibers (Schiaffino et al., 1986). Texas Red-conjugated α-bungarotoxin was purchased from Molecular Probes (Eugene, OR). Fluorescently labeled secondary antibodies were purchased from Organon-Teknika (Durham, NC); biotinylated secondary antibodies and fluorescently labeled avidin were purchased from Pierce (Rockford, IL), and nanogold-conjugated secondary antibodies as well as silver enhancement kits were purchased from Nanoprobes (Stony Brook, NY). Hoechst 33342 (bis-benzimide) was purchased from Sigma.
Single muscle fiber preparations. All fibers were prepared from adult Wistar rats (∼350 gm) obtained either from Taconic (Germantown, NY) or from the Animal Breeding Facility at the Panum Institute. Muscles were either dissected from animals that had been fixed by perfusion as described in Ploug et al. (1998) or were removed immediately after killing with CO2 and pinned to a Sylgaard-coated dish for fixation with 2% depolymerized paraformaldehyde (Electron Microscopy Sciences, Fort Washington, PA) for 1 hr. After several rinses in PBS, small bundles of one to three fibers were obtained by manual teasing with fine forceps. Each staining was repeated at least four times in independent experiments.
Denervation experiments. A 1 cm section of the sciatic nerve was resected from one hindleg of animals anesthetized with ether. Five days after the operation, the animals were killed and fixed by perfusion. Fibers from the denervated and from the contralateral control muscle were prepared as described above. These experiments were done twice.
Cryostat sections and staining. A piece from the middle part of a muscle was mounted in Tissue Tek (Miles, Elkhart, IN) and rapidly frozen by immersion in liquid nitrogen-cooled isopentane. Ten-micrometer-thick transverse or longitudinal sections cut at −22°C were placed on glass slides. Blocking of nonspecific binding was done by incubating with 50 mm glycine and 0.25% bovine serum albumin in PBS for 15 min followed by primary antibody incubation in the same buffer for 90 min. After three washes, sections were incubated for 45 min with fluorescein isothiocyanate (FITC)-conjugated goat anti-rabbit F(ab)2 fragments (Sigma) diluted 1:250 in blocking buffer. Sections were mounted in Vectashield (Vector Laboratories, Burlingame, CA).
Staining whole fibers for immunofluorescence and immunogold EM. Fibers were transferred to 50 mm glycine, 0.25% bovine serum albumin, 0.04% saponin, and 0.05% sodium azide in PBS for blocking and permeabilization for 30 min, after which they were incubated overnight with the primary antibody diluted in blocking buffer supplemented with 200 μg/ml goat IgG. After three washes of 30 min each in PBS–0.04% saponin, they were incubated for 2 hr with FITC-conjugated goat anti-rabbit F(ab)2 fragments (Sigma) diluted 1:250 in blocking buffer. For double-labeling, biotin-coupled goat anti-mouse IgG was added (1:500) followed, after three washes, by Texas Red-conjugated streptavidin and Hoechst 33342 (0.5 μg/ml) in blocking buffer. Fibers were mounted in Vectashield on a glass slide.
A detailed protocol for the immunogold staining has been given in Ploug et al. (1998). Briefly, the secondary antibody was goat anti-rabbit Fab fragments conjugated to 1.4 nm gold clusters (Nanogold), diluted 1:300 in blocking buffer. Silver enhancement (HQ Silver) was performed for 6 min, after which the fibers were treated with 0.5% osmium tetroxide, 2% uranyl acetate in 50% acetone, dehydrated in a graded series of acetone, and embedded with epoxy resin Polybed 812 (Polysciences, Warrington, PA). Silver–gold interference-colored sections, poststained with aqueous lead citrate, were examined in a JEOL 1200 microscope at 60 kV.
Microscopy and image analysis. Conventional microscopy was done with a Leica (Deerfield, IL) DMRD microscope. Photographs were taken on Kodak (Eastman Kodak, Rochester, NY) T-Max 400 film, and the negatives were scanned with an Agfa Arcus II flatbed scanner. Digital images were collected with a Sensys CCD camera (Photometrics, Tucson, AZ). Images were adjusted for contrast with Photoshop 5.0 and printed from a Power MacIntosh computer on a Pictrography 3000 digital printer (Fuji, Elmsford, NY). Confocal images were obtained on a ZeissLSM 410 at the NINDS Light Imaging Facility. Images were transferred to a MacIntosh computer and analyzed with NIH Image (written by W. Rasband at the United States National Institutes of Health and available from the Internet at http://rsb.info.nih.gov/nih-image/).
To calculate the distribution of Golgi elements between the surface and the core of the fibers (Table 1), Z-series of 10 optical sections, 500 pixels long by 300 pixels wide and 1 μm apart, were recorded with a 63× NA 1.4 lens. At this magnification, each section has an area of 6000 μm2 or a volume of 6000 μm3. The first image was focused on the nuclei at the surface of the fiber and was stored on its own (surface image). The subsequent images, each 1 μm deeper inside the fiber, were combined by maximal projection, and the resultant single image (core image) was stored. We verified that this sampling and projection scheme, in which the brightest (maximum) value is kept for each pixel of the image were adequate to include all the surface and core elements. Each image, surface or core, was inverted, thresholded, binarized, and measured in two ways: (1) the number of particles was calculated to determine the number the Golgi elements and (2) the total surface of black pixels was calculated to measure the total surface of the Golgi elements. The results for the core images were divided by the number of sections that had been projected. For both surface and core, the results were divided by the volume of the optical section expressed in cubic micrometers to obtain the unit staining density. To measure the dimensions of the fiber, focus was moved from the top to the bottom surface of the fiber, identified by the immunofluorescent staining pattern, and the Z displacement, corresponding to the thickness of the fiber, was noted. Focus was then moved to the midbelly position, and the width of the fiber was measured with the functions/measure menu item of the Zeiss LSM software. We assumed that the fiber section was elliptical. The total volume,Vt, of a segment of fiber was calculated as Vt = π t w l, where t is the thickness of the fiber divided by 2, w is its width divided by 2, andl is the length of fiber (arbitrarily 100 μm). To calculate the core volume, Vc, we subtracted 1 μm from t and w, because we had observed that for most fibers the surface pattern was entirely contained in the first 1-μm-thick optical section. The surface volume,Vs, was calculated asVs =Vt −Vc. The total number of Golgi elements at the surface of the fiber was calculated as the product of the unit staining density at the surface by the volume of the surface layer, Vs. The same was done for the core of the fiber and the results added to produce the total number of Golgi elements for a fiber segment.
Table 1.
Distribution of Golgi complex elements between surface and core of fibers from the soleus (SOL) and tensor fascia latae (TFL) muscles
| SOL | TFL | SOL/TFL | ||
|---|---|---|---|---|
| GC elements at fiber surface | Number of elements per 1000 μm2 | 38.3 ± 6.2 (n = 27) | 10.0 ± 3.4 (n = 14) | 3.8 |
| Number of elements around each nucleus | 13.2 ± 1.9 (n = 22) | 2.2 ± 0.5 (n = 26) | 6.5 | |
| GC elements in fiber core | Number of elements per 1000 μm3 | 1.7 ± 0.4 (n = 16) | 2.6 ± 0.8 (n = 15) | 0.6 |
| Fiber dimensions | Fiber cross-section (μm2) | 1480 | 2920 | 0.5 |
| Number of nuclei per 100 μm fiber length | 9.0 ± 3.0 (n = 18) | 13.9 ± 2.2 (n = 13) | 0.7 | |
| Cell volume per nucleus (μm3) | 16,444 | 21,007 | 0.8 | |
| GC estimates for a 100-μm-long fiber segment | Number of elements on the surface Number of elements on the surface (%) | 646 74 | 258 27 | 2.5 |
| Number of elements in the core Number of elements in the core (%) | 223 26 | 692 73 | 0.3 | |
| Total | 869 | 950 | 0.9 | |
| Total per nucleus | 96 | 68 | 1.4 |
Z-series of confocal images, each consisting of 10 images starting at the surface of the fiber, were recorded for each muscle (see Materials and Methods). The surface pattern was represented by the first image of each series, and the number of elements around each nucleus was counted from these images. The core pattern was represented by the maximum projection of the nine other images. The images were quantitated with NIH Image software. We used the “particle counting” function to count the number of GC elements. For core images, the result was divided by 9 to obtain the number of elements per single optical section. We used the confocal software to measure the dimensions of the fibers, which allowed us to calculate their cross-sectional area. The number of myonuclei was counted separately, by examining fibers double-stained with Hoechst and with anti-GLUT4 (see Materials and Methods for details). The numbers provided represent the mean, ± SD when appropriate. Similar results (±10%) were obtained when we measured the surface of the Golgi elements rather than their numbers, indicating that the average size of an element is conserved within fibers and between different muscles.
To calculate the number of myonuclei per fiber length unit, fibers stained for GLUT4 and counterstained with Hoechst 33342 were observed with a 25× objective in the Leica DMRD. Each field of view, measured with a graticule, was 440-μm-wide. Hoechst staining shows all the nuclei, whereas GLUT4 labels myonuclei only. The microscope filter magazine was switched from blue (Hoechst) to green (GLUT4) to ensure that only myonuclei were counted in a total of 20 fields per fiber type.
Measurements of the average length of Golgi cisternae were done from photographic prints of electron micrographs resulting from at least four independent experiments.
RESULTS
The immunofluorescence pattern of proteins of the Golgi complex is fiber type-specific
When fibers from the soleus muscle are stained for GM130, a bona fide protein of the cis-Golgi, we observe, at the surface of the fibers (Fig. 1A, left panel), a perinuclear belt around each nucleus plus dots between the nuclei. In the core of the fibers (right panel), we observe stretches of dots. This is the same pattern as we previously reported for the glucose transporter GLUT4 (Ploug et al., 1998). The soleus muscle of adult rats is one of the most homogeneous muscles, with 85% or more of type I (slow-twitch) fibers (Armstrong and Phelps, 1984). When we examine fibers from the RG, a muscle that contains type I, IIA, and IIB fibers, a few fibers (Fig. 1b; 2 of 40, or 5%) show a pattern similar to that seen in the soleus. In other fibers, the perinuclear staining is less prominent (Fig. 1c; ∼67% of fibers), or restricted to the poles of the nuclei (Fig. 1d; ∼27% of fibers), and the core staining is not arranged in stretches (Fig. 1c,d, right panels). These patterns are also observed in fibers stained for MG160, TGN38, or GLUT4 (data not shown). When fibers are simultaneously stained with two of these antibodies, each GC element is stained with both (Ploug et al., 1998; data not shown).
Fig. 1.

Different staining patterns are observed in different fibers of a mixed muscle stained with an antibody to a Golgi complex protein. Single fibers were prepared from rat soleus (a) or red gastrocnemius (b–d) and stained with anti-GM130. Images, focused at the surface of the fibers (left panels) or 5- to 6-μm-deep in the core of the fibers (right panels) were collected with a conventional fluorescence microscope. Insets give an enlarged view of a single nucleus (left) or of an equivalent area in the core (right).Arrows point to the position of nuclei (a–c) or of nuclear poles (d).Filled arrowheads point to the Golgi complex of nonmuscle cells, and open arrowheads to stretches of staining in the core of fibers. The dark channels that can be seen at the surface of the fibers in a and ccorrespond to the position of blood vessels. Notice that the RG fiber shown in b has a pattern very similar to that in the soleus, both at the surface and in the core of the fiber. Fibers shown in c and d present a different pattern in which nuclei are not highlighted by the staining. Scale bar, 50 μm.
The total length of the teased fibers reaches 1 cm. We find that the staining pattern is constant from one end of the fiber to the other, with the exception of the NMJ, which will be discussed separately. However, there are some subtle variations along the fiber, as seen in higher magnification photographs of type I fibers (Fig.2): the number of elements surrounding each nucleus is variable, and ∼44% of the nuclei (n= 163) show some staining immediately above and below the nucleus (Fig.2, top panel), whereas others just show a belt in a plane parallel to the fiber surface. Finally, staining resembling the compact Golgi complex of nonmuscle cells is occasionally found next to a nucleus at the surface of the fibers (Fig. 1a,c, arrowheads). These nuclei are not stained with anti-GLUT4 (Fig. 2,bottom panel). Because GLUT4 is only expressed in muscle, whereas the other Golgi markers are present in all cell types, these results show that the compact staining belongs to nonmuscle nuclei (fibroblasts, endothelial cells, Schwann cells, etc.), which remain associated with the muscle fibers during their preparation.
Fig. 2.

At higher magnification, variability in the Golgi complex staining pattern can be observed. Fibers from soleus muscles were double-stained with MG160 (mg) and GLUT4 (gt) and observed with a conventional fluorescence microscope. Top panel shows the MG160 staining at the surface of a fiber. Notice that some nuclei only show staining in the equatorial plane, whereas others (arrows) show staining above and below as well. In thebottom panel, also focused on the surface of a fiber, we observe three nuclei, visualized by Hoechst staining (h). Two of them (arrowheads) show perinuclear staining for both MG160 and GLUT4. The third nucleus (arrow), has a very localized and strong MG160 labeling, but no GLUT4 labeling, which identifies it as a nonmuscle nucleus, associated with, but outside of the muscle fiber. Scale bars, 10 μm.
It seems likely that those fibers in the RG with a soleus-like pattern are type I, as are the majority of soleus fibers. Fibers were stained for the sarcoplasmic reticulum Ca2+-ATPase of type II fibers (SERCAI) (Wu and Lytton, 1993). RG fibers with a soleus-like pattern were negative for SERCAI, as expected for type I fibers (Fig. 3). To distinguish type IIA from type IIB fibers, we resorted to unfixed or very lightly fixed longitudinal cryostat sections, double-stained for GLUT4 and either MHC I, IIA, or IIB, because antibodies to specific isoforms of the myosin heavy chain did not work on the extensively fixed whole fibers. For each section stained, we counted the number of GLUT4 perinuclear patterns and noted whether they were in a fiber positive for the MHC antibody. In sections stained for type I MHC, 15 of 28 GLUT4 perinuclear profiles (54%) were in MHC I-positive fibers. In sections stained for type IIA MHC, 11 of 19 profiles (59%) were in MHC IIA-positive fibers, whereas in type IIB-stained sections, none of 20 GLUT4 perinuclear profiles were found in MHC IIB-positive fibers. These results demonstrate that the pattern observed in Figure 1dcan be attributed to type IIB fibers.
Fig. 3.

The red gastrocnemius fibers with distinct perinuclear Golgi complex staining are type I. RG fibers were double-stained for GLUT4 (gt) and SERCA1 (srca), the Ca2+ ATPase of type II fibers. Two fibers are shown. One (arrow) is positive for SERCA1, which identifies it as a type II fiber. It has no distinct perinuclear pattern for GLUT4 on its surface. The other fiber (arrowhead), which is negative for SERCA, shows a distinct perinuclear GLUT4 staining. Scale bar, 50 μm.
Further confirmation was obtained by staining fibers prepared from the TFL, a muscle in which ∼90% of the fibers are type IIB (Armstrong and Phelps, 1984). All fibers showed a pattern similar to that observed in Figure 1d. To quantitate these pattern differences, Z-series of confocal images were recorded from soleus and TFL muscle fibers stained with anti-MG160. Figure 4illustrates the striking differences in surface pattern (Fig. 4,top panels). The depth cue coloring of one Z-series projection for each muscle (Fig. 4, bottom panels) suggests that surface staining dominates the total staining in type I fibers but not in type IIb fibers. It also shows that the core staining occurs in discrete stretches in the soleus, but is more randomly distributed in type IIB fibers. We recorded 15–20 series of images for each muscle, each series from a different fiber. We then used the NIH Image software to estimate the average number of Golgi elements per unit volume at the surface and in the core of the fibers (see Materials and Methods). For each fiber, we used the confocal software to measure the midbelly width and the depth of the fiber. We also counted the number of myonuclei found in a 100-μm-long fiber segment, using double staining with GLUT4 to exclude nonmuscle nuclei. We then used these data to estimate the total number of Golgi elements found in a segment of each fiber type (Table 1). These calculations show that the main difference between soleus and TFL fibers is in the distribution of the elements, especially the accumulation of GC elements at the surface of the soleus: 74% of the total GC is found in a thin rim that represents only 17% of the fiber volume, whereas the distribution favors the core of the IIB fibers. Although the number of GC elements per nucleus is ∼30% lower in IIB fibers compared to type I fibers, the total amount of Golgi complex per unit fiber length is remarkably similar. This is the case whether we counted whole GC elements, as shown in Table 1, or measured their total area (data not shown).
Fig. 4.

Golgi complex elements are differentially distributed in type I fibers from the soleus and type II B fibers from the tensor fascia latae. Z-series of confocal images were collected from soleus and TFL fibers stained for MG160. The focus of the first image was at the surface of the fibers and is shown in the top panel. Nine additional images were recorded at 1 μm intervals. The projections of the 10 images were pseudocolored according to a depth scale (bottom panels). Notice the dominant contribution of the surface staining (red) in the soleus and the arrangement of the core staining in long stretches at different depths, compared to the much more random distribution of the staining in the TFL. Scale bar, 10 μm.
Electron microscopy shows stacks of Golgi cisternae both at the surface and in the core of all muscle fibers
When rat muscles (soleus and red gastrocnemius) are examined in the electron microscope, small stacks of three to four cisternae are observed in all parts of the muscle (Fig.5): around the nuclei, especially at the poles, along the plasma membrane in regions devoid of nuclei, and in the myofibrillar core. The stacks are short (0.71 ± 0.3 μm; mean ± SD; n = 46 in the soleus) compared to the long ribbons found in dividing cells, which is consistent with the immunofluorescent pattern of dots and dashes. When the fibers are immunolabeled for MG160, the grains are clearly limited to the medial/trans-cisternae. In contrast, they extend to the last cisternae and beyond for TGN38 and GLUT4. This distribution shows that the stacks are polarized, with the cis-Golgi facing the nuclear membrane. Thus, each of the Golgi elements observed in light microscopy represents a small stack of cisternae.
Fig. 5.
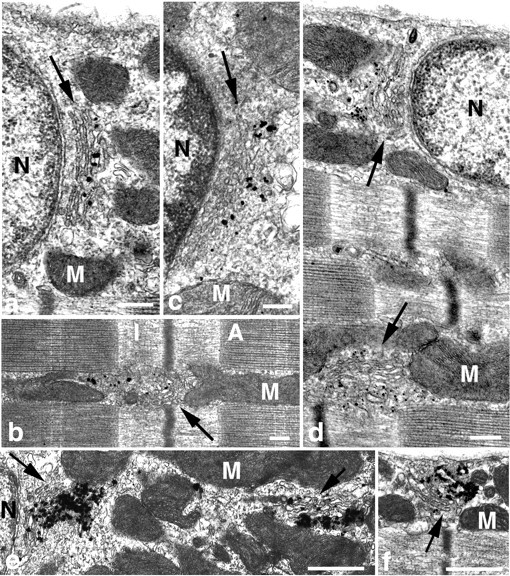
EM immunogold labeling of Golgi complex proteins in skeletal muscle. Typical stacks of cisternae (arrows) are found at the nuclear poles (a, c–e), in the myofibrillar core of the fibers (b, d), and elsewhere in the cytoplasm (e, f) of soleus (a–d) and RG fibers (e, f). Immunogold labeling for MG160 (a, b) is confined to the middle to trans-cisternae, whereas TGN38 (c) and GLUT4 (d–f) are found in the TGN area. N, Nuclei; M,mitochondria; I, I-band; A, A-band. Scale bars: a–d, 200 nm; e, f,500 nm.
The organization of the microtubule cytoskeleton is fiber type-dependent as well
What distributes the Golgi complex elements throughout the fibers? In other mammalian cell types, the Golgi complex is positioned by the microtubule-linked motors dynein and kinesin (for review, seeBurkhardt, 1998). Furthermore, microtubules have been shown to be associated with the Golgi complex in fibers from the flexor digitorum brevis (Rahkila et al., 1997). To assess whether microtubule distribution is fiber type-dependent, we double-stained soleus and TFL fibers with anti-α-tubulin and Golgi markers and observed the fibers with the confocal microscope (Fig. 6). All fibers show an extensive network of microtubules in all possible orientations, straight and kinky, single and bundled, with some variability in the pattern and density along fibers. Nevertheless, there are features that appear characteristic of the different fiber types, of which the images shown in Figure 6 are representative. At the surface of the fibers (Fig. 6, top panels), in the equatorial plane of the nuclei, type I fibers (soleus) show dense bundles of interlacing microtubules around the nuclei and in long lines between them, with few or no clear nucleation points. The dominant direction of the microtubules is longitudinal. In contrast, at this depth in type IIB fibers, we see more individual microtubules than bundles, with clear nucleation points, marked by the presence of an aster of microtubules, often at the poles of the nuclei but elsewhere as well. Golgi elements, here identified by GLUT4 staining (Fig.6, middle panels; small GLUT4 dots are also visible) are found along the denser bundles of microtubules in soleus fibers and at the nucleation points in the TFL fibers. In the core of the fibers (Fig. 6, bottom panels), the density of staining decreases in soleus fibers but not in TFL fibers. The dominant staining in the former consists of rare, long stretches of microtubules (Fig. 6,arrows), strikingly reminiscent of the stretches of Golgi elements found in type I fibers (Fig. 1). Type IIB fibers show evenly distributed small bundles of longitudinal and transverse microtubules. Therefore, it appears that microtubule distribution is fiber type-related with a distribution similar to that of Golgi elements.
Fig. 6.

Microtubule patterns are fiber type-dependent. Soleus and TFL fibers were double-stained for α-tubulin (α-tub) and GLUT4 (gt). Thetop panels show the projections of two confocal images collected at the surface of the fiber and immediately below. Color panels show the colocalization (yellow) of GLUT4 (green) and α-tubulin (red).Arrows point to the position of the Golgi elements as revealed by GLUT4 staining. Notice how these positions correspond to prominent microtubule nucleation sites in the TFL, but not in the soleus. Bottom panels show a view of the same fiber ∼7 μm inside. The TFL has more central microtubules, but they are shorter in the longitudinal orientation. Longitudinal stretches of microtubules are found in the soleus (arrows). The surface of the fiber (arrowheads) stands out compared to the core in the soleus but not in the TFL. Scale bars, 10 μm.
Although it is clear that the Golgi elements in type IIB fibers are positioned at the microtubule nucleation points, for type I fibers, the observation of the microtubules provides no clue as to the position of the Golgi elements, except that they are found along the densest bundles. To examine whether stable microtubules may be involved in the positioning of the Golgi elements and determine whether their organization is fiber type-dependent, soleus and TFL fibers were stained with anti-MG160 antibodies, together with antibodies specific for either tyr-tubulin, glu-tubulin, or Δ2-tubulin (Sato et al., 1997). Tyr-tubulin is present in all microtubules, whereas glu-tubulin and Δ2-tubulin are present in increasingly stable microtubules (Sato et al., 1997). All three isoforms were found in the different fiber types, all along the fibers (data not shown). Many Golgi elements appeared to be associated with stable microtubules (Fig.7). The pattern of stable microtubules differed between fiber types similarly to their dynamic counterparts, suggesting that there is no specific fiber type-related pattern of stabilization, nor did it appear that one fiber type had significantly more stable microtubules than the other (data not shown).
Fig. 7.
Golgi complex elements colocalize with stable microtubules. Soleus fibers were double-stained for MG160 (red) and glutamylated tubulin (green) and observed with a confocal microscope. The top panel shows a view at the surface of a fiber. A nucleus (arrows) is surrounded by microtubules and Golgi elements. Notice that all Golgi elements are associated with stable microtubules. The bottom panel shows a view from inside the fiber. The rows of Golgi elements are associated with stretches of stable microtubules. Scale bar, 10 μm.
The organization of the Golgi complex at the NMJ is independent of fiber type
There has been some debate as to whether there is a special organization of the GC at the NMJ (Jasmin et al., 1989; Rahkila et al., 1997) or not (Ralston, 1993; Ralston and Ploug, 1996). The NMJ was localized in fibers from different muscles (soleus, TFL, and red gastrocnemius) by labeling with Texas Red-conjugated α-bungarotoxin or by scanning Hoechst-stained fibers at low magnification: the cluster of junctional nuclei is unmistakable. In the soleus, as we have reported before (Ralston and Ploug, 1996), the GC pattern around the NMJ nuclei was similar to that of extrajunctional nuclei (Fig.8a), except that the plane in which most of the staining lay was not consistently parallel to that of the plasma membrane. There was a correlation between the size of the junction (the number of myonuclei, which varied from 3 to >20) and the density of Golgi elements (data not shown), with some very large junctions showing a three-dimensional accumulation of Golgi elements resembling that described by Rahkila et al. (1997). In type II B fibers, surprisingly, we found the junctional nuclei surrounded by GC staining similar to that observed in type I fibers and therefore different from the staining of the extrajunctional nuclei in the same fiber (Fig. 8b). Similarly, we found a perinuclear belt around endplate nuclei in all fibers from the RG muscle (data not shown). Therefore, the Golgi complex distribution at the NMJ seems constant in all fibers and independent of fiber type.
Fig. 8.
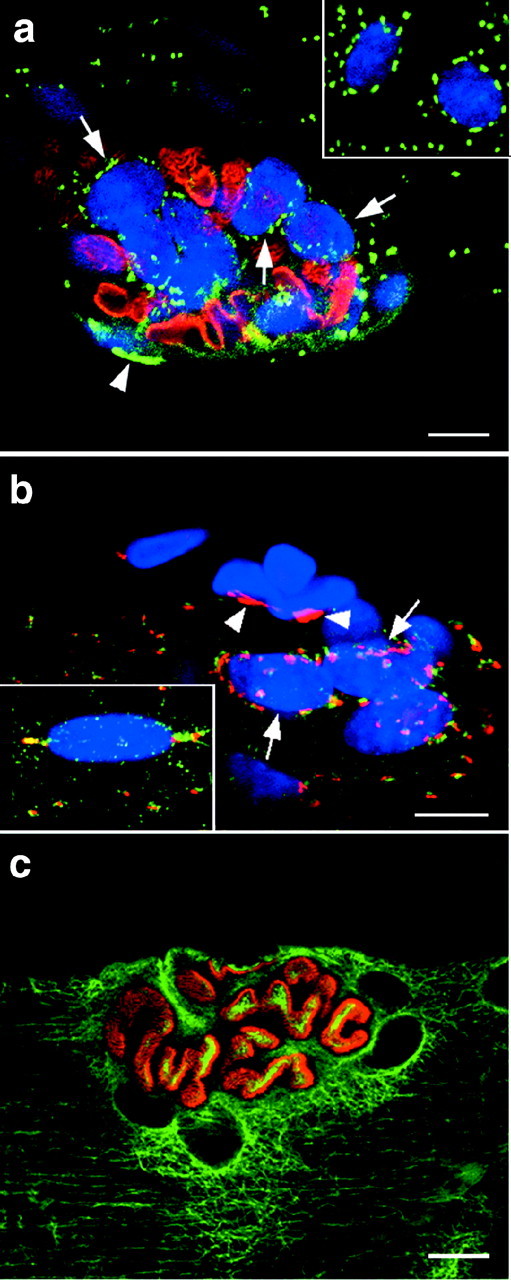
The Golgi complex pattern at the NMJ is consistently perinuclear independently of fiber type. The NMJ of single fibers from different muscles was stained with different combinations of markers. To localize the NMJ along the fibers, we used either staining with Texas Red-labeled bungarotoxin (a) or the unique appearance of the clustered endplate nuclei (b) stained with Hoechst (blue channel). The insets show extrajunctional nuclei from the same fiber. a shows a single confocal image at the NMJ of a soleus fiber stained with bungarotoxin (red) and MG160 (green). Each myonucleus is surrounded by a belt of Golgi complex elements but, because the nuclei are not all in the same orientation, the staining is distinct around a few nuclei only (arrows). The arrowhead points to the Golgi complex of a nonmuscle nucleus. b shows the NMJ of a red gatrocnemius fiber stained for MG160 (red) and GLUT4 (green). Theinset shows an extrajunctional nucleus, the staining of which identifies the fiber as type IIB. The junctional nuclei, however, are surrounded by GLUT4 (green) and MG160 (red) staining. Nonmuscle nuclei (arrowheads) can be identified by the compact MG160 staining and the absence of GLUT4 staining. c shows the NMJ of a soleus fiber stained with α-bungarotoxin (red) and anti-tubulin (green). Notice that the tubulin staining is more intense in the immediate surrounding of the NMJ than further out. Scale bars, 10 μm.
If the distribution of microtubules is to explain the distribution of GC elements, we should expect the distribution of microtubules at the NMJ to be fiber type-independent as well. Examination of tubulin staining at the NMJ of a soleus fiber (Fig. 8c) demonstrates a denser labeling than elsewhere, as was shown by Rahkila et al. (1997) for the flexor digitorum brevis. Therefore, at the NMJ as elsewhere in the fibers, the density of microtubules appears to be a good predictor of the general position of the GC. In agreement with Jasmin et al. (1990), the NMJ also showed a higher density of stable microtubules (data not shown), corresponding to its higher density of total microtubules.
The effects of fiber type on the organization of the Golgi complex are reversed by denervation
To observe whether the effects of muscle activity on Golgi complex organization are reversible, as suggested by the data of Jasmin et al. (1989), hindlimb muscles from adult rats were denervated by resection of part of the sciatic nerve. Five days later, soleus and red gastrocnemius muscles from denervated and from contralateral control hindlegs were fixed and stained. A total of 40 fibers were examined. Conventional images were collected from the surface of 20 individual fibers for each muscle, in each condition. Figure9 shows typical patterns for denervated soleus (a–d) and RG fibers (e–j) stained with anti-GM130. The most striking changes are in the pattern of GM130 in the RG fibers, which all show some degree of perinuclear staining, in many fibers as strong as in the soleus fibers (Fig. 9, e, h, i, j). In contrast, very few fibers showed a type I staining in the control muscles. To verify that this perinuclear staining does indeed correspond to an increase in the occurrence of Golgi cisternae around the nuclei, control and denervated muscle fibers were also embedded and sectioned for EM observation. When we counted the number of perinuclear Golgi cisternae encountered, we found exactly the same number for control and denervated soleus fibers (20 cisternae for 31 nuclei). The control RG fibers showed fewer cisternae (12 cisternae for 41 nuclei), but the denervated ones about as many cisternae (20 cisternae for 27 nuclei) as the soleus fibers. These results therefore confirm that the appearance of perinuclear staining in denervated RG fibers corresponds to an increase in morphologically identifiable Golgi complex cisternae.
Fig. 9.
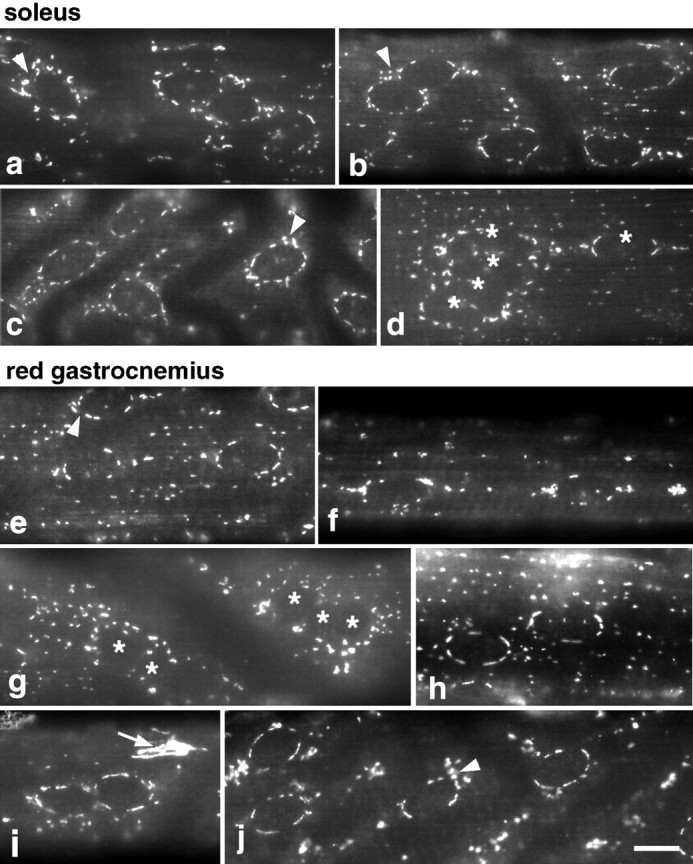
After denervation, the Golgi complex pattern is similar at the surface of type I and type II fibers. Five days after denervation, fibers from both denervated and contralateral control hindlegs of soleus and RG muscles were stained for MG160. The staining in the control fibers was similar to what is shown in Figure 1. In denervated soleus fibers (a–d), the perinuclear pattern is maintained. In RG fibers (e–j), all fibers have a perinuclear pattern that resembles that of the soleus (e, h–j). In some fibers, Golgi elements are still more concentrated at the nuclear poles (f). The perinuclear pattern is not as tight (arrowheads) as in the control fibers. dand g show aggregated nuclei, marked with anasterisk. Such aggregates are frequently encountered in the denervated but not in the control fibers (see Results). The bright Golgi complex of a nonmuscle cell is marked by a small arrow in i. Scale bar, 10 μm.
A novel observation, in denervated fibers, was an increase in the proportion of clustered nuclei (Fig. 9d,g). In control fibers, few nuclei (11.8%, n = 228 for the soleus; 2.3%, n = 258 for the RG) form clusters (two or more muscle nuclei close enough that their membranes appear to touch in light microscopy). After denervation, there is a 3.9-fold increase in the proportion of clustered nuclei in the soleus fibers and a 4.3-fold increase in the RG fibers (46.3%, n = 214; 9.8%,n = 255, respectively). In addition, clusters of three nuclei or more (Fig. 9d,g) are frequent, whereas they are very rare in control fibers.
The images shown in Figure 9 were taken without attention to the relative intensity of the staining. To quantitate the effects of denervation, 12 Z-series of confocal images were collected from all samples under identical recording conditions, and NIH Image was used to quantitate the staining associated with the immediate perinuclear belt of the nuclei as well as the surface and core staining. Results are summarized in Table 2. They show that Golgi complex staining decreases by a factor of ∼2 in the soleus, with a large contribution from the surface staining, although the perinuclear labeling remains unchanged. In contrast, the staining in the RG fibers increases nearly twofold, with contributions from both surface (40%) and core (30%). After denervation, all fibers atrophy to the same degree, as shown by a 30% reduction in their cross-sectional area. The absolute numbers (data not shown) indicate that the control soleus has, per nucleus, 1.6 times as much Golgi as the control RG, which is slightly higher than the difference between soleus and TFL (Table 1). After denervation, however, the RG has about the same amount of GC as the control soleus. Therefore, it appears that innervation reversibly modulates the organization of the Golgi complex in muscle fibers.
Table 2.
Changes in the distribution of Golgi complex elements after denervation of soleus (SOL) and red gastrocnemius (RG) muscles
| SOL: den/ctrl | RG: den/ctrl | ||
|---|---|---|---|
| GC at fiber surface | Number of GC pixels per 1000 μm2 (n = 12) | 0.5 | 2.5 |
| Number of GC pixels around each nucleus (n = 50) | 1.2 | 2.1 | |
| GC in fiber core | Number of GC pixels per 1000 μm3 (n = 12) | 0.9 | 2.1 |
| Fiber dimensions | Fiber section (μm2) (n = 29) | 0.7 | 0.7 |
| Number of nuclei per 100 μm fiber length (n = 12) | 1.2 | 1.0 | |
| Volume of fiber per nucleus (μm3) | 0.6 | 0.7 | |
| Total GC estimates for a 100-μm-long fiber segment | GC on the surface | 0.4 | 1.4 |
| GC in the core | 0.6 | 1.3 | |
| Total | 0.5 | 1.6 | |
| Total per nucleus | 0.4 | 1.9 |
Twelve Z-series of confocal images, each consisting of eight images, were recorded from fibers of innervated or denervated soleus and red gastrocnemius muscles. Similar measurements and calculations were performed as described in the legend to Table 1, except that instead of measuring the number of GC elements, we measured the total surface of GC pixels. For each muscle, we then calculated the ratio of the value for the denervated compared to the innervated muscle.
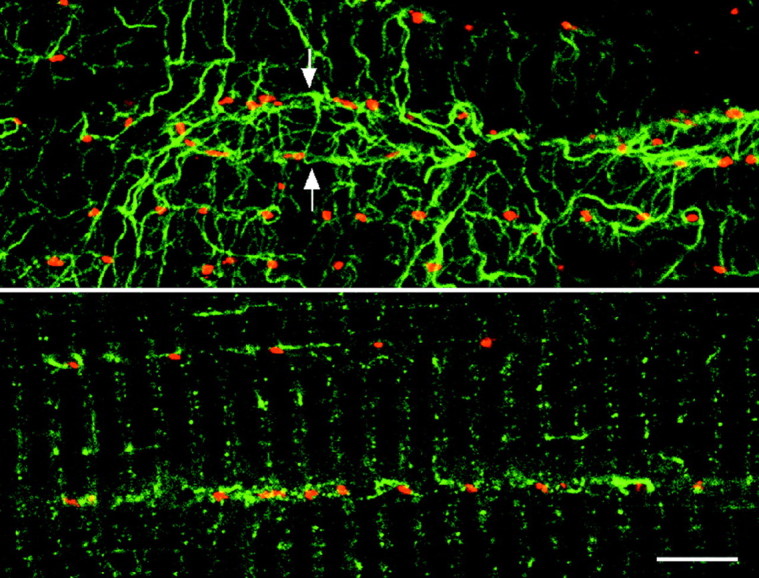
Denervation affected microtubules as well. The density of labeling appeared generally lower throughout the fibers, but all nuclei, independent of fiber type, showed a continuous perinuclear staining (Fig. 10). The staining pattern at the NMJ for both GC markers and microtubules appeared largely unchanged after denervation. In the soleus, it was less attenuated than that of the extrajunctional nuclei (data not shown). All results, therefore, are consistent with a model in which the Golgi complex organization is regulated by the fiber type-dependent organization of microtubules.
Fig. 10.
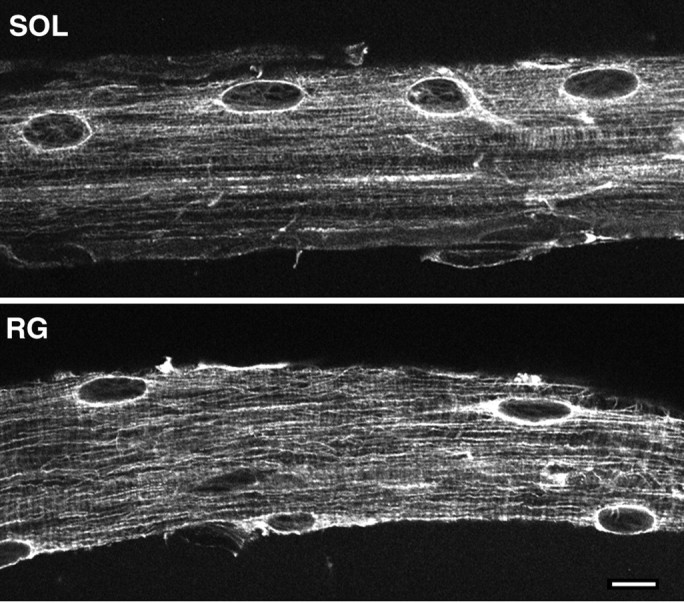
After denervation, the microtubule pattern is similar at the surface of type I and type II fibers. Distribution of the microtubules in denervated soleus (SOL) and red gastrocnemius (RG) fibers. Notice the strong perinuclear staining and the longitudinal microtubules in both. Scale bar, 10 μm.
DISCUSSION
In this paper, we show, for the first time, that the organization of the Golgi complex and of the microtubules in muscle is fiber type-dependent. The most striking difference in GC organization between different fiber types seems to be the relative accumulation of GC elements at the surface of the type I fibers, especially as a perinuclear belt, compared to a more even distribution between surface and core in type II fibers. We have observed this difference with several antibodies that label different compartments of the GC: GM130 for the cis-Golgi, MG160 for the medial/trans-Golgi, and TGN38 and GLUT4 for the TGN. In addition, we have observed by EM a higher frequency of cisternae around the nuclei of soleus fibers than of red gatrocnemius fibers. We therefore feel confident that our observations truly reflect a different organization of the GC rather than the local upregulation or downregulation of one of its proteins.
The present work establishes in unequivocal terms that the Golgi complex is present throughout the whole fiber of all muscle types, and it suggests that the controversy on the existence of the GC in extrajunctional areas of muscle (Jasmin et al., 1989, 1995; Ralston, 1993; Antony et al., 1995, Rahkila et al., 1996, 1997) is in large part attributable to technical factors: the accidental preference of each group for a different, mostly slow or mostly fast muscle, and the use by Jasmin et al. (1989, 1995) and Antony et al. (1995) of muscle sections exclusively. We have discussed elsewhere (Ralston and Ploug, 1996) how geometrical factors reduce the probability of exposing the surface pattern of the GC in a type I fiber. It is also very difficult, in sections, to determine if staining originates from the muscle fiber or from the many nonmuscle cells that are embedded in the muscle surface. Finally, the initial work was hampered by the failure of several antibodies against GC proteins to produce a staining in muscle (Jasmin et al., 1989; Ralston, 1993; Antony et al., 1995). The increasing availability of antibodies to Golgi complex proteins characterized in other cell types has shown that most of them are, in fact, present in muscle.
Each GC element in muscle is very small compared to the GC of dividing cells. However, we must keep in mind the gigantic size of muscle fibers. To estimate the total amount of GC in muscle, we have quantitated optical sections of whole fibers. Regardless of fiber type, we find an average of ∼100 Golgi elements per nucleus. EM shows that each element is a small stack of cisternae, of similar size to those found in mammalian cells treated with microtubule-disrupting agents.Cole et al. (1996) found from 200 to 300 such elements per HeLa cell, and the GC of muscle myoblasts is considerably smaller than that of HeLa cells (data not shown). The amount of GC per nucleus in muscle fibers is therefore roughly of the same order of magnitude as that found in other mammalian cells and in undifferentiated muscle cells.
The proposal that microtubules are responsible for the differential distribution of the GC throughout the muscle fibers is based on two observations: the colocalization of GC elements with microtubules, previously reported in other muscles as well (Rahkila et al., 1997), and the new observation that microtubules themselves are differentially distributed, in a manner that parallels the distribution of the GC. Microtubule distribution in soleus muscle has been studied at the EM level by Cartwright and Goldstein (1982) and by light microscopy byBoudriau et al. (1993), who reported 1.7 times more α-tubulin and a higher density of subsarcolemmal microtubules in slow-twitch fibers than in fast-twitch ones. A role has been proposed for microtubules in the nucleation of myofibrils (Roy et al., 1997) and in the organization of the sarcoplasmic architecture (Boudriau et al., 1993). Our results suggest that the main role of microtubules in muscle fibers may be in the distribution of subcellular organelles. Interestingly, a differential distribution of mitochondria resembling that of the GC was reported by Gauthier and Padykula (1966).
In type IIB fibers, Golgi elements are localized at microtubule nucleation points, marked by a microtubule aster. This is similar to the gathering of the GC around the centrosome of dividing cells. In type I fibers, however, there are very few distinct microtubule nucleating sites, and it is not clear what determines the exact position of the Golgi elements along the microtubules, assuming they are stationary. During myogenesis, the nucleation site of microtubules changes from a unique centrosome to multiple sites, some of which are along the outer nuclear membrane, which is part of the endoplasmic reticulum (ER) (Tassin et al., 1985a,b). It seems likely, therefore, that the microtubules in differentiated muscle cells have their minus ends at the ER, whereas the minus ends of microtubules in dividing cells are at the centrosome. Newly formed Golgi cisternae would therefore remain at the “ER exit sites” (Cole et al., 1996) in muscle. Interestingly, a very similar organization of the Golgi complex, small polarized stacks of cisternae associated with the ER exit sites, has recently been described in the budding yeastPicchia pastoris (Rossanese et al., 1999). The organization of the GC in skeletal muscle also resembles that of the atrial muscle cells of the heart, although the Golgi complex forms a continuous ribbon around the nuclei of these cells (Rambourg et al., 1984).
The fiber type-dependent organization of the microtubules, in turn, may be caused by a differential organization of microtubule-organizing proteins such as pericentrin (Doxsey et al., 1994), for which we have preliminary evidence. Microtubule-associated proteins (MAPs) might also be involved. The subcellular localization of a muscle-specific isoform of MAP4 (Mangan and Olmsted, 1996) has not been determined yet. Differential stabilization of microtubules initially appeared as another potential mechanism because they appear to be modulated by load in cardiac muscle (Sato et al., 1997). However, our results suggest that in all fiber types, both at the NMJ and elsewhere, stable microtubules represent a constant fraction of the microtubules.
Our observations definitely show that innervation does not suppress the extrajunctional Golgi complex as had been proposed (Jasmin et al., 1989), although we agree that innervation does regulate the Golgi complex. However, we show that this regulation is mostly taking place through differential localization.
At the neuromuscular junction, we observe, in all fiber types, a perinuclear staining of the junctional nuclei with GC markers and an increased density of microtubules. Such a pattern was also demonstrated by Simon et al. (1992) in fibers from the extensor digitorum longus (>50% type IIB fibers) from transgenic mice expressing human growth hormone. Innervation therefore appears to have a stabilizing effect on the GC. The hallmark of the neuromuscular junction is the high local concentration of the acetylcholine receptor (AChR) and of several associated proteins (Hall and Sanes, 1993), as well as that of mRNAs encoding them (Merlie and Sanes, 1985; Fontaine et al., 1988; Goldman and Staple, 1989; Moscoso et al., 1995). AChR accumulation at the NMJ has been attributed to a combination of transcriptional activation by ARIA/neuregulin and to clustering by agrin, whereas its extrajunctional concentration is downregulated by activity (for review, see Hall and Sanes, 1993; Burden, 1998). The regulation of the distribution of other NMJ elements is less well understood. As regards the Golgi complex, its lower concentration in the extrajunctional part of fast fibers and upregulation after denervation are reminiscent of the downregulation of extrajunctional AChR by muscle activity. Its stabilization at the NMJ of type II fibers resembles that of AChR as well. However, in the case of the GC, this effect may be completely accounted for by post-translational mechanisms, which could also contribute to the relative concentration of proteins other than the AChR and of many mRNAs at the NMJ.
The fiber type-dependent distribution of the Golgi complex has functional consequences: the capacity for glycosylation, transmembrane protein, and lipid synthesis, all functions of the GC, are more concentrated in the core of the fast than of the slow fibers. It may therefore be responsible for the larger amount of T-tubules in the faster fibers. Another consequence is an increased capacity for glucose uptake in the core of fast fibers, because the TGN is an important storage site for the glucose transporter GLUT4 (Ploug et al., 1998 and references therein). Finally, the large proportion of Golgi complex found at the surface of the soleus may provide a large secretory capacity into the dense network of blood vessels that course along the surface of the heavily vascularized slow oxidative fibers. Muscle is known to be capable of sustained secretion (Wolff et al., 1992; Rizzuto et al., 1999). In conclusion, the present results extend our understanding of the factors that pattern muscle architecture and reconcile seemingly incompatible previous data.
Footnotes
This work was supported by the National Institutes of Health Intramural Program, by a grant from the Danish National Research Foundation (504–14) to T. Ploug, and by a NATO Collaborative Research Grant to T. Ploug and E. Ralston. We are grateful to Tom S. Reese for support throughout this project, to Carolyn Smith [National Institute of Neurological Disorders and Stroke (NINDS) Light Imaging Facility] for help with the confocal microscopy, to Jung-Hwa Tao-Cheng, and V. Tanner-Crocker [NINDS electron microscopy (EM) facility] for help with the EM work, and to Gerda Hau (Panum Institute) for skillful technical help. We thank all those, cited in the text, who provided us with reagents. We are also grateful to Jung-Hwa Tao-Cheng, Matt Daniels (National Heart, Lung, and Blood Institute), and Andres Buonanno (National Institute of Child Health and Human Development) for useful comments on this manuscript.
Correspondence should be addressed to Evelyn Ralston, Laboratory of Neurobiology, National Institute of Neurological Disorders and Stroke, National Institutes of Health, Building 36, Room 2A-21, Bethesda, MD 20892-4062. E-mail: esr@codon.nih.gov.
REFERENCES
- 1.Antony C, Huchet M, Changeux J-P, Cartaud J. Developmental regulation of membrane traffic organization during synaptogenesis in mouse diaphragm muscle. J Cell Biol. 1995;130:959–968. doi: 10.1083/jcb.130.4.959. [DOI] [PMC free article] [PubMed] [Google Scholar]
- 2.Armstrong RB, Phelps RO. Muscle fiber type composition of the rat hindlimb. Am J Anat. 1984;171:259–272. doi: 10.1002/aja.1001710303. [DOI] [PubMed] [Google Scholar]
- 3.Bottinelli R, Schiaffino S, Reggiani C. Force-velocity relations and myosin heavy chain isoform compositions of skinned fibres from rat skeletal muscle. J Physiol (Lond) 1991;437:655–672. doi: 10.1113/jphysiol.1991.sp018617. [DOI] [PMC free article] [PubMed] [Google Scholar]
- 4.Boudriau S, Vincent M, Cote CH, Rogers PA. Cytoskeletal structure of skeletal muscle: identification of an intricate exosarcomeric microtubule lattice in slow- and fast-twitch muscle fibers. J Histochem Cytochem. 1993;41:1013–1021. doi: 10.1177/41.7.8515044. [DOI] [PubMed] [Google Scholar]
- 5.Buonanno A, Fields RD. Gene regulation by patterned electrical activity during neural and skeletal muscle development. Curr Opin Neurobiol. 1999;9:110–120. doi: 10.1016/s0959-4388(99)80014-2. [DOI] [PubMed] [Google Scholar]
- 6.Burden SJ. The formation of neuromuscular synapses. Genes Dev. 1998;12:133–148. doi: 10.1101/gad.12.2.133. [DOI] [PubMed] [Google Scholar]
- 7.Burkhardt JK. The role of microtubule-based motor proteins in maintaining the structure and function of the Golgi complex. Biochim Biophys Acta. 1998;1404:113–126. doi: 10.1016/s0167-4889(98)00052-4. [DOI] [PubMed] [Google Scholar]
- 8.Cartwright J, Jr, Goldstein MA. Microtubules in soleus muscles of the postnatal and adult rat. J Ultrastruct Res. 1982;79:74–84. doi: 10.1016/s0022-5320(82)90053-3. [DOI] [PubMed] [Google Scholar]
- 9.Cole NB, Sciaky N, Marotta A, Song J, Lippincott-Schwartz J. Golgi dispersal during microtubule disruption: regeneration of Golgi stacks at peripheral endoplasmic reticulum exit sites. Mol Biol Cell. 1996;7:631–650. doi: 10.1091/mbc.7.4.631. [DOI] [PMC free article] [PubMed] [Google Scholar]
- 10.Doxsey SJ, Stein P, Evans L, Calarco PD, Kirschner M. Pericentrin, a highly conserved centrosome protein involved in microtubule organization. Cell. 1994;76:639–650. doi: 10.1016/0092-8674(94)90504-5. [DOI] [PubMed] [Google Scholar]
- 11.Eisenberg B. Quantitative ultrastructure of mammalian skeletal muscle. In: Peachey L, editor. Skeletal muscle, Vol 10. American Physiological Society; Bethesda, MD: 1983. pp. 73–112. [Google Scholar]
- 12.Fontaine B, Sassoon D, Buckingham M, Changeux JP. Detection of the nicotinic acetylcholine receptor alpha-subunit mRNA by in situ hybridization at neuromuscular junctions of 15-day-old chick striated muscles. EMBO J. 1988;7:603–609. doi: 10.1002/j.1460-2075.1988.tb02853.x. [DOI] [PMC free article] [PubMed] [Google Scholar]
- 13.Franzini-Armstrong C. In: In: Myology: basic and clinical. Engel A, Franzini-Armstrong C, editors. McGraw-Hill; New-York: 1994. [Google Scholar]
- 14.Gauthier GF, Padykula HA. Cytological studies of fiber types in skeletal muscle. J Cell Biol. 1966;28:333–354. doi: 10.1083/jcb.28.2.333. [DOI] [PMC free article] [PubMed] [Google Scholar]
- 15.Goldman D, Staple J. Spatial and temporal expression of acetylcholine receptor RNAs in innervated and denervated rat soleus muscle. Neuron. 1989;3:219–228. doi: 10.1016/0896-6273(89)90035-4. [DOI] [PubMed] [Google Scholar]
- 16. Gonatas JO, Mezitis SG, Stieber A, Fleischer B, Gonatas NK. MG-160. A novel sialoglycoprotein of the medial cisternae of the Golgi apparatus J Biol Chem 264 1989. 646 653[Erratum (1989)264:4264]. [PubMed] [Google Scholar]
- 17.Gonatas JO, Mourelatos Z, Stieber A, Lane WS, Brosius J, Gonatas NK. MG-160, a membrane sialoglycoprotein of the medial cisternae of the rat Golgi apparatus, binds basic fibroblast growth factor and exhibits a high level of sequence identity to a chicken fibroblast growth factor receptor. J Cell Sci. 1995;108:457–467. doi: 10.1242/jcs.108.2.457. [DOI] [PubMed] [Google Scholar]
- 18.Hall ZW, Sanes JR. Synaptic structure and development: the neuromuscular junction. Cell. 1993;72[Suppl]:99–121. doi: 10.1016/s0092-8674(05)80031-5. [DOI] [PubMed] [Google Scholar]
- 19.Horn M, Banting G. Okadaic acid treatment leads to a fragmentation of the trans-Golgi network and an increase in expression of TGN38 at the cell surface. Biochem J. 1994;301:69–73. doi: 10.1042/bj3010069. [DOI] [PMC free article] [PubMed] [Google Scholar]
- 20.Jasmin BJ, Cartaud J, Bornens M, Changeux JP. Golgi apparatus in chick skeletal muscle: changes in its distribution during end plate development and after denervation. Proc Natl Acad Sci USA. 1989;86:7218–7222. doi: 10.1073/pnas.86.18.7218. [DOI] [PMC free article] [PubMed] [Google Scholar]
- 21.Jasmin BJ, Changeux JP, Cartaud J. Compartmentalization of cold-stable and acetylated microtubules in the subsynaptic domain of chick skeletal muscle fibre. Nature. 1990;344:673–675. doi: 10.1038/344673a0. [DOI] [PubMed] [Google Scholar]
- 22.Jasmin BJ, Antony C, Changeux JP, Cartaud J. Nerve-dependent plasticity of the Golgi complex in skeletal muscle fibres: compartmentalization within the subneural sarcoplasm. Eur J Neurosci. 1995;7:470–479. doi: 10.1111/j.1460-9568.1995.tb00343.x. [DOI] [PubMed] [Google Scholar]
- 23.Luff AR, Atwood HL. Changes in the sarcoplasmic reticulum and transverse tubular system of fast and slow skeletal muscles of the mouse during postnatal development. J Cell Biol. 1971;51:369–383. doi: 10.1083/jcb.51.2.369. [DOI] [PMC free article] [PubMed] [Google Scholar]
- 24.Mangan ME, Olmsted JB. A muscle-specific variant of microtubule-associated protein 4 (MAP4) is required in myogenesis. Development. 1996;122:771–781. doi: 10.1242/dev.122.3.771. [DOI] [PubMed] [Google Scholar]
- 25.Merlie JP, Sanes JR. Concentration of acetylcholine receptor mRNA in synaptic regions of adult muscle fibres. Nature. 1985;317:66–68. doi: 10.1038/317066a0. [DOI] [PubMed] [Google Scholar]
- 26.Moscoso LM, Merlie JP, Sanes JR. N-CAM, 43K-rapsyn, and S-laminin mRNAs are concentrated at synaptic sites in muscle fibers. Mol Cell Neurosci. 1995;6:80–89. doi: 10.1006/mcne.1995.1008. [DOI] [PubMed] [Google Scholar]
- 27.Mourelatos Z, Gonatas JO, Nycum LM, Gonatas NK, Biegel JA. Assignment of the GLG1 gene for MGF-160, a fibroblast growth factor and E-selectin binding membrane sialoglycoprotein of the Golgi apparatus, to chromosome 16q22–q23 by fluorescence in situ hybridization. Genomics. 1995;28:354–355. doi: 10.1006/geno.1995.1156. [DOI] [PubMed] [Google Scholar]
- 28.Nakamura N, Rabouille C, Watson R, Nilsson T, Hui N, Slusarewicz P, Kreis TE, Warren G. Characterization of a cis-Golgi matrix protein, GM130. J Cell Biol. 1996;131:1715–1726. doi: 10.1083/jcb.131.6.1715. [DOI] [PMC free article] [PubMed] [Google Scholar]
- 29.Ploug T, van Deurs B, Ai H, Cushman SW, Ralston E. Analysis of GLUT4 distribution in whole skeletal muscle fibers: identification of distinct storage compartments that are recruited by insulin and muscle contractions. J Cell Biol. 1998;142:1429–1446. doi: 10.1083/jcb.142.6.1429. [DOI] [PMC free article] [PubMed] [Google Scholar]
- 30.Rahkila P, Alakangas A, Vaananen K, Metsikkö K. Transport pathway, maturation, and targetting of the vesicular stomatitis virus glycoprotein in skeletal muscle fibers. J Cell Sci. 1996;109:1585–1596. doi: 10.1242/jcs.109.6.1585. [DOI] [PubMed] [Google Scholar]
- 31.Rahkila P, Vaananen K, Saraste J, Metsikkö K. Endoplasmic reticulum to Golgi trafficking in multinucleated skeletal muscle fibers. Exp Cell Res. 1997;234:452–464. doi: 10.1006/excr.1997.3633. [DOI] [PubMed] [Google Scholar]
- 32.Ralston E. Changes in architecture of the Golgi complex and other subcellular organelles during myogenesis. J Cell Biol. 1993;120:399–409. doi: 10.1083/jcb.120.2.399. [DOI] [PMC free article] [PubMed] [Google Scholar]
- 33.Ralston E, Ploug T. Pre-embedding staining of single muscle fibers for light and electron microscopy studies of subcellular organization. In: Malecki M, Roomans G, editors. Scanning microscopy, Supplement 10, Science of biological specimen preparation. Scanning Microscopy International; Chicago, IL: 1996. pp. 249–260. [PubMed] [Google Scholar]
- 34.Rambourg A, Segretain D, Clermont Y. Tridimensional architecture of the Golgi apparatus in the atrial muscle cell of the rat. Am J Anat. 1984;170:163–179. doi: 10.1002/aja.1001700204. [DOI] [PubMed] [Google Scholar]
- 35.Rizzuto G, Cappelletti M, Maione D, Savino R, Lazzaro D, Costa P, Mathiesen I, Cortese R, Ciliberto G, Laufer R, La Monica N, Fattori E. Efficient and regulated erythropoietin production by naked DNA injection and muscle electroporation. Proc Natl Acad Sci USA. 1999;96:6417–6422. doi: 10.1073/pnas.96.11.6417. [DOI] [PMC free article] [PubMed] [Google Scholar]
- 36.Rossanese OW, Soderholm J, Brooke JB, Sears IB, O'Connor J, Williamson EK, Glick BS. Golgi structure correlates with transitional endoplasmic reticulum organization in Pichia pastoris and Saccharomyces cerevisiae. J Cell Biol. 1999;145:69–81. doi: 10.1083/jcb.145.1.69. [DOI] [PMC free article] [PubMed] [Google Scholar]
- 37.Roy D, Johannsson E, Bonen A, Marette A, Ackerley C, Carpentier JL, Klip A. Electrical stimulation induces fiber type-specific translocation of GLUT-4 to T tubules in skeletal muscle. Am J Physiol. 1997;273:E688–E694. doi: 10.1152/ajpendo.1997.273.4.E688. [DOI] [PubMed] [Google Scholar]
- 38.Sato H, Nagai T, Kuppuswamy D, Narishige T, Koide M, Menick DR, Cooper GI. Microtubule stabilization in pressure overload cardiac hypertrophy. J Cell Biol. 1997;139:963–973. doi: 10.1083/jcb.139.4.963. [DOI] [PMC free article] [PubMed] [Google Scholar]
- 39.Schiaffino S, Reggiani C. Molecular diversity of myofibrillar proteins: gene regulation and functional significance. Physiol Rev. 1996;76:371–423. doi: 10.1152/physrev.1996.76.2.371. [DOI] [PubMed] [Google Scholar]
- 40.Schiaffino S, Saggin L, Viel A, Ausoni S, Sartore S, Gorza L. Muscle fiber types identified by monoclonal antibodies to myosin heavy chains. In: Benzi G, Packer L, Siliprandi N, editors. Biochemical aspects of physical exercise. Elsevier Science; Amsterdam: 1986. [Google Scholar]
- 41.Schiaffino S, Gorza L, Sartore S, Saggin L, Ausoni S, Vianello M, Gundersen K, Lømo T. Three myosin heavy chain isoforms in type 2 skeletal muscle fibres. J Muscle Res Cell Motil. 1989;10:197–205. doi: 10.1007/BF01739810. [DOI] [PubMed] [Google Scholar]
- 42.Schmalbruch H. In: Skeletal muscle. Oksche A, Vollrath L, editors. Springer; Berlin: 1985. [Google Scholar]
- 43.Simon AM, Hoppe P, Burden SJ. Spatial restriction of AChR gene expression to subsynaptic nuclei. Development. 1992;114:545–553. doi: 10.1242/dev.114.3.545. [DOI] [PubMed] [Google Scholar]
- 44.Tassin AM, Maro B, Bornens M. Fate of microtubule organizing centers during in vitro myogenesis. J Cell Biol. 1985a;100:35–46. doi: 10.1083/jcb.100.1.35. [DOI] [PMC free article] [PubMed] [Google Scholar]
- 45.Tassin AM, Paintrand M, Berger EG, Bornens M. The Golgi apparatus remains associated with microtubule organizing centers during myogenesis. J Cell Biol. 1985b;101:630–638. doi: 10.1083/jcb.101.2.630. [DOI] [PMC free article] [PubMed] [Google Scholar]
- 46.Wolff JA, Dowty ME, Jaio S, Repetto G, Berg RK, Ludtke JJ, Williams P, Slautterback DB. Expression of naked plasmids by cultured myotubes and entry of plasmids into T tubules and caveolae of mammalian skeletal muscle. J Cell Sci. 1992;103:1249–1259. doi: 10.1242/jcs.103.4.1249. [DOI] [PubMed] [Google Scholar]
- 47.Wu KD, Lytton J. Molecular cloning and quantification of sarcoplasmic reticulum Ca(2+)-ATPase isoforms in rat muscles. Am J Physiol. 1993;264:C333–341. doi: 10.1152/ajpcell.1993.264.2.C333. [DOI] [PubMed] [Google Scholar]