

Abstract
The daily ingestion of alcohol by pregnant mammals exposes the fetal brain to varying levels of alcohol through the placental circulation. Here we focus on the lingering impact on cortical function of 6.5% alcohol administered in a liquid diet to pregnant rats throughout gestation, followed by 3 alcohol-free months before brain function was analyzed in the offspring. Both spontaneous activity of the neurons in the barrel cortex and the level of response to test stimuli applied to the whiskers remained reduced by >75% after alcohol exposure. Whisker pairing, a type of cortical plasticity induced by trimming all but two whiskers in adult rats, occurred in <1 d in controls, but required 14 d to reach significance after alcohol exposure. These long-term neuronal deficits are present in all layers of cortex and affect neurons with both fast and slow action potentials. Plasticity is first seen in the total sample of neurons at 14 d; however, by 7 d, neurons in layer II/III already show plasticity, with no change in layer IV neurons, and a reverse shift occurs toward the inactive whisker in layer V neurons. Analysis of NMDA receptor subunits shows a persistent, ∼30–50% reduction of NR1, NR2A, and NR2B subunits at postnatal day 90 in the barrel field cortex. Exposing the prenatal alcohol-exposed rats to enriched rearing conditions significantly improves all measured cortical functions but does not restore normal values. The results predict that combinations of interventions will be necessary to completely restore cortical function after exposure of the fetal brain to alcohol.
Keywords: synaptic plasticity, FAS, somatosensory cortex, NMDA receptors, barrel cortex, cortical reorganization, rat neocortex
The first postnatal month is an important period for the development of normal, dendritic spines, synapses, and local circuits in rat sensory cortex (Miller, 1988). Most cortical neurons are silent in rat cortex around postnatal day 7 (P7), with only ∼3% of the neurons showing stable spontaneous activity at that age (Armstrong-James, 1975). Organized spontaneous activity in the form of burst-pause discharge and spindling first appear between the first and second week after birth. In our experience the end result of normal development in somatic sensory (barrel field) cortex of rats leads to (1) spontaneously active neurons under urethane anesthesia with ∼1 spike/sec, (2) a short latency (<10 msec) response of ∼1 spike/stimulus produced by controlled stimulation of the principal whisker, (3) a robust longer latency response from the principal whisker and 4–10 surrounding whiskers, and (4) inducible, experience-dependent, cortical plasticity that occurs within hours after whisker trimming (Diamond et al., 1993, 1994; Armstrong-James et al., 1994; Rema et al., 1998a). The shortest latency responses (6–10 msec) are generated most frequently in layer IV neurons, including both “fast” spike and “slow” or “regular” spiking neurons.
Given the immature state of rat cortex at the time of birth, any residual postnatal effects of prenatal alcohol exposure (PAE) on the development of normal functional properties in cortex must be exerted through immediate and irreversible brain damage and/or through effects on mechanisms that are needed for continued postnatal development. If there is no alcohol exposure after birth, but there are persistent deficits in cortical function in the adult PAE animal, the assumption has to be that alcohol-free rearing under typical laboratory conditions is not sufficient to induce or rekindle the impaired processes. A large literature documents residual deficits in brain structure and function that persist after various periods of PAE (Jones, 1988), with each deficit dependent on the time and duration of exposure, the concentration of alcohol, and the period of alcohol-free survival before the brain is analyzed (West et al., 1986).
To date, there has not been a detailed report on the impact of PAE on receptive field properties and activity-dependent single-neuron response plasticity in the neocortex. We initiated studies on the effect of PAE on the primary somatic sensory cortex of the rat after several reports that alcohol blocks NMDA receptor function in adult brain slices (Dildy and Leslie, 1989; Lovinger et al., 1989, 1990; Yuen et al., 1991; Morrisett and Swartzwelder, 1993). Chronic ingestion of ethanol produces an upregulation of NMDAR1 subunit expression in the adult (Trevisan et al., 1994), but in contrast, alcohol decreases NMDA receptor binding levels for many weeks after prenatal alcohol exposure (Morrisett et al., 1989; Savage et al., 1992).
One of the most relevant questions for studies of cognitive disabilities is how the normal mammalian brain develops the capacity for lifelong learning and memory. One current hypothesis is that an animal's initial interactions with the extrauterine environment may “set” or “fix” the threshold for plasticity throughout life. Prenatal alcohol produces changes that could interfere with the establishment of effective thresholds for plasticity. A substantial literature exists showing that early rearing experience has a powerful influence on the development of anatomical and functional features of the brain, such that enriched environmental stimulation increases total brain weight and cortical thickness (Krech et al., 1960; Diamond, 1986). More detailed analysis at a cellular level evolved from these experiments and cellular improvements have been documented that include increased cortical synapse-to-neuron ratio and increased frequency of dendritic branching, among others (for review, see Greenough, 1986; Beaulieu and Colonnier, 1987).
On the basis of these results, we used the enriched rearing conditions as an intervention to reverse fetal ethanol effects. The deficits need to be measured with sensitive quantitative methods that can detect subtle improvements in cortical function. We provide evidence that cortical function is impaired by specific criteria into adulthood after PAE and that enriched rearing conditions do improve cortical function, yet without restoring excitability and rates of synaptic modification to control levels.
MATERIALS AND METHODS
All procedures used in these experiments were approved by the Institutional Animal Use Committee and followed guidelines set by National Institutes of Health and the Society for Neuroscience.
Animals
We used Long–Evan rats for this study. Data are included from 37 experimental (seven PAE litters) and 28 control (seven litters) animals. All animals were 3 months old when the brain analyses were performed.
Procedure for feeding alcohol to experimental animals using the BioServ liquid diet
The method used to expose the fetal brain to alcohol throughout gestation has been used in a number of previous studies (Lieber and DeCarli, 1989; Miller, 1989; Lee et al., 1994; Spuhler-Phillips et al., 1997) because it mimics the consumption of moderate levels of alcohol each day during pregnancy [the calculation has been made that 6.5% alcohol in a rat's diet is roughly equivalent to a woman drinking two six-packs of 12 oz. bottles of beer per day throughout pregnancy (Miller, 1986)]. Starting with a nutritionally complete formula from BioServe Corporation, pregnant Long–Evans rats were fed a diet with increasing concentrations of ethanol until at the end of the first week they were receiving 6.5% vol/vol alcohol in their daily diet, which provided ∼35% of their daily calories from the alcohol. The animals were weighed and fed every day, and consumption of diet was recorded. Experimental and control diets continued for 20 d after conception. The blood alcohol concentration taken at 4 hr after the daily diet was offered (diet was given during the dark period of the 12 hr light/dark cycle) averaged 133 mg/dl.
Pair-fed controls. Because alcohol exposure at this level is expected to reduce food intake somewhat, a pair-fed group was run in parallel to control for nutritional deficiencies. After mating, a sperm-positive, pair-fed female rat was carefully weight-matched to its alcohol-receiving counterpart. The pair-fed animal was one that was found to be sperm positive 1 d after the alcohol-treated dam with which it is paired, so that its duration of gestation is always 1 d behind. This allows the food consumption of the alcohol animal to be determined on a given day so that a comparable amount can be given to the pair-fed animal on the corresponding and equivalent day of pregnancy for both animals. Pair-fed animals were treated in every way like their alcohol-treated counterparts except that they did not receive any alcohol. Chow-fed animals are our standard condition, and we have a large database for comparison.
Litters. As the pregnant rats approached parturition, they were monitored carefully several times a day. When the litter was delivered, the number and condition of pups was determined (litter size ranged from 11 to 13). Birth weights were recorded. These data were used for determining whether there are differences in litter size and birth weight. The litters were then randomly culled to eight pups for uniformity in nursing and care.
Analysis of cortical responses to sensory stimuli and plasticity changes
The procedures used to induce plasticity and measure single-unit responses have been described in detail in Armstrong-James et al. (1994) and Rema et al. (1998a). The following is a brief synopsis of these methods.
Whisker pairing. “Whisker pairing” (WP) is a procedure used to measure the status of plasticity in adult rat somatosensory cortex. In experimental and control animals, whiskers on the left side of the face were left intact, whereas all but two whiskers on the right side of the face were clipped to the level of the fur for periods of 1–30 d. Such animals are defined as “whisker-paired animals for x days”; e.g., trim on day 0 and record 72 hr later would be a 3 d whisker-paired animal. For these studies two whiskers, D2 and D1, in the same row were left intact. The whiskers were cut daily up to 2 d before recording. At the start of the recording session all whiskers were trimmed to the same length (3–5 mm) for applying test stimuli. Typically experimental animals were caged in plastic rat cages with at least one normal littermate during the intervals between the initial whisker clipping and the start of the experimental recording session. They appear to use the intact, paired whiskers to palpate, explore, and “whisk” in the normal manner.
Electrophysiology. All animals were anesthetized with intraperitoneal injection of urethane, 1.5 gm/kg body weight (30% solution in water) for recording. The animals were placed in a stereotaxic apparatus, and their body temperature was maintained at 36–37°C using a rectal thermistor coupled to an electronically controlled heating pad. Barrel cortex (typically ∼0–4 mm caudal to Bregma and ∼4–7 mm lateral to midsagittal) was exposed on the left hemisphere.
Action potentials were recorded using carbon-fiber microelectrodes (Armstrong-James and Millar, 1979). A three-dimensional microdrive was used to control the x-y position of the penetrations and the z-axis depth from the cortical surface. Single units were isolated with a time-amplitude window discriminator (Bak Electronics), and each accepted action-potential waveform was compared with the original waveform template on a digital storage oscilloscope (Nicolet). Presumptive localization of the D2 barrel was made by finding neurons in layer IV that generated a response to stimulation of the D2 (principal) whisker at <10 msec latency. Confirmation that those neurons were in penetrations through the D2 barrel was performed histologically before they were included in this study.
Whiskers were stimulated by deflecting individual whiskers 300 μm upward for 3 msec duration with a computer-controlled piezoelectric “bimorph” stimulator positioned with a micromanipulator just beneath the whisker. Each block of trials consisted of 50 stimuli delivered at 1 Hz. For all the neurons analyzed, one block of stimulus trials was presented to the principal whisker D2 and to each of its immediate surround whiskers (D1, D3, C2, E2). For the sake of brevity, in many figures only the D-row whiskers D2, D1, and D3 are shown because they define the rate of cortical synaptic plasticity.
Data analysis. Poststimulus time histograms (PSTHs) at 1 msec bin resolution were generated on-line using a CED 1401 plus processor (Cambridge Electronic Design) and PC computer (Compaq), and all data on the timing of action potentials were stored on a hard disk for off-line analysis. The magnitude of responses evoked from each whisker was the mean ± SE of 50 trials delivered at 1 Hz. For all forms of PSTH analysis, the counts in each bin were adjusted for spontaneous activity by subtracting the spikes generated 50 msec before the stimulus. For determining the significance of responses, nonparametric statistical analysis of the data were performed using Wilcoxon matched-pair sign rank test (Wilcoxon) and Mann–WhitneyU (MWU) test.
Locating the recording sites. At the end of every experiment a DC current of 2 μA for 5–10 sec (electrode tip positive) was passed to produce an easily identifiable lesion roughly 50 μm in diameter to mark the recording site. In most cases the lesions were made at two or three depths along the penetration to determine the electrode path along the column. If penetrations were 100 μm apart the alternate penetrations were marked with a lesion, and unmarked penetrations were determined by geometric interpolation. At the end of the recording session the animals were perfused with 4% paraformaldehyde, and the brains were cryoprotected in 20% sucrose. The cortex was separated from the rest of the brain and flattened. Cytochrome oxidase staining was performed on tangential sections of the flattened cortex to locate the position of the electrode penetrations. Only neurons located within the D2 barrel column were included in the data for this study.
Enriched environment rearing
Our “enriched” rearing environment for a rat consisted of a large (36 × 36 × 30 inch) cage made of one-half inch wire mesh with a pan underneath to catch droppings and urine. Ladders to three platforms with food available on the top level made the environment highly three-dimensional. The bottom of the large cage was covered with toys of various sizes, shapes, and chewability. The rat pups were sexed, and different cages were used for each sex. Equal numbers of PAE (typically six) and control animals (typically six) were placed into the enriched environment chamber from P21 to P90 to permit social as well as spatial challenges. The animals were introduced into the environment each day at the beginning of a 12 hr dark cycle, during which time the room was illuminated with a dim red light bulb just bright enough to allow videotaping of behavior to determine that the animals were using the environment and not, for example, huddling in the corner. During the 12 hr light cycle, animals were housed two to a cage in standard plastic cages. Sets of toys were changed in the chambers before each day to provide maximum novelty. An easily accessible dish of food was placed on the floor of the chamber until the animals were 1 month old. Daily weighing and observation confirmed that by P30 the animals were able to feed from an overhead hopper placed at the top of the chamber.
Analysis of glutamate receptors
Immunocytochemistry. Immunocytochemical analysis was performed on four brains after the physiological analysis using the methods described in Rema and Ebner (1996), with slight modifications. Rats were anesthetized with sodium pentobarbital and then perfused transcardially with PBS for 1–2 min to clear the blood, followed by 4% paraformaldehyde for 20–30 min to fix the tissues. Brains were removed and cryoprotected sequentially with 10, 20, and 30% sucrose. Coronal sections, 30 μm thick, were cut on a sliding microtome. The sections were washed four times (15 min for each wash) with Tris-buffered saline (TBS), then incubated in 3% normal serum for 2 hr at room temperature for blocking the nonspecific reaction. Primary antibody to NR1 (AB59) that recognizes all NR1 splice variants was added to the sections in blocking solution and incubated at 4°C for 48–72 hr. The sections were washed in TBS (four washes, each for 10 min) and then incubated with biotinylated secondary antibody for 1–2 hr at room temperature. After another four washes in TBS, the sections were incubated in ABC reagent (Vector Laboratories, Burlingame, CA) for 90 min at room temperature and washed again. The sections were finally rinsed in 25 mm Tris buffer and reacted for chromogenic detection of peroxidase, with diaminobenzidine and H2O2 as substrates.
Western blot analysis. Western blot analyses of proteins from membrane-enriched particulate fractions of somatic sensory cortices of control and PAE rats were performed with antibodies to NR1 (AB59) (Rema and Ebner, 1996), NR2A, and NR2B (PharMingen, San Diego, CA) using the method described in Rema and Ebner (1996). Iodinated secondary antibodies were used to detect bands and to aid in quantitation. The bands from the immunoblot were quantified using a phosphorimager and the Imagequant system. The density of bands was converted to percentage values where the counts of the band from control was set at 100%. The values of bands from the PAE animals were percentage of control value.
RESULTS
Effect of PAE on cortical neuron responsiveness
Recording from single neurons in adult cortex after PAE is a silent process compared with controls. The audiomonitor silence reflects a ∼70% reduction in the mean spontaneous activity of all cells recorded in PAE cortex compared with controls (control = 0.94 ± 0.12 vs PAE = 0.28 ± 0.05) even after 90 d of recovery (Fig. 1B). This overall reduction in spontaneous activity is produced by a lower percentage of spontaneously active cells in PAE cortex (control = 76% vs PAE = 38%) as well as a lower discharge rate of the cells that do show spontaneous activity (control = 1.26 ± 0.06 Hz vs PAE = 0.27 ± 0.05 Hz). As the electrode is advanced through PAE cortex, very few neurons can be isolated by their spontaneous discharge under urethane anesthesia. Whisker pairing elevated the level of spontaneous discharge by 14 d in PAE animals with a significant increase (p = 0.0001 MWU) compared with PAE animals with no whisker pairing. At this time the layer V neurons showed a higher level of spontaneous activity than neurons in the other cortical layers (layer V = 1.10 ± 0.3 Hz, layer IV = 0.22 ± 0.05 Hz, layer II/III = 0.19 ± 0.06 Hz). Responsive neurons could be identified in most penetrations by advancing the electrode in 100 μm increments and manually stimulating the whiskers to evoke responses from neurons near the electrode. Examples of single D2 barrel neuron PSTHs generated by stimulation of the principal whisker (D2) and one in-row surround whisker (D1) before any whisker trimming in PAE and control animals are shown in Figure 1C.
Fig. 1.

A, Diagram of the recording paradigm that involves stimulation of the whiskers in the periphery, transmission through synapses in the brainstem and thalamus, and recording the responses of single neurons in the D2 barrel column.B, Bar graph shows the significant (p = 0.001) 70% reduction in level of spontaneous activity in prenatal alcohol-exposed (PAE) neurons (black bar, n = 60 cells) as compared with pair-fed control animals (stippled bar,n = 51 cells) after 90 d of standard rearing.C, Poststimulus time histograms of typical layer IV barrel neuron responses from control and PAE animals before any whisker trimming. The response to the principal D2 whisker shows the characteristic short latency excitation followed by an inhibitory trough, and then a longer latency component of the response. Note that the long latency response is almost eliminated in the histograms from the PAE animal after stimulation of both the principal D2 whisker and the surround D1 whisker. Other surround whiskers produced PSTH profiles qualitatively similar to this sample response to stimulation of the D1 whisker.
Even evoked responses are reduced by a significant 80% after PAE, and the PSTHs illustrate that the effect is exerted almost exclusively by absence of the longer latency components of the response after stimulation of either the principal D2 or the in-row surround D1 and D3 whiskers (Fig. 1C).
The magnitude of the PAE deficits are clearly demonstrated in the mean response levels of all of the neurons studied from PAE and control animals. The data for Figure 2 are derived from several animals from different litters after test stimuli were applied to the principal whisker and four surround whiskers. In both PAE and control animals the principal whisker always produces a response with the highest magnitude and the shortest latency (Fig.2).
Fig. 2.

Bar graph showing mean responses of D2 barrel column neurons from control and PAE animals to 50 test stimuli sequentially applied to each of five whiskers at 1 Hz (recording at P90). D2 is the principal whisker and D1, D3, C2, and E2 are four surround whiskers in the receptive field of the cortical neurons. Different shading indicates different poststimulus latency epochs, as identified in the inset. Prenatal alcohol exposure reduces the responses of cortical neurons to all whiskers tested by >80%. Note that the response to the D2 whisker remains greater than the surround whiskers after alcohol exposure caused by the 3–10 msec short latency response of the D2 whisker, which is not reduced by prenatal ethanol exposure. The neurons are pooled (n = 60 for PAE andn = 51 for Control) from several animals and litters, and the standard errors are small (average SE for E = ±1, and average SE forC = ±2.4), but for simplicity the SE is not indicated on the bars.
The striking reduction in response to stimulation after PAE is seen at all latencies, except the shortest poststimulus epoch of 3–10 msec. Typically, only the principal whisker (in these studies, the D2 whisker) generates the shortest latency responses. Evidence is discussed below showing that the shortest latency response of cortical neurons reflects activity mainly in thalamocortical synapses, and this component of the cortical response remains intact in PAE animals when at the same time the longer latency responses are severely depressed. The response to the D-row surround whiskers, D1 and D3, nearly “bottomed out” in every epoch represented, because the surround whiskers produce little or no short latency activity in the cortical response.
Effect of PAE on cortical plasticity
Trimming all but the D2 and D1 whiskers induces a predictable modification of responses in the D2 barrel neurons to test stimuli delivered to D-row and other whiskers: a type of response modification we call whisker-pairing plasticity. In control animals, within 3 d the responses to the principal D2 whisker remain unaltered, but responses to the intact surround D1 whisker significantly increase, whereas those to the cut D3 whisker remain unaltered or are slightly reduced in magnitude (compare Figs. 2 and3A).
Fig. 3.
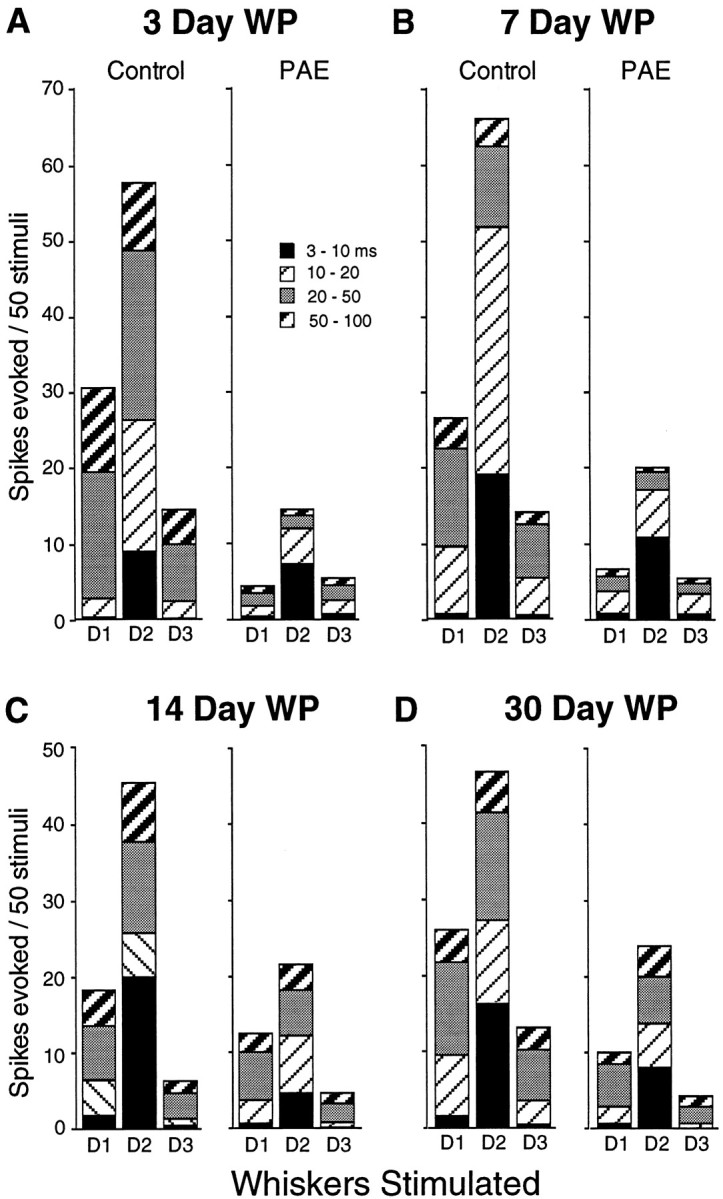
Comparison of responses to three D-row whiskers in control and PAE animals after 3 d (A), 7 d (B), 14 d (C), and 30 d (D) of WP. WP plasticity (D1/D3 ratio changed from 1:1 before WP to >2:1 after WP) is highly significant after <3 d in control animals but is extremely delayed in the alcohol-exposed animals to 14 d. The mean response magnitude (spikes/50 stimuli) of D2 barrel column neurons to stimulation of the D2 whisker increased significantly after 7 d of whisker pairing in the control animals, and after 30 d in the PAE animals.
Magnitude of response to the principal D2 whisker increases significantly (peaks) by 7 d after trimming in control animals and then returns to near initial levels after 14 and 30 d. In contrast, the low level of cortical responses to the D2 whisker in non-whisker-paired PAE animals decreases even further after 3 d of whisker pairing (Figs. 2, 3, 4) and slowly recovers at 7–14 d to show significant increase by 30 d (p = 0.012) (Figs. 3, 4). Overall in PAE animals the responses to the D1, D2, and D3 whiskers remain severely reduced from 3 to 30 d after whisker pairing (note that 30 d whisker-paired animals are 4 months old at the time of recording) (Fig. 3). D2 responses of PEA animals never attain more than ∼50% of control levels. In the PAE animals the paired D1 whisker responses fail to show the expected increase after 3 and even 7 d of whisker pairing, but finally, by 14 d of whisker pairing the D1 whisker musters a greater response than the D3 (cut) whisker, so that the D-paired/D-cut surround whisker ratio is changed significantly (p = 0.0001, Wilcoxon), as shown in Figures3C and 4B. Responses to the cut D-3 whisker stay depressed for the entire 30 d period of whisker pairing (Fig. 4C). Subtracting the average spikes generated by the cut D3 whisker from those produced by the intact D1 whisker highlights the negative effect of alcohol over time on this type of cortical plasticity (Fig. 4D).
Fig. 4.

Evolution of changes in the responses of D2 barrel neurons to stimulation of the principal D2 whisker (A), the paired D1 whiskers (B), and the cut D3 surround whiskers (C). After 3 d of WP, the change in response levels to D2 stimulation is reversed in PAE animals (A) such that the WP reduces the D2 whisker response significantly (p = 0.0142, MWU) followed by a gradual rise to show significant increase in response at 30 d (p = 0.0122, MWU). In the controls, the maximum response is reached at 7 d of WP and by 14 d attains a new steady state at a lower level.B, Responses to the paired D1 whisker in PAE animals show a significant increase (p = 0.0001, MWU) after 14 d (asterisks). C, Responses to cut D3 stimulation remain consistently low and do not change significantly over time. D, Difference in the mean response magnitudes (spikes/50 stimuli) of D2 column neurons to stimulation of paired D1 and cut D3 whisker (D1–D3) is another way to visualize the delay in surround whisker plasticity.
Effects of PAE on latency epochs of response
Examination of the latency epochs in the overall response magnitudes generated by the D-row whiskers in D2 barrel cortex neurons showed another dimension of how the challenge of whisker pairing alters cortical neuron responses over time (Fig. 3, shading on bar graph). After 3 d of whisker pairing the response to the D2 whisker decreased by 25% in the alcohol-exposed brains (compare Figs.3, 4). This lower response magnitude was the result of a lower response in the 3–10 and the 20–50 msec epochs (Fig. 3A) compared with the non-whisker-paired condition (Fig. 2). In 3 d controls, the expected 100% response increase to the intact D1 whisker reflected an increase in all latency components over the response generated by the cut D3 surround whisker. This activity-dependent plasticity did not occur in the PAE cortex after 3 d (Fig. 3A). There was even a trend for the response to the cut D3 whisker to be greater than the response to the active, intact whisker (p < 0.05, Wilcoxon). This profile of response was not grossly different after 7 d of whisker pairing (Fig. 3B). It took ∼14 d of the activity imbalance produced by whisker trimming for the alcohol-exposed neurons to first show plasticity, to the level of >2:1 ratio in the D1 (paired)/D3 (cut) response, the level seen within 3 d of whisker pairing in normal animals (i.e., surround whisker plasticity only occurred after 14 d). The significant increase in D2 response, which occurs by 7 d of WP in normal animals, took 30 d in PAE animals. The spikes in the increased response to the D1 and D2 whiskers all occur in the long (10–100 msec) latency epochs (Fig. 3, A vs C). The responses that the alcohol-exposed brains were able to produce after 14 d were maintained for 30 d, the duration of these experiments (Fig.3D).
Effect of PAE on fast- and slow-spiking neurons
The effects of prenatal alcohol exposure on cortical activity could be exerted on excitatory neurons with spiny dendrites or on inhibitory neurons with few if any spines on their dendrites that use GABA as a neurotransmitter. The data did not directly answer this question, but the total population of neurons can be sorted by their spike duration, which has been shown consistently to have a high correlation: fast spikes <0.75 msec are characteristic of GABAergic neurons, whereas longer (regular or slow) spikes are typical of excitatory neurons [see discussion by Rema et al. (1998a)]. Figure5 shows that in both the fast- and slow-spiking neuron populations in PAE animals there is (1) the generalized decrement in response, and (2) significant shift in the D1/D3 ratio occurs after 14 d. However, the degree of shift (i.e., the D1 (paired)/D3 (cut) ratio) is greater for the slow-spiking neurons at 14 d (D1 = 11.3 ± 4.3 vs D3 = 2.5 ± 1.5) than it is for the fast-spiking neurons (D1 = 7.1 ± 1.8 vs D3 2.7 ± 1.0) (Fig. 5, 14 Day WP). Thus, the slow-spiking cells show greater upregulation of the paired D1 whisker response, with little change in the cut D3 whisker response.
Fig. 5.
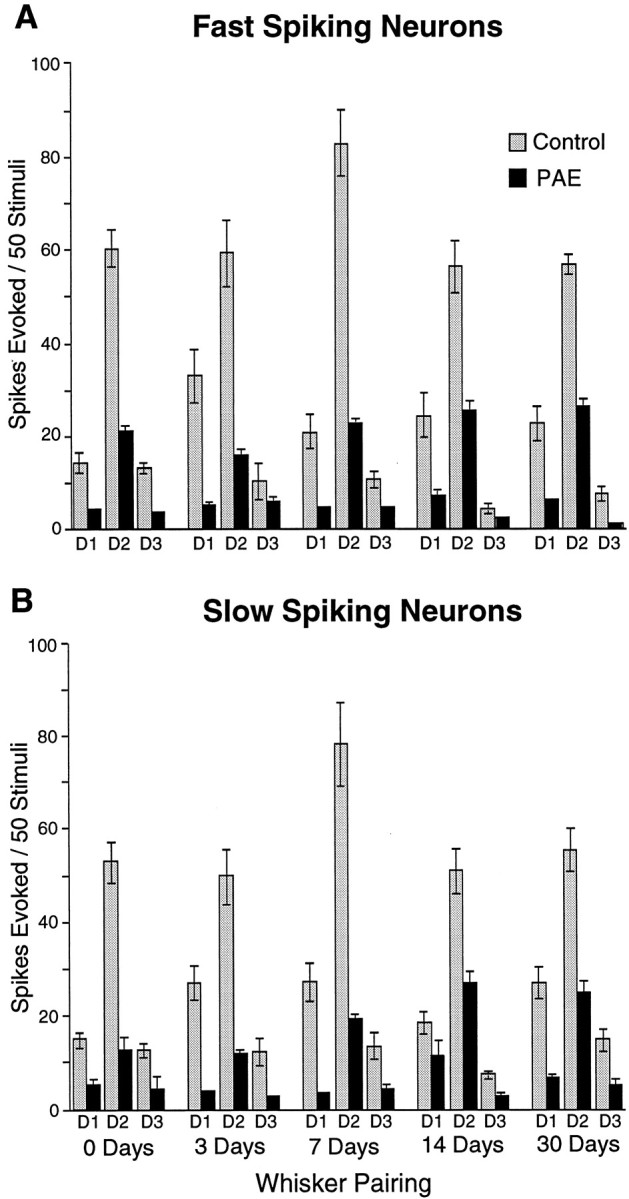
Comparison of responses of fast (<0.75 msec) and slow (>0.75 msec) spiking D2 barrel neurons of alcohol-exposed and control animals. Only layer IV neurons were included because the proportion of fast-spiking neurons recorded in other layers was much smaller. Both neuron types showed reduced response magnitudes in PAE animals. Synaptic plasticity demonstrated by a significant increase in responses to the paired D1 whisker occurred at 14 d in both neuron types (p = 0.0007 and 0.0069, Wilcoxon, for fast- and slow-spiking neurons, respectively) in the PAE animals and is maintained at 30 d for the fast-spiking neurons (p = 0.0005, Wilcoxon) but not for the slow-spiking neurons (p = 0.1319, Wilcoxon). Standard error on the bars without error markers is too small to be seen at this scale.
Effect of PAE on individual neurons that constitute the sample
The mean response of PAE and control groups to test stimuli applied to the intact D1 and the cut D3 whiskers masks the variability of individual neurons that contribute to the averaged response. Figure6 shows the response of every D2 barrel neuron in our sample to the D-row surround whiskers D1 and D3 before (normal) and after 7 d (control and PAE) whisker pairing. In normal animals, without the challenge of whisker pairing, roughly equal numbers of the D2 barrel neurons respond better to each of the surround D-row whiskers D1 and D3 (Fig. 6, D1>D3=49%). Because the neurons were from several different penetrations, animals, and litters, the response may be somewhat biased by the position of the electrode in the D2 barrel, although all penetrations have been confirmed histologically to be in the D2 barrel column (Armstrong-James et al., 1994). As examples, the unfilled arrow in Figure 6 points to a neuron that responded best to the D1 whisker, whereas thefilled arrow points to a neuron in which the D3 whisker provides the stronger input in a normal animal. Recasting the responses to the D1 and D3 whiskers separately by magnitude of response (Sort by Mag.) helps visualize the symmetry of the surround whisker influence on D2 barrel neurons before whisker pairing, although the opposing bars are no longer from the same neuron. Seven days of whisker pairing in control animals skewed the distribution toward the intact D1 whisker so that 81% of the D2 barrel neurons respond at a higher level to the intact D1 whisker, which confirms the expected shift to the active intact whisker. The triple arrow points to three neurons that still have a better response to the cut D3 whisker after whisker trimming in a control animal. Thus, after 1 week not every neuron was driven more intensely by the greater activity in the intact surround whisker, but the trend toward intact D1 whisker dominance is highly significant (p = 0.0001, Wilcoxon) (Fig. 6).
Fig. 6.

Comparison of response magnitudes of individual neurons in the D2 barrel column to stimulation of D1 and D3 whiskers in normal animals (i.e., whiskers not trimmed) (A), diet control animals after 7 d of whisker pairing (D1 and D2 were paired) (B), and PAE animals after 7 d of whisker pairing (D1 and D2 were paired) (C). Theleft column (Sort by Cell) of each pair of bars represents the response of each neuron to stimuli to the D1 (striped bars) and D3 (black bars) whiskers, and they are sorted arbitrarily in descending order by the magnitude of D1 responses to illustrate how each neuron varied in its response. Neurons in all layers and with all spike durations were included in the sample. In the right column of each pair (Sort by Mag), the neurons were sorted independently by the magnitude of response to D1 and D3. Thus, the Sort by Mag. column no longer represents the responses of single neurons, but this procedure greatly enhances visualization of the symmetry or asymmetry of the responses of the two surround whiskers before and after whisker pairing in the entire sample of neurons. The numbers for each pair of columns indicate the percentage of neurons that responded better to one or the other whisker. The PAE animals showed no significant shift toward the intact D1 surround whisker after 7 d. The width of the individual bars was determined by the number of neurons in the sample displayed in a column of fixed length. The magnitude of response was truncated above 50 spikes/50 stimuli. Theopen arrow points to a neuron that responded best to D1 whisker, and the closed arrow points to a neuron with stronger response to D3 whisker in the normal animal. The triple arrow points to three neurons that still had better responses to the cut D3 whisker in control animals after 7 d of whisker pairing. The x-axis is the response level in spikes/50 stimuli for the D1 and D3 whisker.
Prenatal alcohol exposure, even after 3 months of recovery, left the neurons not only low in response magnitude after 7 d of whisker pairing, but unexpectedly strengthened the inputs to quite a number of neurons to the inactive, trimmed whisker. For this reason, although the overall values remain roughly half (D1 > D3 = in 52% of cells) of the cortical neurons responding better to one or the other surround whisker, many neurons respond much better to the cut D3 whisker. It is noteworthy that in a certain sense this represents a type of plasticity that is still occurring, the unusual feature being that the shift is moving toward the low activity input. This phenomenon was obscured by averaging. However, when the responses were lined up by magnitude they formed a very symmetrical distribution, denying a shift in the population toward either the intact D1 or the cut D3 surround whisker after 7 d of whisker pairing. The failure of shifting at 7 d but its presence at 14 d supports the conclusion that the expected shift toward the active surround whisker (plasticity) is abnormally slow in PAE animals.
Effect of PAE on neurons in different layers of cortex
Another question raised by averaging responses from all neurons sampled is whether there is specificity of effect on neurons in different layers. One rationale for examining layer responses would be that because of the preservation of the short latency responses to the principal D2 whisker, the layer IV neuron responses that receive a high density of the thalamocortical inputs may develop normally, and the failures could involve neurons in other layers that depend more heavily on intracortical inputs for their activation. Because layer IV neurons in the cortical barrels project almost exclusively to more superficial neurons in layer II/III (Kim and Ebner, 1999), neuron by neuron responses to whisker pairing in layer II/III neurons were separated and compared with responses of neurons in layer IV and layer V of PAE and control animals. Figure 7 shows that the changes in response to whisker pairing occur differently in different cortical layers. In PAE animals, layer II/III neurons showed that after 7 d there was already a significant (p < 0.015, Wilcoxon) shift toward the intact surround D-row whisker (D1). Layer IV neurons showed strong biases; 47% of neurons toward the paired D1 whisker and 37% toward the cut D3 whisker and the remaining neurons showed equal responses to both, but the mean response profile for layer IV neurons remains symmetrical, and hence without the expected bias toward the paired D1 whisker. Quite unexpectedly, the layer V neurons showed a better response to the cut D3 (53%) than to the paired D1 whisker (37%) (Fig. 7, bottom panels). Thus, after 7 d of whisker pairing in PAE animals, neurons in different layers were affected in strikingly different ways from that of controls: superficial layer neurons showed the expected plasticity, thalamic input-dominated layer IV neurons showed great variability in response to one or another whisker but no net plasticity yet, and the output neurons in layer V responded best to the inactive inputs. By 14 d there was significant shift toward the intact whisker by neurons in all layers.
Fig. 7.

Comparison of neurons in layers II/IIII, IV, and V to stimulation of the intact (paired) whisker D1 (gray bars) and cut whisker D3 (black bars) from 7 d control animals, compared with 7 and 14 d whisker-paired PAE animals. The shift to the intact surround D1 whisker was already significant (p < 0.015) at 7 d in layer II/III neurons. Layer IV neurons failed to show the shift to the paired whisker at 7 d, but most neurons in all layers shift by 14 d. The layer V PAE neurons showed the lowest response level and actually a shift toward the cut D3 whisker at 7 d, and then a shift toward the intact D1 whisker (expected response) at 14 d.WP, Whisker paired. Cell andMag. indicate neuron sorting as described in the Figure6 legend. x-axis is the response level in spikes per 50 stimuli. Responses with three spikes and less are not seen in the Figures because of the small scale, but neurons were represented to thebottom of the column.
Effect of enriched environment rearing on PAE cortex
The rate of whisker pairing plasticity can be influenced in normal animals by the levels of sensory activity present after the whiskers are trimmed, so a logical question is whether the environmental challenge of enriched rearing conditions from weaning to 3 months would reverse some or all of the deficits seen after prenatal alcohol exposure. In control animals the main effect of enriched rearing conditions was to accelerate the increase in response to the D2 whisker to peak levels as early as 3 d instead of 7 d of whisker pairing (Fig. 8). In the alcohol-exposed group, enriched rearing increased the response magnitude to each individual whisker and accelerated the rate of whisker pairing plasticity so that there was an overall shift toward the intact D1 whisker at 7 d (p < 0.002, Wilcoxon) (Fig. 8), although equivalent neurons in PAE animals in a standard environment would show the plasticity changes only after 14 d. The effects of enrichment indicate that the low cortical activity levels caused by the alcohol did not eliminate plasticity but rather created conditions under which much greater activity was required to reach the threshold for modification, and this was partially achieved by increased environmental challenge.
Fig. 8.
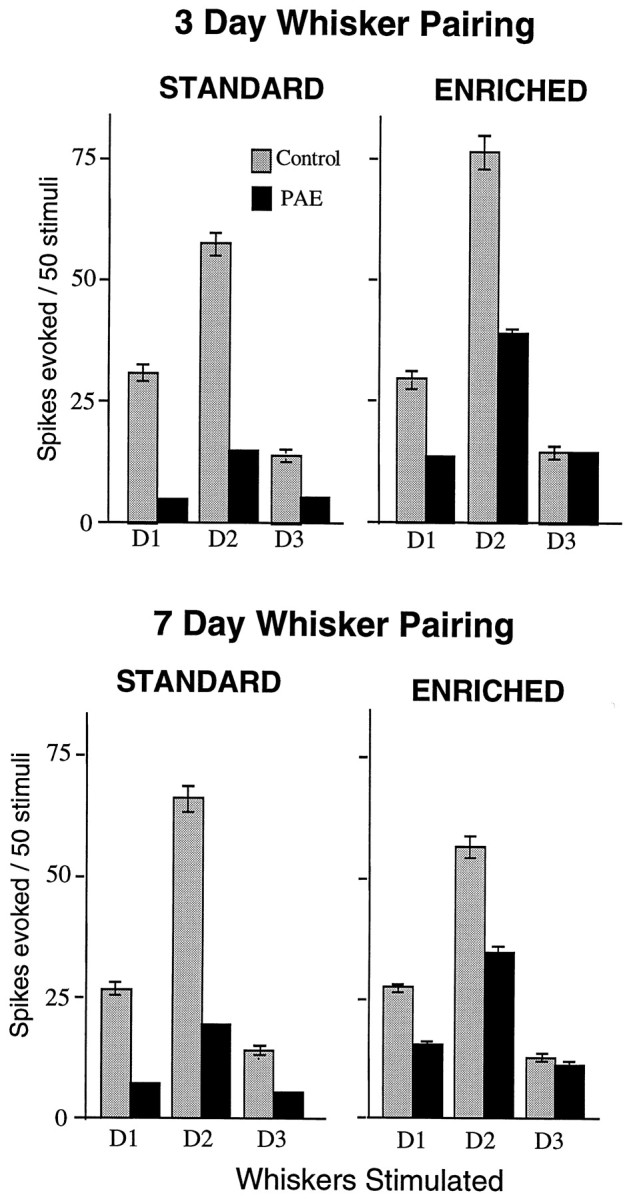
Comparison of responses to 3 and 7 d of whisker pairing after standard cage rearing with responses in animals reared from weaning to P90 in an enriched and social environment. Enriched rearing significantly increased the responses of D2 barrel neurons after 3 d of whisker pairing in PAE animals but did not induce surround whisker plasticity. D1 is the intact whisker, and D3 is the cut whisker. Enriched rearing did produce a significant (p < 0.002) D1 (intact)/D3 (cut) shift at 7 d in PAE animals, when the standard reared animals showed no surround plasticity. Note that in control animals the enriched rearing accelerated the peak increase in the D2 whisker response from 7 to 3 d of whisker pairing.
The accelerated shift seen in PAE animals with enriched rearing experience was not reflected in all layers. Different layers responded differently to the enriched rearing (Fig.9). Enigmatically, the layer II/III neurons appeared to transiently “lose ground,” with a trend for the cut whisker to become a stronger drive on cortical neurons under enriched conditions. Layer IV was greatly affected by enriched rearing, such that the absence of 7 d plasticity after standard caged rearing was converted into a robust and significant shift (p = 0.0001, Wilcoxon) toward the active surround whisker after 7 d of whisker pairing under enriched rearing conditions. Layer V neurons do not show any significant shift to the intact whisker (p > 0.1, Wilcoxon) after 7 d of whisker pairing, even under enriched rearing conditions.
Fig. 9.

Layer-by-layer analysis of the effects of enriched rearing on cortical cell responses in PAE animals to stimulation of intact (paired) D1 (gray bars) and cut D3 (black bars) whiskers. After standard rearing and 3 d of whisker pairing, the layer II/III neurons show change, but “inappropriately” toward the cut D3 whisker. Standard rearing produces no significant change at 3 d in layer IV and V neurons. Enriched rearing increases the response level in neurons in all layers after 3 d of whisker pairing, but without any sign of shift in any layer. After 7 d of whisker pairing the layer II/III neurons again show the shift toward the cut D3 whisker, the layer IV neurons show the expected increase in responses to the intact D1 whisker, and the layer V neurons still show no significant shift.
Qualitative observation of videotapes taken as single-frame time-lapse exposures at 5 min intervals during one period of enriched experience each week suggested that the PAE animals were moving around and using the environment indistinguishably from control animals. The data did not allow us to determine whether they were learning from sensory experience and adapting to the environment differently from controls.
Status of NMDA receptors in PAE cortex
The findings above and the deficiency in longer latency, NMDA-dependent components of the evoked response led us to examine the status of NMDA receptors in the barrel field cortex of alcohol-exposed animals after they reached 3 months of age. Because the NMDAR1 subunit is the obligatory protein for a functional NMDA receptor calcium channel, immunocytochemistry was used to look for evidence of change. Levels of NMDAR1 immunoreactivity were visibly decreased in all layers of the somatic sensory cortex (Fig.10A). The staining in the neuropil of the supragranular layers that was densest in the control cases was markedly reduced after alcohol exposure, and the intense immunoreactivity of layer V neurons and their apical dendrites was reduced, as was the number of densely labeled neurons. Western blot analysis confirmed quantitatively that the levels of NMDAR1, NMDAR2A, and NMDAR2B proteins were reduced by ∼50, 40, and 30%, respectively (Fig. 10B,C). One of the AMPA receptor subunits, GluR1, was examined and found to be elevated rather than depressed (data not shown).
Fig. 10.
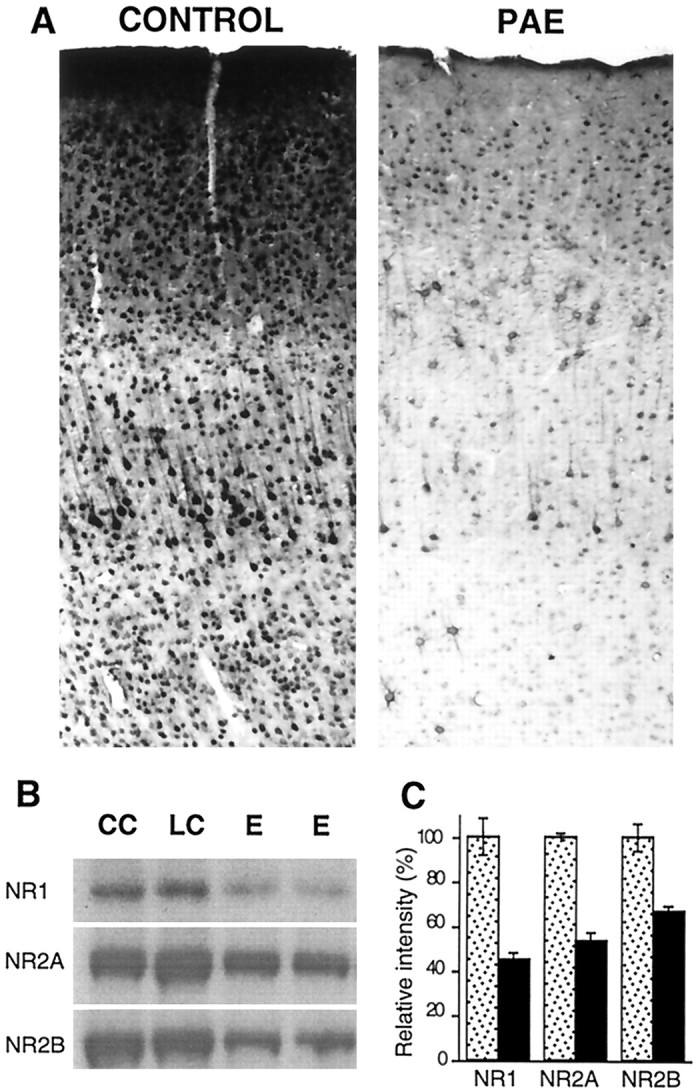
Analysis of NMDA receptor subunit levels after prenatal ethanol exposure. A, Immunohistochemical staining of the somatic sensory cortex from control and PAE rats with NR1 antibody AB59 showing a reduction in NMDAR1 protein in all layers. B, Western blot analyses of proteins from a membrane-enriched fraction of somatic sensory cortices of chow control (CC), liquid diet control (LC), and prenatal alcohol exposed (E) rats with antibodies to NR1(AB59), NR2A, and NR2B. Iodinated secondary antibodies were used to detect bands and to aid in quantification. C, The bands from the immunoblot were quantified using a phosphorimager, and the relative intensity refers to the values calculated by assigning arbitrary values of 100% to the controls.
DISCUSSION
The central finding of these experiments was that the normal functioning and the capacity to reorganize in the somatic sensory cortex are severely impaired by prenatal alcohol exposure for at least 3 months after birth under standard laboratory rearing conditions. The deficits were characterized by low levels of all types of spontaneous and long latency cortical activity. The preserved, 3–10 msec short latency responses were typically produced only by stimulation of the principal whisker. In normal animals these short latency responses are almost completely dependent on AMPA-type glutamate receptors, and the longer latency (10–100 msec) responses depend mostly on the NMDA type of glutamate receptor (Armstrong-James et al., 1993; Rema et al., 1998a), so the suppression of long latency responses in PAE rats may be related to the reduction in NMDA receptors.
Effect of PAE on cortical plasticity
Theoretically there is a carefully modulated balance between excitation and inhibition in adult cortex that maintains the excitability needed for processing new sensory inputs and for plasticity and learning (Xing and Gerstein, 1996; Shadlen and Newsome, 1998). The low levels of spontaneous and driven cortical neuron excitability in the PAE animals could be produced by a decrease in excitation, by excessive inhibition, or both. Several reports suggest that there are direct negative impacts of PAE on inhibitory processes. For example, the inhibition expected after paired-pulse stimulation at short interstimulus intervals in hippocampal CA1 neurons is minimal or absent after PAE (Hablitz, 1986). At comparably short (20 msec) interstimulus periods, inhibition has been shown to be maximal in barrel field cortex (Simons, 1985). The reduced inhibition after PAE appears to be attributable in part to impairment of GABAA1 receptor subunit-mediated inhibition (Allan et al., 1998). The linkage between PAE and deficits in inhibition, and whether the effect of prenatal alcohol is on only certain subtypes of GABAergic neurons, such as those that contain high levels of certain calcium-binding proteins, is not yet clear. Parvalbumin-containing GABAergic neurons, for example, are reduced by 45% in the cingulate gyrus of alcohol-exposed rats (Moore et al., 1998), but it is not yet known whether this is true for parietal cortex as well.
Indirect effects of PAE on activity levels, and hence on plasticity, could arise through insufficient activity to induce activity-dependent aspects of cortical development that occur postnatally. Low activity just after birth could add a “sensory deprivation” type of plasticity deficit (Huang and Ebner, 1995) on top of the direct, residual alcohol effects, and the combination of the two insults could prolong or consolidate the alcohol-induced deficits in cortical function (Ebner et al., 1998). Similar plasticity deficits in the hippocampus may share this etiology (Swartzwelder et al., 1988).
Effect of PAE on neurons in different layers of cortex
Previous studies have shown that whisker-pairing plasticity occurs at different rates in different cortical layers. Within 24 hr significant changes occur in layer II/III, before any plasticity is detectable in layer IV (Diamond et al., 1994). This rate of plasticity is accelerated by high levels of activity, so that enriched environment rearing conditions for only 15 hr after whisker pairing is enough to produce significant synaptic modification in layer IV neurons (Rema et al., 1998b). Early sensory deprivation, on the other hand, slows equivalent cortical plasticity to 3–7 d (Huang and Ebner, 1995). In the present study the effect of PAE on the rate of plasticity was even greater. Layer IV and layer V neurons in PAE animals did not shift to the intact surround whisker after 7 d of whisker pairing under standard cage conditions, but could be induced to do so by enriched rearing conditions. However, the enriched rearing did not restore plasticity in any layer after 3 d of whisker pairing, so restoration of the rate of synaptic change to normal levels was not complete.
Another noteworthy feature of the laminar analysis was the reverse bias of the layer II/III neurons after 3 d of whisker pairing and for layer V neurons after 7 d of whisker pairing in the PAE animals. This type of “anti-Hebbian” reversal of plasticity such that the synaptic strengths related to the inactive inputs are increased has been reported under several conditions in previous studies. The clearest example occurred when muscimol, a GABA agonist, was minipumped onto kitten visual cortex during monocular experience, and the cortical neurons changed their responses such that the closed eye inputs became stronger than the open eye inputs (Reiter and Stryker, 1988). Our interpretation of this effect is consistent with theirs: postsynaptic neuron activity is crucially important for activity-dependent strengthening of active synapses.
A similar reversal has been reported after acetylcholine (ACh) depletion, where the cut whisker inputs became stronger than the intact surround whisker inputs in the whisker-pairing paradigm (Baskerville et al., 1997; Sachdev et al., 1998). The low spontaneous activity seen after PAE could create a condition analogous to the muscimol application or ACh depletion, causing the inactive whisker to achieve greater strength, but we also show that the depressed responsiveness can be overcome. The results confirm that the superficial layers are most sensitive to changes in levels of activity caused by whisker pairing even in PAE animals, but they produce “anti-Hebbian” plasticity after 3 d of whisker pairing attributable to the developmental impairments. By 7 d, layer II/III neurons shifted to show the expected Hebbian modifications. Similar changes occur in deep layer neurons but at a slower rate; i.e., at 7 d more neurons responded to the cut (inactive) whisker and by 14 d they shifted to the active input. Layer IV neurons took 14 d to show a shift to the active whisker under standard conditions but were speeded up by enriched rearing. A global anti-Hebbian shift toward the inactive whiskers has never been witnessed in normal animals, before the expected activity-driven change, but the possibility exists that it occurs in some layers as a normal prelude to the bias toward the active whisker, but for a very transient (and easily overlooked) period. To our knowledge, there is currently no evidence showing the functional effect of anti-Hebbian plasticity on cortical information processing or a molecular explanation of its pathogenesis.
Abnormal neuron migration is a prominent feature of PAE in laboratory animals and humans; i.e., some neuronal cell bodies end up in the “wrong” layer (Miller et al., 1990; Miller, 1997) or on the cortical surface, or they are delayed in arriving in their appropriate layer (Clarren et al., 1978; Miller, 1986). The extent of abnormal cell migration depends on the time and amount of alcohol exposure. In light of the demonstrated importance of NMDA receptors on cortical neuron migration (Komuro and Rakic, 1993), migration abnormalities could be one early consequence of the reduction in NMDA receptors demonstrated here. The point to note is that when the “responses of 50 neurons in layer II/III” are described in this paper, it is not known what percentage of those cells have mismigrated into those laminae and how that would influence the results. We assume that the number of mismigrated neurons in our sample is small enough that they would not change the mean values for a given lamina but might increase the variance.
Effect of enriched environment rearing on PAE cortex
Enriched rearing does increase the responsiveness and plasticity of cortical neurons significantly after PAE, although not up to control levels. This partial improvement in cortical cell responsiveness indicates that the enhanced sensory and social challenge cannot completely restore cortical plasticity after PAE. Similar enhancement of performance in PAE animals has been reported after enriched rearing, such as improvements in motor skills, compared with animals reared alone in a cage (Hannigan et al., 1993). The environmental enrichment increased the density of dendritic spines on the apical and basal dendrites of control animals, but it failed to increase spine density in the PAE animals (Berman et al., 1996). This result appears at odds with the results of Miller et al. (1990) in which a single subclass of neuron, corticospinal neurons, showed a 32% increase in spine density in PAE animals with simple cage rearing, although many spines took on odd shapes and in some cases the cell bodies had migrated to the wrong layer in cortex. The possibility exists that the enriched environment would reduce the exuberant number of spines in these PAE neurons and move them toward or below normal densities, but such experiments have not been reported. The failure of an enriched environment to completely restore plasticity suggests that additional mechanisms that are less dependent or independent of neural activity are affected by prenatal alcohol exposure.
Other demonstrated regulators of whisker-pairing plasticity in normal animals are the modulatory neurotransmitters acetylcholine and norepinephrine (Lu et al., 1996; Sachdev et al., 1998). After cholinergic depletion there is only a slight reduction in spontaneous activity and in the response of cortical cells to whisker stimulation, but a profound failure of whisker-pairing plasticity that persists for as long as the animals were tested (Baskerville et al., 1997; Sachdev et al., 1998). A reduction of AChE-positive axons in the cortex has been reported in PAE animals (Miller and Rieck, 1993), but the functional impact of PAE on cholinergic mechanisms has not been studied in detail. In addition to direct actions of PAE on cholinergic neurons and the receptors in cortex, indirect actions could be exerted by reducing cholinergic enhancement of calcium entry through NMDA receptors (Auerbach and Segal, 1992). Other modulatory neurotransmitters have shown transient decreases after PAE. Dopamine and D1 receptor binding sites were reduced in frontal cortex and striatum after PAE, whereas at the same time the same features of D2 receptors remained unaffected (Druse et al., 1990).
Status of NMDA receptors in PAE cortex
NMDA-type glutamate receptor levels increase after birth (Insel et al., 1990), and this late developing feature of cortex and hippocampus predicts that the greatest impact of alcohol on NMDA mechanisms would be produced by exposure that occurs during the last part of gestation.Savage et al. (1992) indeed showed that alcohol exposure throughout gestation reduces the NMDA-sensitive glutamate binding sites in the postnatal hippocampus. The change in receptor binding was not present if the exposure was restricted to the first half of gestation, but it was equal in magnitude to exposure throughout gestation if the alcohol was given only during the last one-half to last one-third of pregnancy. These results indicate that the vulnerability of the developing brain to some of the more subtle effects of alcohol exposure on plasticity mechanisms is high in the perinatal period. Furthermore, the results predict that the pathogenesis of decreased neuronal function after PAE is in part channeled through the demonstrated decrease in calcium entry through NMDA receptors (Dildy and Leslie, 1989; Hoffman et al., 1989;Lee et al., 1994; Spuhler-Phillips et al., 1997).
Hippocampal NMDA receptor binding is significantly reduced in PAE animals at ∼6 weeks postnatal (Savage et al., 1991). NMDA-evoked excitability is also reduced in hippocampal slices from PAE animals (Morrisett et al., 1989). Spuhler-Phillips et al. (1997) showed that PAE reduced NMDA-stimulated increases in intracellular calcium. However, when they analyzed membrane fractions from the forebrain (everything in front of the midbrain) of rats exposed to prenatal ethanol in a procedure similar to the present studies using a monoclonal antibody to NR1, they found no significant difference in NR1 subunit protein compared with control group on P0 and P21 (Spuhler-Phillips et al., 1997). These results and those of Hughes et al. (1998) are different from the present results. One methodological difference was that a membrane-enriched particulate fraction was prepared from only somatic sensory cortex at P90 in these experiments, and there was a decrease in NR1, NR2A, and NR2B. For NR1 analysis a polyclonal antibody prepared in our lab was used (Rema and Ebner, 1996). Sample area (barrel field cortex vs forebrain) or age at the time of analysis (P90 vs P0 to P21) or the type of antibody (polyclonal vs monoclonal) could influence these differences.
We have not yet determined whether the accelerated plasticity of enriched rearing has any effect on upregulation of NMDAR1 expression, but the results highlight the importance of understanding the development of NMDAR subunit expression and assembly into functional receptors during normal development. Insights into this feature of normal development are complicated by the NMDAR1 subunit being translated in eight splice variant forms that have different properties and show different distributions within a cortical neuron (Ehlers et al., 1995; Zukin and Bennett, 1995). Alcohol could alter the ratio of splice variants. Furthermore, the subunit composition of functional NMDA receptor changes during development (Monyer et al., 1994; Sheng et al., 1994). Changes in this feature of NMDA receptor function would not be detected even if the total subunit protein were restored to control levels. Given the effect of PAE on NMDA receptor function, it seems likely that normalization of NMDA receptors in PAE animals may provide a promising strategy for restoring cortical plasticity and perhaps intellectual function. One direction we are pursuing to further enhance plasticity is to use a partial agonist to the glycine binding site of the NMDA receptor channel (Lovinger and Zieglgansberger, 1996) during the period of enriched activity to pharmacologically elevate the function of the NMDA receptors in conjunction with the environmental challenge.
Relevance to fetal alcohol syndrome in children
There has been little controversy since the first reports of Jones et al. (1973) that PAE affects brain function in children as well as in animal models. One unique advantage of model systems is the ability to control other aspects of the animal's life, so that the effects of alcohol are not confounded by concurrent malnutrition, other abused substances, neglect, and other sequelae of poverty as is most often the case in humans (Abel, 1995; Abel and Hannigan, 1995). Many of the structural changes found in animal studies also have been reported in human neuropathology, such as smaller than normal head and brain size (Mattson and Riley, 1995) and failure of cell migration and malformations (Clarren et al., 1978). The intellectual disabilities persist, with little improvement in children diagnosed with fetal alcohol syndrome (FAS) and fetal alcohol effects (Streissguth et al., 1996).
Some data from children with fetal alcohol syndrome are comparable to the present single-unit analysis. Kaneko et al. (1996) using noninvasive resting EEG analysis in FAS children found greatly reduced power in the α frequency band (7.5–12 Hz) without a correlated increase in slow wave activity as was found in their comparison of children with Down syndrome. One problem with interpreting this result is that it does not distinguish deficits in early processing in sensory systems from predominant dysfunction in “associative/cognitive” areas less dominated by one sensory modality. Evoked or event-related potential studies would help resolve this issue. Measurement of visual evoked potentials in children exposed to prenatal alcohol and other drugs showed delayed maturation in components of the visual evoked potential (Scher et al., 1998). Similar changes in event-related potentials in the hippocampus were detected in rats after prenatal ethanol exposure (Kaneko et al., 1996). We think that interesting new insights could arise from correlating noninvasive EEG analysis in PAE children with comparable EEG/single-unit analysis from experimental preparations, so that cross-comparisons could be made before and after interventions. For the most useful comparison, the animal studies would need to be performed in awake animals to eliminate the effects of anesthesia.
All of these data were collected under urethane anesthesia, and there is no way of evaluating whether the impact of the anesthetic was greater on responses evoked in impaired PAE cortex than those evoked in control cortex. Because anesthesia may be a key variable, studies are being performed to reproduce the experiments using awake animals with chronically implanted electrodes to measure the effect of anesthesia, which has been shown to be a potent variable for sensory information processing in our model system (Chapin et al., 1981; Chapin and Lin, 1984; Simons et al., 1992; Friedberg et al., 1999).
Footnotes
This work was supported in part by National Institutes of Health Grants NS13031 and NS25907 and a generous gift from Irwin and Annette Eskind. We thank Mark Maguire and Anita Sankaran for help with alcohol exposure of the rats and histology, and Dr. Michael Armstrong-James for critical comments on this manuscript.
Correspondence should be addressed to V. Rema, P.O. Box 152, Peabody College, Institute for Developmental Neuroscience, Vanderbilt University, Nashville, TN 37203. E-mail:rema.velayudhan@vanderbilt.edu.
REFERENCES
- 1.Abel EL. An update on incidence of FAS: FAS is not an equal opportunity birth defect. Neurotoxicol Teratol. 1995;17:437–443. doi: 10.1016/0892-0362(95)00005-c. [DOI] [PubMed] [Google Scholar]
- 2.Abel EL, Hannigan JH. Maternal risk factors in fetal alcohol syndrome: provocative and permissive influences. Neurotoxicol Teratol. 1995;17:445–462. doi: 10.1016/0892-0362(95)98055-6. [DOI] [PubMed] [Google Scholar]
- 3.Allan AM, Paxton LL, Savage DD. Prenatal ethanol exposure alters the modulation of the GABA A1 receptor-gated chloride ion channel in adult rat offspring. J Pharmacol Exp Ther. 1998;284:250–257. [PubMed] [Google Scholar]
- 4.Armstrong-James M. The functional status and columnar organization of single neurons responding to sensory stimulation in neonatal rat somatosensory cortex. J Physiol (Lond) 1975;246:501–538. doi: 10.1113/jphysiol.1975.sp010902. [DOI] [PMC free article] [PubMed] [Google Scholar]
- 5.Armstrong-James M, Millar JM. Carbon fibre microelectrodes. J Neurosci Methods. 1979;1:279–287. doi: 10.1016/0165-0270(79)90039-6. [DOI] [PubMed] [Google Scholar]
- 6.Armstrong-James M, Welker E, Callahan CA. The contribution of NMDA and non-NMDA receptors to fast and slow transmission of sensory information in the rat SI barrel cortex. J Neurosci. 1993;13:2149–2160. doi: 10.1523/JNEUROSCI.13-05-02149.1993. [DOI] [PMC free article] [PubMed] [Google Scholar]
- 7.Armstrong-James M, Diamond ME, Ebner FF. An innocuous bias in whisker use in adult rat modifies receptive fields of barrel cortex neurons. J Neurosci. 1994;14:6978–6991. doi: 10.1523/JNEUROSCI.14-11-06978.1994. [DOI] [PMC free article] [PubMed] [Google Scholar]
- 8.Auerbach JM, Segal M. Acetylcholine enhances NMDA evoked calcium rise in hippocampal neurons. Brain Res. 1992;587:83–87. doi: 10.1016/0006-8993(92)91430-m. [DOI] [PubMed] [Google Scholar]
- 9.Baskerville KA, Schweitzer JB, Herron P. Effects of cholinergic depletion on experience-dependent plasticity in the cortex of the rat. Neuroscience. 1997;80:1159–1169. doi: 10.1016/s0306-4522(97)00064-x. [DOI] [PubMed] [Google Scholar]
- 10.Beaulieu Y, Colonnier M. The effect of the richness of the environment on the cat visual cortex. J Comp Neurol. 1987;266:483–492. doi: 10.1002/cne.902660404. [DOI] [PubMed] [Google Scholar]
- 11.Berman RF, Hannigan JH, Sperry MA, Zajac CS. Prenatal alcohol exposure and the effects of environmental enrichment on hippocampal dendritic spine density. Alcohol. 1996;13:209–216. doi: 10.1016/0741-8329(95)02049-7. [DOI] [PubMed] [Google Scholar]
- 12.Chapin JK, Lin CS. Mapping the body representation in the S1 cortex of anesthetized and awake rats. J Comp Neurol. 1984;229:199–213. doi: 10.1002/cne.902290206. [DOI] [PubMed] [Google Scholar]
- 13.Chapin JK, Waterhouse BD, Woodward DJ. Differences in cutaneous sensory response properties of single somatosensory cortical neurons in awake and halothane anesthetized rats. Brain Res Bull. 1981;6:63–70. doi: 10.1016/s0361-9230(81)80069-x. [DOI] [PubMed] [Google Scholar]
- 14.Clarren SK, Alvord EC, Sumi SM, Streissguth AP, Smith DW. Brain malformations related to prenatal exposure to ethanol. J Pediatr. 1978;92:64–67. doi: 10.1016/s0022-3476(78)80072-9. [DOI] [PubMed] [Google Scholar]
- 15.Diamond MC. Enriching heredity: the impact of the environment on the anatomy of the brain. Free Press; New York: 1986. [Google Scholar]
- 16.Diamond ME, Armstrong-James M, Ebner FF. Experience-dependent plasticity in adult rat barrel. Proc Natl Acad Sci USA. 1993;90:2082–2086. doi: 10.1073/pnas.90.5.2082. [DOI] [PMC free article] [PubMed] [Google Scholar]
- 17.Diamond MD, Huang W, Ebner FF. Laminar comparison of somatosensory cortical plasticity. Science. 1994;265:1885–1888. doi: 10.1126/science.8091215. [DOI] [PubMed] [Google Scholar]
- 18.Dildy JE, Leslie SW. Ethanol inhibits NMDA-induced increases in free intracellular Ca2+ in dissociated brain cells. Brain Res. 1989;499:383–387. doi: 10.1016/0006-8993(89)90789-0. [DOI] [PubMed] [Google Scholar]
- 19.Druse MJ, Tajuddin N, Kuo A, Connerty M. Effects of in utero ethanol exposure on the developing dopaminergic system in rats. J Neurosci Res. 1990;27:233–240. doi: 10.1002/jnr.490270214. [DOI] [PubMed] [Google Scholar]
- 20.Ebner FF, Rema V, Huang W. Effects of early experiences on development of cortical plasticity. Soc Neurosci Abstr. 1998;24:636. [Google Scholar]
- 21.Ehlers MD, Tingley WG, Huganir RL. Regulated subcellular distribution of the NR1 subunit of the NMDA receptor. Science. 1995;269:1734–1737. doi: 10.1126/science.7569904. [DOI] [PubMed] [Google Scholar]
- 22.Friedberg MH, Lee SM, Ebner FF. Modulation of receptive field properties of thalamic somatosensory neurons by the depth of anesthesia. J Neurophysiol. 1999;81:2243–2252. doi: 10.1152/jn.1999.81.5.2243. [DOI] [PubMed] [Google Scholar]
- 23.Greenough WT. What's special about development? Thoughts on the bases of experience-sensitive synaptic plasticity. In: Greenough WT, Juraska JM, editors. Developmental neuropsychobiology. Academic; New York: 1986. pp. 387–407. [Google Scholar]
- 24.Hablitz JJ. Prenatal exposure to alcohol alters short-term plasticity in hippocampus. Exp Neurol. 1986;93:423–427. doi: 10.1016/0014-4886(86)90203-7. [DOI] [PubMed] [Google Scholar]
- 25.Hannigan JH, Berman RF, Zajac CS. Environmental enrichment and the behavioral effects of prenatal exposure to alcohol. Neurotoxicol Teratol. 1993;15:261–266. doi: 10.1016/0892-0362(93)90007-b. [DOI] [PubMed] [Google Scholar]
- 26.Hoffman PL, Rabe CS, Moses F, Tabakoff B. N-methyl-d-aspartate receptors and ethanol: inhibition of calcium flux and cyclic GMP production. J Neurochem. 1989;52:1937–1940. doi: 10.1111/j.1471-4159.1989.tb07280.x. [DOI] [PubMed] [Google Scholar]
- 27.Huang W, Ebner FF. The influence of early whisker sensory deprivation on cortical plasticity in the adult rat. Soc Neurosci Abstr. 1995;21:123. [Google Scholar]
- 28.Hughes PD, Kim YN, Randall K, Leslie SW. Effect of prenatal ethanol exposure on the developmental profile of the NMDA receptor subunits in rat forebrain and hippocampus. Alcohol Clin Exp Res. 1998;22:1255–1261. [PubMed] [Google Scholar]
- 29.Insel TR, Miller LP, Gelhard RE. The ontogeny of excitatory amino acid receptors in rat forebrain—I. N-methyl-d-aspartate and quisqualate receptors. Neuroscience. 1990;35:31–43. doi: 10.1016/0306-4522(90)90117-m. [DOI] [PubMed] [Google Scholar]
- 30.Jones DG. Influence of ethanol on neuronal and synaptic maturation in the central nervous system: morphological investigations. Prog Neurobiol. 1988;12:171–196. doi: 10.1016/0301-0082(88)90034-2. [DOI] [PubMed] [Google Scholar]
- 31.Jones KL, Smith DW, Ulleland CN, Streissguth AP. Pattern of malformation in offspring of chronic alcoholic mothers. Lancet. 1973;1:1267–1271. doi: 10.1016/s0140-6736(73)91291-9. [DOI] [PubMed] [Google Scholar]
- 32.Kaneko WM, Phillips EL, Riley EP, Ehlers CL. EEG findings in fetal alcohol syndrome and Down syndrome children. Electroencephalogr Clin Neurophysiol. 1996;98:20–28. doi: 10.1016/0013-4694(95)00189-1. [DOI] [PubMed] [Google Scholar]
- 33.Kim U, Ebner FF. Barrels and septa: separate circuits in rat barrel field cortex. J Comp Neurol. 1999;408:489–505. [PubMed] [Google Scholar]
- 34.Komuro H, Rakic P. Modulation of neuronal migration by NMDA receptors. Science. 1993;260:95–97. doi: 10.1126/science.8096653. [DOI] [PubMed] [Google Scholar]
- 35.Krech D, Rosenzweig MR, Bennett EL. Effects of environmental complexity and training on brain chemistry. J Comp Physiol Psychol. 1960;53:509–519. doi: 10.1037/h0045402. [DOI] [PubMed] [Google Scholar]
- 36.Lee YH, Spuhler-Phillips K, Randall PK, Leslie SW. Effects of prenatal ethanol exposure on NMDA-mediated calcium entry into dissociated neurons. J Pharmacol Exp Ther. 1994;271:1291–1298. [PubMed] [Google Scholar]
- 37.Lieber CS, DeCarli LM. Liquid diet technique of ethanol administration: 1989 update. Alcohol. 1989;24:197–211. [PubMed] [Google Scholar]
- 38.Lovinger DM, Zieglgansberger W. Interactions between ethanol and agents that act on the NMDA-type glutamate receptor. Alcohol Clin Exp Res. 1996;20:187A–191A. doi: 10.1111/j.1530-0277.1996.tb01773.x. [DOI] [PubMed] [Google Scholar]
- 39.Lovinger DM, White G, Weight FF. Ethanol inhibits NMDA-activated ion current in hippocampal neurons. Science. 1989;243:1721–1724. doi: 10.1126/science.2467382. [DOI] [PubMed] [Google Scholar]
- 40.Lovinger DM, White G, Weight FF. NMDA receptor-mediated synaptic excitation selectively inhibited by ethanol in hippocampal slice from adult rat. J Neurosci. 1990;10:1372–1379. doi: 10.1523/JNEUROSCI.10-04-01372.1990. [DOI] [PMC free article] [PubMed] [Google Scholar]
- 41.Lu SM, Sachdev R, Picklo M, Robertson D, Ebner FF. Effects of norepinephrine (NE) depletion in the rat barrel cortex. Soc Neurosci Abstr. 1996;22:1357. [Google Scholar]
- 42.Mattson SN, Riley EP. Prenatal exposure to alcohol: what the images reveal. Alcohol Health Res World. 1995;19:273–278. [PMC free article] [PubMed] [Google Scholar]
- 43.Miller MW. Effects of alcohol on the generation and migration of cerebral cortical neurons. Science. 1986;233:1308–1311. doi: 10.1126/science.3749878. [DOI] [PubMed] [Google Scholar]
- 44.Miller MW. Development of projection and local circuit neurons in neocortex. In: Peters A, Jones EG, editors. Cerebral cortex, Vol 7. Plenum; New York: 1988. pp. 133–176. [Google Scholar]
- 45.Miller MW. Effects of prenatal exposure to ethanol on neocortical development: II Cell proliferation in the ventricular and subventricular zones of the rat. J Comp Neurol. 1989;287:326–338. doi: 10.1002/cne.902870305. [DOI] [PubMed] [Google Scholar]
- 46.Miller MW. Effects of prenatal exposure to ethanol on callosal projection neurons in rat somatosensory cortex. Brain Res. 1997;766:121–128. doi: 10.1016/s0006-8993(97)00533-7. [DOI] [PubMed] [Google Scholar]
- 47.Miller MW, Rieck RW. Effects of chronic ethanol administration on acetylcholinesterase activity in the somatosensory cortex and basal forebrain of the rat. Brain Res. 1993;627:104–112. doi: 10.1016/0006-8993(93)90753-a. [DOI] [PubMed] [Google Scholar]
- 48.Miller MW, Chiaia NL, Rhoades RW. Intracellular recording and injection study of corticospinal neurons in the rat somatosensory cortex: effect of prenatal exposure to ethanol. J Comp Neurol. 1990;297:91–105. doi: 10.1002/cne.902970107. [DOI] [PubMed] [Google Scholar]
- 49.Monyer H, Burnashev N, Laurie DJ, Sakmann B, Seeburg PH. Developmental and regional expression in the rat brain and functional properties of four NMDA receptors. Neuron. 1994;2:529–540. doi: 10.1016/0896-6273(94)90210-0. [DOI] [PubMed] [Google Scholar]
- 50.Moore DB, Quintero MA, Ruygrok AC, Walker DW, Heaton MB. Prenatal ethanol exposure reduces parvalbumin-immunoreactive GABAergic neuronal number in the adult rat cingulate cortex. Neurosci Lett. 1998;249:25–28. doi: 10.1016/s0304-3940(98)00378-4. [DOI] [PubMed] [Google Scholar]
- 51.Morrisett RA, Swartzwelder HS. Attenuation of hippocampal long-term potentiation by ethanol: a patch-clamp analysis of glutamatergic and GABAergic mechanisms. J Neurosci. 1993;13:2264–2272. doi: 10.1523/JNEUROSCI.13-05-02264.1993. [DOI] [PMC free article] [PubMed] [Google Scholar]
- 52.Morrisett RA, Martin D, Wilson WA, Savage DD, Swartzwelder HS. Prenatal exposure to ethanol decreases the sensitivity of the adult rat hippocampus to N-methyl-d-aspartate. Alcohol. 1989;6:415–420. doi: 10.1016/0741-8329(89)90013-x. [DOI] [PubMed] [Google Scholar]
- 53.Reiter HO, Stryker MP. Neural plasticity without postsynaptic action potentials: less-active inputs become dominant when kitten visual cortical cells are pharmacologically inhibited. Proc Natl Acad Sci USA. 1988;85:3623–3627. doi: 10.1073/pnas.85.10.3623. [DOI] [PMC free article] [PubMed] [Google Scholar]
- 54.Rema V, Ebner FF. Immunolocalization of NMDA receptors in the rat somatic sensory pathways. J Comp Neurol. 1996;368:165–184. doi: 10.1002/(SICI)1096-9861(19960429)368:2<165::AID-CNE1>3.0.CO;2-1. [DOI] [PubMed] [Google Scholar]
- 55.Rema V, Armstrong-James M, Ebner FF. Experience-dependent plasticity of adult rat S1 cortex requires local NMDA receptor activation. J Neurosci. 1998a;18:10196–10206. doi: 10.1523/JNEUROSCI.18-23-10196.1998. [DOI] [PMC free article] [PubMed] [Google Scholar]
- 56.Rema V, Armstrong-James M, Jenkinson EW, Ebner FF. Short-term enriched experience potentiates whisker-pairing plasticity of barrel cortex neurons in adult rats. Soc Neurosci Abstr. 1998b;24:635. [Google Scholar]
- 57.Sachdev RS, Lu SM, Wiley RG, Ebner FF. The role of the basal forebrain cholinergic projection in somatosensory cortical plasticity. J Neurophysiol. 1998;79:3216–3228. doi: 10.1152/jn.1998.79.6.3216. [DOI] [PubMed] [Google Scholar]
- 58.Savage DD, Montano CY, Otero MA, Paxton LL. Prenatal ethanol exposure decreases hippocampal NMDA-sensitive [3H]-glutamate binding site density in 45-day-old rats. Alcohol. 1991;8:193–201. doi: 10.1016/0741-8329(91)90806-8. [DOI] [PubMed] [Google Scholar]
- 59.Savage DD, Queen SA, Sanchez CF, Paxton LL, Mahoney JC, Goodlett CR, West JR. Prenatal ethanol exposure during the last third of gestation in rat reduces hippocampal NMDA agonist binding site density in 45-day-old offspring. Alcohol. 1992;9:37–41. doi: 10.1016/0741-8329(92)90007-w. [DOI] [PubMed] [Google Scholar]
- 60.Scher MS, Richardson GA, Robles N, Geva D, Goldschmidt L, Dahl RE, Sclabassi RJ, Day NL. Effects of prenatal substance exposure: altered maturation of visual evoked potentials. Pediatr Neurol. 1998;18:236–243. doi: 10.1016/s0887-8994(97)00217-8. [DOI] [PubMed] [Google Scholar]
- 61.Shadlen MN, Newsome WT. The variable discharge of cortical neurons: implications for connectivity, computation, and information coding. J Neurosci. 1998;18:3870–3896. doi: 10.1523/JNEUROSCI.18-10-03870.1998. [DOI] [PMC free article] [PubMed] [Google Scholar]
- 62.Sheng M, Cummings J, Roldan LA, Jan YN, Jan LY. Changing subunit composition of heteromeric NMDA receptors during development of rat cortex. Nature. 1994;368:144–147. doi: 10.1038/368144a0. [DOI] [PubMed] [Google Scholar]
- 63.Simons DJ. Temporal and spatial integration in the rat SI vibrissa cortex. J Neurophysiol. 1985;54:615–635. doi: 10.1152/jn.1985.54.3.615. [DOI] [PubMed] [Google Scholar]
- 64.Simons DJ, Carvell GE, Hershey AE, Bryant DP. Responses of barrel cortex neurons in awake rats and effects of urethane anesthesia. Exp Brain Res. 1992;91:259–272. doi: 10.1007/BF00231659. [DOI] [PubMed] [Google Scholar]
- 65.Spuhler-Phillips K, Lee YH, Hughes P, Randoll L, Leslie SW. Effects of prenatal ethanol exposure on brain region NMDA-mediated increase in intracellular calcium and the NMDAR1 subunit in forebrain. Alcohol Clin Exp Res. 1997;21:68–75. [PubMed] [Google Scholar]
- 66.Streissguth AP, Bookstein FL, Barr HM. Dose- response study of the enduring effects of prenatal alcohol exposure: birth to 14 years. In: Spohr HL, Steinhausen HC, editors. Alcohol, pregnancy and the developing child. Press Syndicate of the University of Cambridge; Cambridge, UK:: 1996. pp. 141–168. [Google Scholar]
- 67.Swartzwelder HS, Farr KL, Wilson WA, Savage DD. Prenatal exposure to ethanol decreases physiological plasticity in the hippocampus of the adult rat. Alcohol. 1988;5:121–124. doi: 10.1016/0741-8329(88)90008-0. [DOI] [PubMed] [Google Scholar]
- 68.Trevisan L, Fitzgerald LW, Brose N, Gasic GP, Heinemann SF, Duman RS, Nestler EJ. Chronic ingestion of ethanol up-regulates NMDAR1 receptor subunit immunoreactivity in rat hippocampus. J Neurochem. 1994;62:1635–1638. doi: 10.1046/j.1471-4159.1994.62041635.x. [DOI] [PubMed] [Google Scholar]
- 69.West JR, Kelly SJ, Pierce DR. Severity of alcohol-induced deficits in rats during the third trimester equivalent is determined by the pattern of exposure. Alcohol Alcohol Suppl. 1986;1:461–465. [PubMed] [Google Scholar]
- 70.Xing J, Gerstein GL. Networks with lateral connectivity I, II, III. J Neurophysiol. 1996;75:184–232. doi: 10.1152/jn.1996.75.1.184. [DOI] [PubMed] [Google Scholar]
- 71.Yuen GL, Patil M, Durand D. Effects of ethanol on the excitability of hippocampal granule neurons. Brain Res. 1991;563:315–320. doi: 10.1016/0006-8993(91)91554-e. [DOI] [PubMed] [Google Scholar]
- 72.Zukin RS, Bennett MVL. Alternatively spliced isoforms of the NMDAR1 receptor subunit. Trends Neurosci. 1995;18:306–313. doi: 10.1016/0166-2236(95)93920-s. [DOI] [PubMed] [Google Scholar]