

Abstract
The proliferation of microglia is a normal process in CNS development and in the defense against pathological insults, although, paradoxically, it contributes to several brain diseases. We have examined the types of voltage-activated K+ currents (Kv) and their roles in microglial proliferation. Microglia were tissue-printed directly from the hippocampal region using brain slices from 5- to 14-d-old rats. Immediately after tissue prints were prepared, unipolar and bipolar microglia expressed a large Kv current, and the cells were not proliferating. Surprisingly, this current was biophysically and pharmacologically distinct from Kv1.3, which has been found in dissociated, cultured microglia, but it was very similar to Kv1.5. After several days in culture the microglia became highly proliferative, and although the Kv prevalence and current density decreased, many cells exhibited a prominent Kv that was indistinguishable from Kv1.3. The Kv1.5-like current was present in nonproliferating cells, whereas proliferating cells expressed the Kv1.3-like current. Immunocytochemical staining showed a dramatic shift in expression and localization of Kv1.3 and Kv1.5 proteins in microglia: Kv1.5 moving away from the surface and Kv1.3 moving to the surface as the cells were cultured. K+ channel blockers inhibited proliferation, and the pharmacology of this inhibition correlated with the type of Kv current expressed. Our study, which introduces a method for the physiological examination of microglia from identified brain regions, demonstrates the differential expression of two functional Kv subunits and shows that a functional delayed rectifier current is necessary for microglia proliferation.
Keywords: tissue printing, brain slice, Kv channels, neuroimmune cells, glial cells, cell proliferation, channel expression, channel localization
Microglia are macrophage-like cells of the CNS. They are normally beneficial, producing growth factors, protecting the CNS against pathogens, and phagocytosing cellular debris from neurons and glia that are removed during development. However, because microglia rapidly activate after CNS injury and can be surprisingly damaging, it is important to selectively control their detrimental functions (for review, see Gehrmann et al., 1995; Streit and Kincaid-Colton, 1995; Kreutzberg, 1996; Perry and Gordon, 1997). Microglia are distributed throughout the brain cortex, but some regions have higher numbers (Lawson et al., 1990). Particularly interesting is their abundance in the hippocampus, which is highly susceptible to cerebrovascular insults that rapidly activate microglia (Wu and Ling, 1998). They are present from embryonic to adult stages but at higher density in the adult (Milligan et al., 1991; Wu et al., 1993; Ogura et al., 1994), attributable in part to proliferation after birth. Because microglia proliferation is one outcome of CNS injury (Gehrmann et al., 1995; Streit and Kincaid-Colton, 1995), it is one function we are interested in controlling.
Roles of potassium channels in nonexcitable cells, including microglia, are not well understood, but some cells use K+ channels for proliferation (for review, see Dubois and Rouzair-Dubois, 1993; Lewis and Cahalan, 1995). The channels needed for proliferation have not been identified except in lymphocytes where Kv1.3 (Lewis and Cahalan, 1995) and a Ca2+/calmodulin-activated K+ channel (hSK4) (Khanna et al., 1999) are important. Although we have shown that microglia proliferation involves anion channels (Schlichter et al., 1996), roles of microglial K+ channels and their molecular identities are not known. Interestingly, Kv1.3 mRNA is present in cultured microglia. They express a current that resembles Kv1.3 both biophysically and pharmacologically (Norenberg et al., 1994; Schlichter et al., 1996; Eder, 1998), and there is some immunocytochemical evidence for Kv1.5 protein (Pyo et al., 1997; Jou et al., 1998).
The expression of Kv currents in microglia is highly variable, but the reasons for and the consequences of this variability are poorly understood. Almost all studies use cultured microglia from enzymatically dissociated neopallial tissue, thus removing cell–cell contacts and secretion products (e.g., growth factors from astrocytes) that might affect Kv expression. Here, we developed a “tissue print” method for studying microglia in vitro without enzymatic dissociation. Conventional hippocampal brain slices were first adhered to substrate-coated glass coverslips, then peeled away to isolate a monolayer of CNS cells that retained an organotypic distribution. Many of the microglia and astrocytes retained morphologies typical of those seen in vivo. Our goals were to characterize the Kv current in hippocampal microglia and determine whether it is involved in proliferation. Surprisingly, we found two Kv currents the prevalence of which changed in vitro and correlated with the cells' proliferative state. Kv1.3 and Kv1.5 protein were present, and the changes in current type corresponded with changes in their expression at the cell surface. Most significantly, both currents were involved in microglia proliferation, but their relative roles changed with time in culture.
Part of this work was published previously in abstract form (Kotecha and Schlichter, 1998).
MATERIALS AND METHODS
Preparing tissue prints. Wistar rats (Charles River, Quebec) were decapitated on postnatal days 5–14 (P5–14) in accordance with the Canadian Guidelines for Animal Care and Experimentation. After the head was sterilized in 75% ethanol for ∼10 sec, the brain was dissected aseptically into cold artificial CSF (aCSF, 4°C), which was bubbled with carbogen (95% O2, 5% CO2). During dissection, we used a low-Ca2+, high-Mg2+ sucrose aCSF (low-Ca2+ aCSF) that contained (in mm): 26 NaHCO3, 3.25 KCl, 0.1 CaCl2, 4 MgCl2, 1.25 KH2PO4, 10d-glucose, 200 sucrose, with a pH of 7.4 and osmolarity of 285 mOsm. All chemicals were from Sigma (St. Louis, MO) unless stated otherwise. The cerebellar lobes were removed, and the brain was attached with cyanoacrylate glue (cut surface down) to a cold metal block. Low-Ca2+ aCSF was perfused over the brain throughout the dissection, which was completed within 3 min. Carbogen bubbling was stopped briefly, and 200- to 250-μm-thick hippocampal slices were cut with a Vibratome (series 1000, Pelco Instruments, Aggwam, MA) directly into cold low-Ca2+ aCSF. In preparation for tissue printing, the hippocampal slices were transferred to sucrose aCSF that contained 1.5 mm calcium. The tissue print procedure was modified from Kotecha et al. (1997) to study microglia from the hippocampal formation. Each hippocampal slice was transferred to a pure nitrocellulose membrane (0.45-μm-diameter pores; Bio-Rad, Hercules, CA) that was inverted onto a sterile coverslip that had been coated with poly-l-lysine (1 mg/ml, >300,000 molecular weight) and rat-tail collagen (1.5 mg/ml). The coverslip was placed in a 35 mm Petri dish and briefly centrifuged (700 rpm, <1 min) before 2.5 ml culture medium was added; i.e., Minimum Essential Medium (MEM), 5% fetal bovine, 5% horse serum, and 50 μg/ml gentamycin (all from Life Technologies, Grand Island, NY). After they were incubated for at least 2 hr (95% O2, 5% CO2, 37°C), each hippocampal slice and nitrocellulose membrane was peeled away with fine forceps, leaving tissue-printed cells on the coverslip. These cells were either used the same day (zero days in culture, “0 DIC”) or cultured up for to 15 d, during which time ∼2 ml of medium was replaced by fresh culture medium every 2 d.
Purified microglia cultures. Highly purified microglia from neopallia of neonatal rat pups (P1–2) were prepared as described previously (Schlichter et al., 1996). Briefly, neopallial tissue was minced in cold MEM, transferred to a dissociation medium of MEM with 0.25% trypsin (Sigma) and 100 U/ml DNase I (Pharmacia Biotech, Toronto), then agitated (30 min, 37°C) using a magnetic stir plate, gently triturated, and agitated again. After dissociation, the mixture was pelleted, resuspended in MEM, passed through a cell strainer (40-μm-diameter holes), and seeded in 75 cm2 flasks in 30 ml of culture medium, as above. After 12 d in culture without feeding, the floating cells (>95% microglia) were transferred to a new flask and incubated for 1 hr at 37°C, and the adherent cells (98–100% microglia) were harvested. These cells were used for Western blot analysis to test for the presence of Kv1.3 and Kv1.5 proteins and for RT-PCR to assay for mRNA for several Kv channels.
Identifying microglia. Hippocampal tissue prints contained microglia, astrocytes, and fibroblasts. We used several markers to discriminate microglia in living or fixed tissue prints. OX-42 antibody binds to the CR3 complement receptor (Damoiseaux et al., 1994), and ED1 antibody (both from Vector, Burlingame, CA) is specific for a protein located on the membrane of lysosomes (Dijkstra et al., 1985). In the brain, both antigens are restricted to microglia (Dijkstra et al., 1985). Isolectin B4 (Sigma) binds to the external membrane of microglia at α-d-galactose residues (Streit et al., 1988), and because fluorescent-conjugated forms are available it can be used to label living or fixed cells. In fixed tissue, we stained astrocytes with an antibody directed against glial fibrillary acidic protein (anti-GFAP) (Sigma) and fibroblasts with anti-fibronectin antibody (Chemicon, Temecula, CA). Before labeling, tissue prints were washed with PBS using a standard protocol of three washes for 5 min each. Live microglia were labeled by incubating tissue prints for 20 min in a 1% solution of Texas Red-conjugated IB4 in PBS, followed by washing in PBS (3 times, 5 min each). When required, tissue prints were incubated for 20 min in cold methanol on dry ice (−20°C) to rapidly fix and permeabilize the cells. For antibody labeling, subsequent steps were performed at room temperature unless indicated. After the fixed tissue prints were washed in PBS they were incubated for several hours in 10% bovine serum albumin (BSA) or 10% skim milk as blocking agents. The primary monoclonal antibody, either OX-42 (1:200 dilution) or ED1 (1:100), was added in a 1% BSA solution and incubated overnight at 4°C. The tissue prints were then washed in 5% BSA, incubated for 3 hr in biotinylated rabbit anti-mouse secondary antibody (1:100, Vector), and washed again in 5% BSA. Finally, the fixed tissue prints were incubated for 1 hr in a 1% BSA solution containing FITC-conjugated streptavidin secondary antibody (1:100, Vector), then washed, first with 5% BSA and then with PBS. For each negative control, the primary antibody was omitted. All stained slides were treated with SlowFade (Molecular Probes, Eugene, OR) and stored in the dark at 4°C. To further reduce the background staining of regions devoid of microglia, multiple washes in a high concentration of blocking agent were performed.
In living tissue prints, microglia viability was determined with the LIVE/DEAD assay (Molecular Probes) in which calcein-AM accumulation and cleavage by cytosolic esterases label live cells and ethidium bromide labels the nuclei of dead cells. Tissue prints were washed with PBS, then incubated for 30 min in PBS containing 2.0 μmcalcein-AM and 4.0 μm ethidium bromide, and washed again with PBS. For analysis of cell phenotype, morphology, and viability, tissue prints were viewed using an inverted microscope (Olympus IMT-2) fitted with epifluorescence and Hoffman Modulation optics. Images were digitized using a CCD camera (Cohu, San Diego, CA) and Axon Imaging Workbench software (ver. 2.1, Axon Instruments, Foster City, CA).
Electrophysiology. Before recording, tissue prints on coverslips were washed several times in extracellular solution that contained (in mm): 125 NaCl, 5 KCl, 1 CaCl2, 1 MgCl2, 10 HEPES, pH 7.4 (adjusted with NaOH). The osmolarity (300 mOsm) was adjusted using sucrose and measured with a freezing point depression osmometer (model 3MO, Advanced Instruments, Norwood, MA). The pipette (intracellular) solution contained (in mm): 100 K-aspartate, 40 KCl, 1 MgCl2, 1 CaCl2 (15 nm free Ca2+), 10 HEPES, 2 K2ATP, 10 EGTA, pH 7.2 (adjusted with KOH), 300 mOsm. By eliminating the osmotic gradient, the volume-sensitive anion current (Schlichter et al., 1996) was reduced to <50 pA at voltages where Kv currents were active (remaining anion current can be seen in Fig. 2B). During patch-clamp recordings the small-volume bath chamber (150 μl) (Model RC-25, Warner Instruments, Hamden, CT) was continuously perfused at 1–2 ml/min using a gravity feed.
Fig. 2.

Voltage dependence of microglia Kv currents.A, Early culture (0–5 DIC): whole-cell currents from a bipolar microglia cell after 3 DIC, recorded during 500 msec steps (from −90 to +150 mV in 20 mV increments) from a holding potential of −100 mV. To ensure complete recovery from inactivation, successive voltage-clamp steps were separated by 60 sec. B, Steady-state inactivation was measured by varying the holding potential (−80 to +10 mV), waiting 2 min at each voltage, then applying a 100 msec test pulse to +30 mV. When the cell was held at potentials positive to −20 mV, there was no Kv current (a small anion current remains; see Materials and Methods). C, Average conductance versus voltage relations, calculated fromg =Ipeak/(V −EK), for activation and steady-state inactivation of Kv currents from early (0–5 DIC) and later cultures (6–10 DIC). The voltage dependencies were fitted to Boltzmann equations of the formg/gmax = 1/(1 + expV −V1/2/kn), from which the voltage for half-maximal activation (V1/2) and the slope factor (kn) were calculated. For 0–5 DIC cells: activation V1/2 −10.3 ± 2.6 and kn 13.9 ± 2.4 (n = 10), inactivationV1/2 −29.4 ± 2.4 andkn 8.8 ± 2.1 (n = 7). For 6–10 DIC cells (n = 8): activationV1/2 −27.1 ± 3.0 andkn 11.1 ± 3.1, inactivationV1/2 −38.2 ± 3.4 andkn 9.1 ± 3.8. D, Reversal potential (Erev) of the voltage-activated outward current indicates a high K+ selectivity. Each 50 msec step to +20 mV was followed by a test pulse between −50 and −130 mV (20 mV increments). The tail current reversed at −84 mV, which was essentially the same asEK (−86 mV) for the solutions used.
All patch-clamp recordings were made at room temperature (20–25°C) in the whole-cell configuration using an Axopatch 1D amplifier (Axon), and pipettes were pulled from borosilicate glass (WPI, Sarasota, FL). The patch-clamp circuit was used to filter the currents (5 kHz) and to compensate capacitive transients and series resistance, unless otherwise indicated. We did not compensate for “leakage” currents, so we could monitor changes in voltage- and time-independent currents, especially Cl− current. For most recordings the pipette resistance was 5–7.5 MΩ, and the maximal uncompensated series resistance error was 10 mV. For faster voltage clamping to determine current activation kinetics, we used thin-walled borosilicate glass (WPI) to pull 1–2 MΩ resistance pipettes. Voltages were applied, and currents were recorded using pCLAMP software (ver. 6.0, Axon) and Tecmar Labmaster data acquisition boards. Data were stored on computer and analyzed using Origin (ver. 5, Microcal, Northampton, MA). All reversal potentials and current versus voltage relations were corrected for junction potentials among the bath, pipette, and ground agar bridge solutions.
The pharmacological profile of the Kv currents was tested using the small-volume perfusion chamber with a three-port manifold, which required <30 sec for complete bath exchange. The broad-spectrum K+-channel blockers 4-aminopyridine (4-AP) and tetraethylammonium (TEA) were from Sigma. The peptide toxins (charybdotoxin, margatoxin, agitoxin-2) were obtained from Alomone Labs (Jerusalem, Israel), stored lyophilized at −20°C, then made up in extracellular solution containing 0.1% BSA to reduce drug adsorption onto perfusion lines or the glass-bottomed chamber. Current inhibition is expressed as mean ± SEM. Throughout this paper the statistical significance (p < 0.05) was tested using Student's t tests.
Proliferation assay. The same assay was used to determine the percentage of tissue-printed microglia that were proliferating at different times in culture and the proliferative state of individual microglia from which patch-clamp recordings were made: incorporation of the thymidine analog 5-bromo-2′-deoxyuridine (BrdU) into DNA. Before electrophysiological recordings, tissue prints were incubated in MEM containing 1 mg/ml BrdU substrate (12 hr, 95% O2, 5% CO2, 37°C). Then, during patch-clamp recording the pipette contained the fluorescent dye Lucifer yellow (0.4 mg/ml), which diffused into and marked the cell from which a recording was made. After characterizing the K+ currents in a microglia cell, the patch pipette was slowly withdrawn to allow healing and prevent dye loss, then the entire dish was fixed in cold methanol for 20 min (as above). The tissue print was washed (PBS, 3 times, 5 min each) and incubated in 4 m HCl for 20 min to fragment the DNA, thereby exposing BrdU sites. After five more washes in PBS to neutralize the pH, the tissue print was incubated (24 hr, 4°C) in a 1% skim milk solution containing a monoclonal anti-BrdU antibody (1:1000; Sigma). The tissue print was then washed with 5% skim milk, incubated with biotinylated anti-mouse secondary antibody (1 hr, 1:100 dilution; Vector), and washed again with 5% skim milk. Finally, the tissue print was incubated for 1 hr in a 1% BSA solution containing Texas Red–neutravidin-conjugated streptavidin antibody, washed with 5% BSA, then washed with PBS. The coverslip containing the stained tissue print was mounted on a glass slide and viewed under fluorescence optics, first with a FITC filter to locate the Lucifer yellow-filled cell, then with a Cy3 filter to determine whether the cell was BrdU positive.
To quantify microglia proliferation in tissue prints after 0, 5, and 10 DIC, BrdU substrate was added 12 hr before the cells were fixed, permeabilized, and labeled with anti-BrdU antibody (as above). For tissue prints grown for 5 and 10 DIC, the standard culture medium (with or without K+-channel blockers) was changed every 2 d. Microglia were surface-labeled by incubating for 20 min in a 1% solution of IB4 conjugated to FITC (Sigma), followed by washing (5 times) in PBS. A field of cells was viewed under an FITC filter to identify all microglia, then with a Cy3 filter to determine whether the nucleus stained with anti-BrdU antibody. The percentage of microglia that were proliferating was the proportion of IB4-positive cells with anti-BrdU-positive nuclei.
Immunocytochemical labeling of Kv1.5 and Kv1.3 proteins on tissue-printed microglia. We used two-color immunofluorescence and confocal microscopy to identify Kv1.3 or Kv1.5 proteins in tissue-printed microglia. A scanning confocal microscope (Bio-Rad MRC-600) equipped with an argon ion laser, fluorescein and Cy3 filter sets, and a 60× objective was used to visualize the subcellular location of each antibody (membrane vs cytosol). To allow superimposition of fluorescence images showing OX-42 and K+ channel staining, the same gain and focal plane were used. For all experiments, the concentrations of antibodies, fluorescence intensity gain, and pinhole and neutral density filters were kept constant. Digitized images were prepared using the software provided with the confocal microscope and Adobe Photoshop (ver. 4.0, Adobe Systems, Mountainview, CA). Cells were fixed and prepared for antibody staining as described above, using OX-42 to label microglia. The affinity-purified polyclonal anti-Kv1.5 antibody (1:200, Upstate Biotechnology, Lake Placid, NY) has been previously characterized as specific for Kv1.5 in glial cells (Sobko et al., 1998). We used an anti-Kv1.3 antibody (1:100) made by Dr. James Douglass (Vollum Institute, Portland, OR) and kindly provided by Dr. I. B. Levitan (Brandeis University, Waltham, MA). The rabbit polyclonal serum was raised against a MalE fusion protein containing a sequence specific to an intracellular region of Kv1.3 (Cai and Douglass, 1993). This antibody has been well characterized and was found to be specific for Kv1.3 and useful for immunofluorescence and Western analysis (Fadool et al., 1997).
Although both antibodies have been previously characterized, we performed several control experiments. To ensure that there was no cross-reactivity between the Kv antibodies, we heterologously expressed each channel in a rat microglia cell line (MLS-9, developed in our lab) (Zhou et al., 1998b) that does not express either channel. After growing MLS-9 cells in flasks to >60% confluency, they were co-transfected (Lipofectamine, Life Technologies) with full-length cDNAs encoding either Kv1.3 or Kv1.5 (2 μg cDNA per 35 mm dish) and the marker, enhanced green fluorescent protein (1 μg cDNA per dish; Clontech, Palo Alto, CA). Transfection efficiency, monitored as percentage of green fluorescent cells, was 50–75%. Labeling with each Kv primary antibody and Cy3-conjugated (red) secondary antibody was performed 2 d after transfection, as described above. Each antibody brightly stained cells that were transfected with the channel against which the primary antibody was directed (see Fig. 7). In contrast, anti-Kv1.3 did not label Kv1.5-transfected cells, and anti-Kv1.5 did not label Kv1.3-transfected cells; thus the Kv antibodies were specific. The preimmune serum for the Kv1.3 antibody did not stain either Kv1.3- or Kv1.5-transfected MLS-9 cells, and there was no staining when either primary antibody was omitted.
Fig. 7.

Specificity of the Kv1.3 and Kv1.5 antibodies. The rat microglia cell line MLS-9 (Zhou et al., 1998b) was transfected with full-length cDNA for either Kv1.3 or Kv1.5 together with enhanced green fluorescent protein. Each panel shows a fluorescence image using a rhodamine filter block (left) and a bright-field image (right) of the same field of cells. Cells shown are from different flasks from the same MLS-9 culture. A, MLS-9 cells transfected with Kv1.3 cDNA stained brightly with the anti-Kv1.3 antibody. B, Kv1.3-transfected cells did not stain with the anti-Kv1.5 antibody. Similarly, Kv1.5-transfected cells stained brightly with the anti-Kv1.5 antibody (C) but not with the anti-Kv1.3 antibody (D). Scale bar shown in C for A and C; shown inD for B and D.
Western blot analysis. Each type of cell or tissue (primary cultured microglia, rat heart, HEK-293 cells) was lysed in ice-cold solubilization buffer containing protease and phosphatase inhibitors: 25 mm Tris, pH 7.5, 150 mm NaCl, 100 mm NaF, 5 mm EDTA, 1 mmNa3VO4, 1% Triton X-100 (Sigma), 1 μg/ml leupeptin, 2 μg/ml aprotinin, and 1 mmphenylmethylsulfonyl fluoride. The lysate was triturated, then centrifuged (15,000 × g, 5 min, 4°C) to remove any cellular debris, and the membrane-enriched supernatant was retrieved. Total protein concentration was determined with a Bio-Rad DC Protein Assay (Bio-Rad, Mississauga, Ontario) with bovine serum albumin as the standard. Proteins (15 μg/lane) were resolved on a 10% acrylamide gel by SDS-PAGE, then electrotransferred to nitrocellulose, blocked in 5% nonfat milk, and incubated overnight at 4°C with a primary antibody (same antibodies as for immunocytochemistry, above): either Kv1.3 (1:20) or Kv1.5 (1:350). Blots were incubated with horseradish peroxidase-conjugated secondary antibody (Cedarlane, Hornby, Ontario) for 1 hr at room temperature. Enhanced chemiluminescence (Amersham, Arlington Heights, IL) on XAR-2 film (Kodak, Rochester, NY) was used to visualize labeled proteins. Unless specified otherwise, reagents for Western immunoblotting were from Sigma.
RT-PCR. Total RNA was isolated from cultured microglia using the guanidinium isothiocyanate method (Sambrook et al., 1989) and subjected to DNase I digestion (Pharmacia; 0.1 U/ml, 15 min, 37°C) to eliminate genomic contamination. First-strand cDNA was synthesized according to the manufacturer's instructions (Pharmacia) using an oligo-dT-based primer. The cDNA was then used as a template for PCR reactions using gene-specific primers: Kv1.1 (GenBank accession no.M30439), Kv1.2 (J04731), Kv1.3 (M30312), Kv1.4 (M32867), Kv1.5 (M27158), Kv1.6 (U45979), β actin (M12481), and S16 ribosomal RNA (M11409). The PCR reaction was conducted with 1.5 mmMgCl2, 0.5 m forward and reverse primers, and 10% of the cDNA reaction mixture, using a Minicycler system (MJ Research, Watertown, MA) and 1.25 U of Taq DNA Polymerase (BioBasic, Toronto). The PCR-amplified DNA fragments were resolved in 2% agarose gels containing 0.5 mg/ml ethidium bromide. The identities of products of the predicted sizes were confirmed by restriction endonuclease digestion or by sequencing.
RESULTS
Optimizing the tissue-printing procedure for microglia
The method for preparing tissue prints from brain (Kotecha et al., 1997) was modified to obtain large numbers of healthy microglia with small cell bodies and one or more long processes. In the rat, there are relatively few microglia before P2, but they are numerous by P12 (Milligan et al., 1991). The hippocampus was used because it contains many microglia, is important from a pathological point of view (e.g., stroke), and the considerable electrophysiology data on hippocampal neurons and astrocytes should prove useful in future studies of microglia–neuron–astrocyte interactions. We tested different aCSF compositions, ages of rats, and substrates applied to the coverslip. Use of cold (4°C) aCSF with low Ca2+, high Mg2+, and sucrose (see Materials and Methods) facilitated the isolation of many viable microglia with small spindle-shaped cell bodies and one or two processes up to 20 μm long, but fewer microglia were obtained at room temperature. Tissue prints prepared in aCSF with “normal” Ca2+(1–2 mm) and 125 mm NaCl contained both neuronal and non-neuronal cells, but most were swollen and pyknotic, cell numbers were low, and microglia progressed from small and round to large and granular after several days in culture. All results in this paper are from young rats (P5–14) because many spindle-shaped microglia with long processes were present, whereas few microglia were obtained from older animals (P20–25).
Tissue prints favoring particular brain cells are made by exploiting specific cell-substrate interactions (Kotecha et al., 1997). We tested several “adhesive” substrates and, as indicated in Table1, the most successful method used poly-l-lysine (1 mg/ml) and rat tail collagen (1.5 mg/ml). With this method the cells retained an apparently normal organotypic distribution; for instance, the hippocampus could be clearly distinguished when viewed at low power using Hoffman modulation contrast optics. Because many microglia were tissue-printed and they retained one or more long processes (Fig.1A) for several days in culture (Fig. 1B), this method was used for the remainder of the study. Two other methods were extensively tested (12–18 experiments each), found to be less successful, and rejected. That is, coverslips coated with poly-l-lysine (1 mg/ml), concanavalin A (Con A, 0.5 mg/ml) and laminin (10 μg/ml) allowed many microglia to be isolated, but they were large and granulated and proliferated rapidly, possibly having been activated by laminin or Con A (Chamak and Mallat, 1991). When poly-l-lysine (1 mg/ml) and Con A (2 mg/ml) were used, numerous non-neuronal cells were isolated, and the microglia at first retained long processes; however, within 2 d they became round, granular, and highly proliferative.
Table 1.
Substrates affect the number and morphology of tissue-printed microglia
| Substrate coated on coverslip | Resulting cells |
|---|---|
| Poly-l-lysine (MW >300,000; 1–1.5 mg/ml) | Few if any microglia; numerous astrocytes after several days in culture |
| Nitrocellulose + poly-l-lysine | Very few microglia (or other cells) |
| Poly-l-lysine + Con A (1–2 mg/ml) + laminin (0.09–0.15 mg/ml) | Many microglia: large, rounded, granular, and highly proliferative in early cultures |
| Poly-l-lysine + Con A | Many microglia: initially bipolar/unipolar, round, highly proliferative after several days |
| Collagen (1–1.5 mg/ml) + poly-l-lysine | Many microglia: predominantly bipolar in early cultures, activated after several days |
Fig. 1.

Morphology and phenotype of tissue-printed microglia from rat pups. A, Bright-field image of a freshly prepared tissue print made from a hippocampal slice on a coverslip coated with poly-l-lysine and rat-tail collagen (see Materials and Methods). The arrow indicates a bipolar microglia cell that is surrounded by extracellular matrix and other cells, including large, flat astrocytes. Scale bar (shown inA for A and B): 50 μm.B, Changes in microglia morphology in culture. A typical hippocampal tissue print after several days in culture, showing increased numbers of microglia and two prevalent morphologies: unipolar or bipolar with long processes (arrows) and numerous rounded, granular cells. All patch-clamp recordings were made from unipolar or bipolar microglia. C, D, Fluorescence images of isolated microglia that were fixed before labeling with Texas Red-conjugated isolectin B4(IB4) (C) or OX-42 antibody with an FITC-conjugated secondary antibody (D). Scale bar (shown inC for C and D): 20 μm.
Morphology and phenotype of tissue-printed microglia
Four microglia morphologies were seen in tissue prints. Immediately after the tissue prints were prepared (Fig.1A), most microglia had a small, elongated cell body and one or two long processes (more than two times longer than the width of the cell body). A few microglia were ramified with multiple branched processes (data not shown). When tissue prints were cultured (Fig. 1B), the prevalence of different microglia morphologies changed, with fewer ramified, unipolar, or bipolar cells (data not shown) and more with uropod- or lamellipod-like processes, or spherical, granular cell bodies without processes. After 5–15 DIC the appearance of the entire tissue print also changed. The remaining viable cells (microglia, fibroblasts, astrocytes) tended to cluster with the same cell type, and the organotypic appearance of the hippocampus was gradually lost. Consistent with previous studies of hippocampal slice organotypic cultures (Hailer et al., 1996), microglia gradually activated during culturing and tended to migrate to the periphery of the tissue print. Despite these changes, bipolar and unipolar (Fig. 1B) microglia were always present throughout the tissue print, and only these cells were selected for patch-clamp recordings.
To confirm the identity of tissue-printed cells morphologically identified as microglia, we used monoclonal antibodies on fixed cells (OX–42, ED1), and the lectin, IB4, on living or fixed cells. The specificity of these markers was tested on highly purified rat microglia cultures (Table2), wherein 95–100% of cells stained with IB4, ED1, or OX-42. Fewer than 4% of the cultured cells stained with anti-GFAP (astrocytes) or anti-fibronectin (fibroblasts), compared with 50–75% of the cells in tissue prints. IB4 (Fig. 1C) and OX-42 (Figs.1D, 8) selectively stained microglia, and labeling was restricted to the membrane. ED1, which labeled only microglia, did so in a punctate pattern that was restricted to the cytosol (data not shown). IB4 staining of microglia was consistently intense throughout the culture period, whereas OX-42 and ED1 staining were lower on bipolar cells (most cells in early cultures) than on spherical microglia (predominant in late cultures). This result corresponds with earlier studies in which ED1 and OX-42 staining were low on ramified microglia but high on amoeboid or activated cells (Dijkstra et al., 1985; Graeber, 1993).
Table 2.
Phenotypic markers used to identify microglia
| Phenotypic marker | Site labeled | Tissue-printed microglia | Cultured microglia | Labeling of cultured microglia (% positive)2-a |
|---|---|---|---|---|
| Isolectin B4 | α-d-galactose residue2-c | ++++2-b | +++ | 100 (98 of 98 cells) |
| ED1 antibody | Uncharacterized antigen on lysosomal membrane2-d | ++ (early, 0–5 DIC) ++++ (late, >10 DIC) | ++++ | 99 (118 of 119 cells) |
| OX-42 antibody | Complement receptor-3 (CR3)2-e | + (bipolar) ++++ (rounded) | ++++ | 95 (100 of 105 cells) |
| Anti-GFAP antibody | Glial fibrillary acidic protein (GFAP) | Staining only of astrocytes | − | <2 (2 of 98 cells) |
| Anti-fibronectin | Fibronectin | Staining only of fibroblasts | − | <2 (2 of 99 cells) |
Percentage of total cells counted that were positive for the label indicated.
The fluorescence intensity of cells was scored as − (not detectable), + (low), ++ (moderate), +++ (high), ++++ (very high).
Fig. 8.
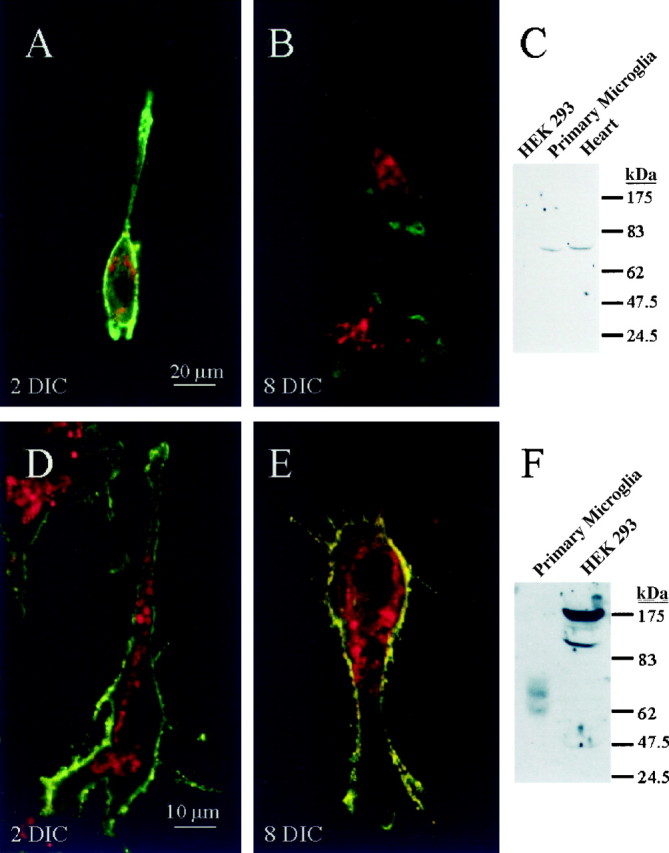
Expression of Kv1.5 and Kv1.3 proteins in cultured tissue-printed microglia. For immunofluorescence, microglia were labeled with OX-42 primary antibody, which binds to complement receptors on the cell surface, and a biotinylated secondary antibody with FITC-conjugated streptavidin (green labeling). A,B, Kv1.5. Confocal images of representative microglia from an early culture (A, 2 DIC) and an intermediate culture (B, 8 DIC) labeled with a polyclonal anti-Kv1.5 antibody and a Cy3-conjugated secondary antibody (red regions). Superimposed images from the same confocal planes show colocalization (yellow regions) that is prominent in B. Scale bar (shown in A for A and B): 20 μm. C, Western blots using anti-Kv1.5 antibody on highly purified rat microglia, rat heart (positive control), and nontransfected HEK-293 cells (negative control). D,E, Kv1.3. Confocal images of representative microglia from the same 2 DIC (D) and8 DIC (E) cultures as inA and B, with the membranes stainedgreen (OX-42). The red-stained regionsrepresent anti-Kv1.3 polyclonal antibody with a Cy3-conjugated secondary antibody. Yellow regions of colocalization are more extensive in E than in D. Scale bar (shown in D for D and E): 10 μm. F, Western blots using anti-Kv1.3 antibody on highly purified rat microglia and nontransfected HEK-293 cells (negative control).
Expression of voltage-gated K+ currents declines with time in culture
With experience, using the labeling protocols (above), it became simple to recognize unipolar, bipolar, and spherical microglia from their morphology using Hoffman optics and a 40× objective. Nevertheless, after >20 patch-clamp recordings of unipolar and bipolar cells, we perfused the dish with Texas Red-conjugated IB4 and confirmed that the cells recorded from were microglia. To favor Kv currents, the holding potential was very negative to prevent channel inactivation, internal Ca2+ was low to eliminate Ca2+-activated K+ currents, and osmolarities were balanced to avoid activating swelling-sensitive Cl− currents (Schlichter et al., 1996).
When tissue prints were cultured, the expression of Kv currents decreased dramatically with time in culture. For convenience, we defined three culture periods: 0–5 DIC, 6–10 DIC, and >10 DIC. Distinct Kv currents (>20 pA) were seen in >95% (61 of 63) of microglia after 0–5 DIC, in significantly fewer microglia (52%, 26 of 50 cells; p < 0.001, χ2test) after 6–10 DIC, and <20% of microglia after >10 DIC (8 of 42;p < 0.0001, χ2 test). In addition, for those microglia expressing Kv currents, the current density decreased with time in culture, from 93.8 ± 10.6 pA/pF (n = 61, 0–5 DIC) to 76.2 ± 21 pA/pF (n = 26, 6–10 DIC) and 31 ± 9.5 pA/pF (n = 8, >10 DIC). The whole-cell capacitance was 18.4 ± 3.0 pF, with a range of 8–44.5 pF (n = 75). Decreases in current density were significant at 6–10 and >10 DIC (p < 0.001). Finally, and very importantly, the type of Kv current changed in culture, as judged from changes in biophysical and pharmacological properties (described below).
Biophysical properties of the Kv currents
For comparison of biophysical and pharmacological properties (and Kv channel protein expression; see below), microglia were examined at 0–5 DIC and compared with >10 DIC tissue prints. At all times, the voltage-activated currents were highly K+selective, because the reversal potentials were between −80 and −84 mV, which is very close to the calculated Nernst potential for K+ (−85 mV) for the K+ concentrations used. Reversal potentials for other ionic species in these solutions wereECl = −20 mV,ECa = >100 mV,EH = +15 mV. Kv currents in microglia in tissue prints cultured from 0–5 d (Fig.2) activated at approximately −65 mV and increased in amplitude with depolarization. As is typical of Kv currents, the voltage dependence of activation and steady-state inactivation were well described by Boltzmann functions (Fig.2C), with the derived parameters as indicated in the legend. The voltages producing half-maximal conductance (V1/2) were approximately −10 mV for activation (fully activated at approximately +30 mV) and −29 mV for inactivation. Steady-state inactivation began at approximately −70 mV and was complete at ∼0 mV. The region under the intersection of activation and inactivation curves predicts a window of tonic channel activity between −65 and 0 mV, with maximal activity at the intersection voltage of −20 mV. The slope factors (kn) of the Boltzmann curves (mV/e-fold change in conductance) were ∼14 mV for activation and ∼9 mV for inactivation. The Kv currents in most microglia during this time period exhibited very little inactivation. Sustained depolarizing steps were used to examine the inactivation time course, which was well described by a monoexponential function (Fig.3B) and was nearly independent of voltage, except at the most negative potentials (Fig.3D). In some cells, the degree of steady-state inactivation was more pronounced at positive potentials (Fig. 2A), and this property increased with time in culture, as described below. Table 3 compares key biophysical and pharmacological features of Kv currents in tissue-printed microglia with those of cultured microglia, Kv1.5 and Kv1.3 channels.
Fig. 3.

Inactivation kinetics of the Kv currents.A, Representative currents from a microglia 2 d after preparing the tissue print. Currents in response to a series of voltage-clamp steps were each fitted to a monoexponential function (smooth curves) to obtain the inactivation time constant. B, Typical currents from a tissue-printed microglia maintained in culture for several days. A monoexponential function was fitted to the falling phase beginning after each current peak. C, Time constant (τ, mean ± SEM) for inactivation in 0–5 DIC cells (n = 8) and 6–10 DIC cells (n = 6) as a function of membrane potential.
Table 3.
Comparison of Kv currents in tissue-printed microglia with Kv1.5, Kv1.3, and the Kv current in dissociated, cultured microglia
| Kv1.5 | Printed microglia 0–5 DIC | Printed microglia 6–10 DIC | Cultured microglia | Kv1.3 | |
|---|---|---|---|---|---|
| Biophysical properties | |||||
| Activation | −143-a | ||||
| V1/2 (mV) | −3 to −25b | −10 ± 2.6 | −27 ± 3 | −14h,i | −263-a |
| −19c | −24j,k | −13 to −25b | |||
| −11d | −40l | −26 to −35n | |||
| 0 to −15e,f | −33q | ||||
| Steady-state | −33c | −65n | |||
| inactivation | −10 to −33e | −29.4 ± 2.1 | −38 ± 5 | −34 −36h,k | −58q |
| V1/2 (mV) | −38 to −41f | −48j | |||
| Inactivation | 1,300; 17,000c | 570 (+30)h | |||
| time | >5000 (+50)e | 1200 | 400–600 | 160 (+60)i | 200 (at +20)q |
| constant | 500–600 (all mV)f | (+40) | 400–600 | ||
| msec (x mV) | (+30)m | ||||
| 430 (+30)j | |||||
| 440 (+30)k | |||||
| Cumulative | No | ||||
| inactivation | (1)a,b,c | No (5) | Yes (45) | Yesh,i,l | Yesa,b(30–60) |
| (interval, sec) | |||||
| Pharmacological properties | |||||
| TEA | ∼10h,i,j | ||||
| IC50(mm) | 40–330b | ≫5 | >5o | 11–50b,g | |
| >40g | ∼20p | 10–11n | |||
| 4-AP | ≪5000h | ||||
| IC50(μm) | 2703-a | ∼1000 | 270m | 1953-a | |
| >100–400b | ≪2000o | 200–1500b | |||
| 30–600f | ≪1000j | 1500g | |||
| >5000p | |||||
| ChTx | 7200b | (80%) 5–10l | 0.5–2.6b | ||
| IC50(nm) | >1003-a | >50 | ∼1, 10h,j | 2.63-a | |
| >1000p | 2.9n | ||||
| MgTx | (95%) 1–5l | 0.03–0.06n | |||
| IC50(nm) | ≫5 | <0.1r | |||
| AgTx-2 | 4 pmf | ||||
| IC50(nm) | ≫50 | <5 | 0.2 present study |
Grissmer et al., 1994;bChandy and Gutman, 1995;cPhilipson et al., 1993;dBertoli et al., 1994;eUebele et al., 1998;fZhou et al., 1998a;gMathie et al., 1998;hEder et al., 1995;iKorotzer and Cotman, 1992;jNorenberg et al., 1994;kVisentin et al., 1995;lSchlichter et al., 1996;mEder, 1998; nSpencer et al., 1997; oPyo et al., 1997;pIchinose et al., 1998;qPapahill and Schlichter, 1990;rChung and Schlichter, 1997.
After >5 DIC, properties of the Kv current in those microglia with detectable currents changed from the current described above. Voltage-dependent activation was present above approximately −70 mV, with complete activation at approximately +30 mV, but theV1/2 values shifted to more negative potentials than those of 0–5 DIC microglia (Fig. 2C). More striking was the increase in cumulative inactivation with time in culture. Cumulative inactivation occurs when recovery from inactivation between test pulses is sufficiently slow to be incomplete by the start of the next pulse (Grissmer et al., 1994; Lewis and Cahalan, 1995). This property is particularly pronounced in Kv1.3 channels, occurring even with interpulse intervals of 60–90 sec (Pahapill and Schlichter, 1990; Chung and Schlichter, 1997). Other Kv channels, including Kv1.5, display little if any cumulative inactivation, even at intervals as short as 1 sec (Grissmer et al., 1994) (Table 3). The data in Figure 4 show that microglia Kv currents are increasingly susceptible to cumulative inactivation as tissue prints are cultured. From 0–5 DIC no cumulative inactivation was seen even when the interpulse interval was 5 sec (Fig. 4D) (n = 35); that is, each successive test pulse produced the same current amplitude (Fig. 4A). However, after 6–10 DIC there was some cumulative inactivation with 30 sec intervals, and significantly more at ≤15 sec intervals than in microglia at 0–5 DIC (Fig. 4D) (p < 0.002,n = 21). With 10 sec intervals, inactivation accumulated between the first and second pulses, then reached steady-state (Fig. 4B). For tissue prints >10 DIC (Fig. 4C) (10 sec intervals), inactivation was progressively increased by the first five test pulses, then steady-state was reached. For all interpulse intervals tested, cumulative inactivation in >10 DIC cells was significantly greater than in 0–5 or 6–10 DIC cells (Fig. 4D) (p < 0.001,n = 8). The steady-state level of cumulative inactivation also increased with time in culture; i.e., with 0.2 Hz stimulation the Kv current reached steady-state at 47% (6–10 DIC) and 21% (>10 DIC) of the initial amplitude. For comparison, in cultured microglia stimulated at 1 Hz, the Kv current declined to ∼40% (Norenberg et al., 1994) or ∼25% (Schlichter et al., 1996) of the control value.
Fig. 4.

Cumulative inactivation of microglial Kv currents is acquired with time in culture. A–C, From a holding potential of −100 mV, each cell was stepped to +20 mV from four to six times (numbered in sequence) with an interpulse interval of 10 sec. Typical recordings are shown from microglia in tissue prints at early (1 DIC), intermediate (7 DIC), and late (12 DIC) times in culture.D, Summary of responses to repetitive pulses with varied interpulse intervals. For each cell and at each interpulse interval (progressing from longest to shortest), repetitive test pulses were applied until there was no further change in current. Data are normalized as I/Imax, where Imax is the peak current during the first test pulse, and expressed as mean ± SEM. Significant differences in the degree of cumulative inactivation between 0–5 DIC and 6–10 DIC are indicated (*), as are differences between 6–10 DIC and >10 DIC cells (†).
Pharmacological profile of Kv currents
The changes in voltage dependence and cumulative inactivation that occurred with time in culture raised the possibility that a change in Kv current type occurs. Because pharmacological profiles can help identify or eliminate channel types, we first tested the broad-spectrum K+ channel blockers 4-aminopyridine (4-AP) and tetraethylammonium (TEA) (Grissmer et al., 1994; Chandy and Gutman, 1995; Mathie et al., 1998), as well as BaCl2, which potently blocks the inward rectifier (Norenberg et al., 1994;Schlichter et al., 1996). Peptide toxins, which are more potent and selective, can be useful in discriminating among Kv channel types. We tested charybdotoxin (ChTx), which blocks several Kv channels (including Kv1.3) at nanomolar concentrations (Grissmer et al., 1994;Chandy and Gutman, 1995; Garcia et al., 1997; Mathie et al., 1998), margatoxin (MgTx), which potently blocks Kv1.3 and less potently inhibits several other Kv channels (Spencer et al., 1997), and agitoxin-2 (AgTx-2), which is an extremely potent Kv1.3 blocker (Garcia et al., 1997). Before evaluating drug effects, we determined that corrections for Kv current rundown were unnecessary. The current amplitude declined <5% in the first 10 min after establishing a whole-cell recording and <10% after 30 min (Fig.5A); thus to avoid rundown we completed each experiment within 10 min. Control Kv currents were recorded from each cell before the desired concentration of drug was rapidly perfused into the small-volume recording chamber. This ensured a uniform concentration within 30 sec (see Materials and Methods); nevertheless, we waited 2–3 min before testing the response to drug, then repeated voltage-clamp steps until steady-state block was attained at that concentration.
Fig. 5.

Pharmacological profile of microglia in early tissue print cultures (0–5 DIC). A, Current rundown was assessed by applying voltage steps to −30 mV from a holding potential of −100 mV every 5 min after establishing a whole-cell recording. Normalized values areI/Imax, whereImax is the peak current attained during the first voltage-clamp step, expressed as mean ± SEM (n = 4). B, Average inhibition of Kv currents in early cells by several K+-channel blockers. Channel block was assessed during voltage-clamp steps ranging from −50 to +50 mV, within the first 10 min after establishing each whole-cell recording. Bars represent mean ± SEM (number of experiments), and paired t tests were used because each cell acted as its own control.
Kv in microglia at 0–5 DIC
Effects of K+-channel blockers are summarized in Figure 5B. TEA was tested at 5 mm, because this concentration blocks >50% of several Kv currents, including Kv1.1 and 1.6, Kv2.1 and 2.2, and Kv3.1 to 3.4 (Grissmer et al., 1994; Mathie et al., 1998). In early tissue-printed microglia, 5 mm TEA inhibited the Kv current by 18 ± 7% (n = 3). 4-AP reduced the Kv current by 42 ± 9% at 1 mm(p < 0.001, n = 3) and by 21 ± 12% at 250 μm(p < 0.002, n = 3; data not shown), whereas 10 mm BaCl2had no effect. ChTx, which was tested at high enough concentrations to affect several Kv currents (Grissmer et al., 1994; Chandy and Gutman, 1995), reduced the microglia current by 27 ± 14% at 10 nm and 43 ± 21% at 50 nm (n = 4 each). Block by ChTx was voltage- and time-independent, and the remaining current was confirmed as a Kv current with similar time- and voltage-dependent activation, reversal near EK, and lack of cumulative inactivation.
Because we were particularly interested in whether Kv1.3 channels contributed to the microglia Kv current, we tested MgTx and AgTx-2 at many times the concentration required for 50% block of Kv1.3 channels (Spencer et al., 1997). Even at 5 nm, MgTx failed to significantly inhibit the Kv current: a voltage-independent decrease of 8 ± 12% (p > 0.2, n = 5) was seen. AgTx-2 did not inhibit the Kv current at either 5 nm (5 ± 8% decrease, p > 0.3, n = 5) or 50 nm (8 ± 4% decrease, p > 0.2, n = 5). To verify the potency of the AgTx-2 aliquots used, we determined theKd for blocking Kv1.3 current in activated human T lymphocyte, a cell in which Kv1.3 channels exist as homotetramers (Grissmer et al., 1994; Chandy and Gutman, 1995). As expected, AgTx-2 inhibited the lymphoblast Kv1.3 current at all voltages, and a dose–response curve (n = 4; data not shown) yielded a Kd of 177 pm and a Hill coefficient of 1.1. Thus, a Kv1.3 current in microglia should have been fully blocked by 50 nm AgTx-2 (>250Kd).
AgTx-2 sensitivity of Kv increases as tissue prints are cultured
Because cumulative inactivation of Kv current (a hallmark of Kv1.3) became progressively more pronounced as tissue prints were cultured, we asked whether there was a corresponding increase in Kv sensitivity to AgTx-2 (Fig. 6). This was the case: the degree of block by AgTx-2 increased with time in culture, and the current from a microglia at 10 DIC showed 85% inhibition by 5 nm AgTx-2 (Fig. 6A,C). Currents in microglia at 3–5 DIC were inhibited <15%, compared with 25–58% inhibition after 6–9 DIC and 55–85% inhibition after 10–12 DIC. As expected, microglia with Kv currents that were AgTx-2 sensitive displayed cumulative inactivation when voltage-clamp steps were separated by 10 sec intervals (Fig. 6B).
Fig. 6.

AgTx-2 sensitivity of Kv currents increases with time in culture. A, Representative Kv currents from a microglial cell at 7 DIC. Currents were evoked by steps between −80 and +20 mV (in 20 mV increments) from a holding potential of −100 mV. AgTx-2 (5 nm) dramatically reduced the current amplitude in a time- and voltage-independent manner. B, The cell inA displayed cumulative inactivation with repetitive pulses (numbered sequentially) to +30 mV (from a holding potential of −100 mV), separated by an interpulse interval of 10 sec.C, Inhibition of Kv current by 5 nm AgTx-2 was calculated as a percentage of the control current in the same cell. Each circle represents a different cell. Depolarizing test pulses from −80 to +20 mV were applied before and after drug addition. The data were fitted to a linear regression: correlation coefficient, 0.94.
Expression of Kv1.5 and Kv1.3 protein
Several features of the current in microglia from early cultured tissue prints resembled Kv1.5 (Table 3); i.e., the voltage dependence and kinetics of gating, very slow inactivation during voltage-clamp steps, lack of cumulative inactivation even with 5 sec interpulse intervals, and insensitivity to most blockers (except 4-AP). In contrast, after several days in culture the current resembled Kv1.3. Therefore, we determined whether Kv1.5 and 1.3 proteins are expressed in microglia (Fig. 7), and whether their expression in tissue-printed hippocampal microglia changes with time in culture (Fig. 8). For Kv1.5, the Western blots (Fig. 8C) showed a single appropriate band (∼75 kDa) in rat primary microglia grown in highly purified cultures and in rat heart (positive control) but no band in nontransfected HEK-293 cells (negative control). The Kv1.3 antibody (Fig. 8F), which was used at a high concentration (1:20) because it was weak (made in 1992), identified an appropriate band at 65 kDa in cultured rat microglia but not in the nontransfected HEK-293 cells (negative control).
Microglia were identified with OX-42 antibody (green fluorescence), which outlines their membranes by binding to complement receptors on the microglia surface. A red fluorescent secondary antibody was used with the K+ channel antibodies; thus colocalization of the membrane and channel was seen as yellow fluorescence. We first determined the percentage of OX-42-positive cells that stained for each channel type at different times in culture by counting multiple fields of cells from several tissue prints. In these hippocampal tissue prints, oligodendrocytes and astrocytes, which express a number of Kv channels, did not stain with anti-Kv1.3 antibody. Only microglia (OX-42-positive cells) stained with anti-Kv1.3 antibody. Anti-Kv1.5 only stained microglia and a small number of astrocytes, which is not surprising because Kv1.5 can be expressed in cultured astrocytes (Roy et al., 1996). Further controls for antibody specificity are explained in Materials and Methods.
From 0–5 DIC, 95% of the OX-42-positive cells (127 of 134 cells) stained distinctly with anti-Kv1.5 antibody. This percentage decreased slightly by 6–10 DIC (88%, 148 of 168). However, at >10 DIC, significantly fewer OX-42-positive cells were labeled with anti-Kv1.5 antibody: 49%, 60 of 123 (p < 0.01, χ2 test). Using confocal microscopy at selected times, we noted changes in subcellular localization of the protein. In Kv1.5-expressing microglia from early cultured tissue prints, considerable Kv1.5 protein appeared to be on the cell membrane (Fig. 8A, yellow regions), and a similar pattern was seen in the >12 microglia examined. After 6–10 DIC, those cells in which Kv1.5 staining was detectable showed protein almost exclusively in the cell interior (Fig. 8B), and a similar pattern was seen in the 10 other microglia examined.
A similar analysis of Kv1.3 antibody staining showed the opposite trends. From 0–5 DIC, only 15% (21 of 143) of the OX-42-positive cells stained distinctly with anti-Kv1.3 antibody. This proportion increased significantly with time in culture, to 65% (80 of 123) by 6–10 DIC (p < 0.001, χ2 test) and to 72% (120 of 166) after >10 DIC (p < 0.001). After 6–10 DIC, there was considerable Kv1.3 protein colocalized with OX-42 on the cell membrane (Fig. 8E, yellow), and a similar pattern was seen in >10 microglia examined. Thus, both the number of microglia expressing Kv1.3 and its surface expression increased dramatically with time. For those few Kv1.3-expressing microglia in early cultured tissue prints (15%), the staining was mainly in the cell interior, with a small amount at the membrane (Fig.8D) (similar pattern in >10 microglia examined). Despite some apparent expression on the membrane, we never detected Kv1.3-like current, which raises the possibility that these Kv1.3 channels are nonfunctional. Tyrosine phosphorylation is one known mechanism for “silencing” Kv1.3 channels (Fadool et al., 1997), and we have evidence that src-family tyrosine kinases inhibit the Kv1.3-like current in cultured rat microglia (F. S. Cayabyab, R. Khanna, O. T. Jones, L. C. Schlichter, unpublished observations).
For comparison, we used subunit-specific RT-PCR analysis of whole-cell lysates from cultured rat microglia (Fig.9) to determine whether mRNA for other Kv channels is expressed. Very high levels of Kv1.3 and 1.5 mRNA were seen in cultured microglia, which is consistent with the high protein expression for these channels in tissue-printed microglia. There were also very low levels of mRNA for Kv1.2 and Kv1.6, whereas Kv1.1 and Kv1.4 were not detected in the same samples. We did not test for protein expression for any of these channels.
Fig. 9.

RT-PCR. For each Kv channel, cDNA was amplified from cultured rat microglia. For Kv1.1, Kv1.2, Kv1.4, and Kv1.6, duplicate lanes are shown, whereas three replicates are shown for Kv1.3 and Kv1.5. All bands that appeared were of the correct size, and their identities were confirmed with restriction enzyme analysis or by sequencing. Kv1.3 was very highly expressed, Kv1.5 was highly expressed, and Kv1.2 and Kv1.6 were expressed at low levels.
Kv current expression and microglia proliferation
Because Kv1.3-like currents were present in proliferating rat microglia in highly purified cultures (Schlichter et al., 1996), we asked whether the expression of the two apparently different Kv currents in tissue-printed microglia was correlated with their proliferative state. Microglia cells from different DIC were patch-clamped, their Kv currents and cumulative inactivation were recorded, then immunocytochemistry was used to determine whether the cell recorded from was proliferating (i.e., had incorporated BrdU into its DNA). From 0–5 DIC, 14 of 15 microglia that had Kv1.5-like currents lacking cumulative inactivation (Fig. 10A) were negative for anti-BrdU antibody staining (Fig.10D) (p < 0.001, χ2 test). Before accepting lack of BrdU staining as a true negative, we ensured that some BrdU-positive cells were present in every dish. At >6 DIC, all microglia displayed a Kv1.3-like current with cumulative inactivation (8 of 8 cells) (Fig.10B), and all showed strong nuclear staining with anti-BrdU antibody (Fig.10H) (p < 0.001, χ2 test). In all cases, negative controls were performed on sister cultures by omitting the anti-BrdU monoclonal antibody. As tissue prints were cultured, the percentage of microglia that were proliferating increased dramatically (Fig.11), from ∼3% at 0 DIC to 72% at 5 DIC and 93% at 10 DIC. Previous studies have shown low proliferationin vivo (i.e., in resting microglia), whereas in dissociated cultures increasing proliferation is thought to reflect progressive microglial activation (Gehrmann et al., 1995; Streit and Kincaid-Colton, 1995; Slepko and Levi, 1996). Our 0 DIC results suggest that low proliferation reflects a more resting state, possibly attributable to the tissue print method, which is less disruptive than enzymatic/mechanical dissociation. Furthermore, with this method we studied microglia much sooner after removal from the brain.
Fig. 10.

The predominant type of Kv current correlates with the microglia proliferative state. Tissue prints were incubated in BrdU, then one microglia from each dish was penetrated with a patch pipette containing Lucifer yellow to mark the cell for later immunocytochemical analysis. After the properties of the Kv currents were recorded, the cells were fixed, permeabilized, and stained with anti-BrdU antibody. Fixed cells retained sufficient fluorescent Lucifer yellow to identify the cell from which the recording was made. A–D, Microglia with rapidly activating, very slowly inactivating Kv currents that lacked cumulative inactivation were not proliferative. Current traces from a microglia in an early cultured tissue print (A). Four consecutive voltage-clamp steps (numbered) were applied to +30 mV from a holding potential of −100 mV with an interpulse interval of 10 sec. The same cell is shown under bright-field (B) and fluorescence, showing Lucifer yellow (FITC filter set) throughout the cytoplasm (C), and lack of staining with anti-BrdU antibody (D).E–H, Microglia with inactivating Kv currents that showed cumulative inactivation were proliferating. Four consecutive current traces (E) are shown using the same protocol as in A, from a microglia in tissue print cultured for an intermediate time. The same cell is shown under bright-field (F) and fluorescence optics showing Lucifer yellow throughout the cytoplasm (G) and nuclear staining with anti-BrdU antibody (H).
Fig. 11.

Proliferation of microglia increases in cultured tissue prints and acquires sensitivity to K+-channel blockers. Proliferation was determined using the same anti-BrdU immunocytochemical assay as in Figure 9. Each K+-channel blocker (4-AP, 5 mm; ChTx, 50 nm;AgTx-2, 5 nm) was added to a separate dish containing freshly prepared tissue prints (time 0), then the culture medium containing the drug (or the control medium) was replaced every 2 d. The percentage of proliferating microglia in each tissue print was scored as the proportion of IB4-labeled microglia (out of 100 cells counted for each tissue print), the nuclei of which incorporated BrdU substrate (labeled with anti-BrdU). Values are mean ± SD for three separate experiments.
To determine whether Kv1.3 channels are involved in this proliferation, we used AgTx-2 and ChTx at >20 times theirKd values for blocking Kv1.3. At these concentrations the toxins do not block Kv1.5 channels. However, 4-AP should block both Kv1.3 and Kv1.5, and although the published Kd values vary (Table 3), 5 mm is ≥10 Kdfor both channels. Adding 5 nm AgTx-2 at 0 DIC had no effect when proliferation was measured at 5 DIC, but significantly reduced it when measured at 10 DIC (by 60% compared with the control value at 10 DIC). The lack of a role for Kv1.3 at early times is not surprising, given the low incidence of Kv1.3 membrane protein expression and current for the first few days in culture. In contrast with AgTx-2, 4-AP profoundly reduced the proliferation measured at 5 DIC, and this difference in blocker sensitivity strongly implicates Kv1.5 in controlling proliferation at early times. From the increase in effectiveness of AgTx-2, Kv1.3 assumes a greater role in proliferation by 10 DIC compared with earlier times, consistent with its increasing prevalence and membrane expression. Because 4-AP is a more potent inhibitor of proliferation than AgTx-2 at 10 DIC, it appears that both Kv1.3 and Kv1.5 channels are important at this time. ChTx (50 nm), which blocks Kv1.3-like current in microglia (Schlichter et al., 1996; Eder, 1998), was much more effective than AgTx-2 at both 5 and 10 DIC, suggesting that it does more than block Kv1.3 channels. Interestingly, ChTx is known to block some Ca2+-dependent K+ currents in immune cells (Lewis and Cahalan, 1995; Eder, 1998; Khanna et al., 1999).
DISCUSSION
Changes in expression of Kv channels as tissue prints are cultured
Previously, the Kv current in cultured microglia was thought to be Kv1.3, based on similar current properties and the presence of Kv1.3 mRNA (Norenberg et al., 1994; Schlichter et al., 1996; Eder, 1998). Surprisingly, the Kv current in tissue-printed hippocampal microglia from 0–5 DIC differed in important ways from Kv1.3. There was very slow inactivation and lack of cumulative (use-dependent) inactivation, the voltage dependencies of activation and steady-state inactivation were shifted to depolarized potentials, 4-AP blocked moderately well but the sensitivities to TEA, ChTx, and MgTx were much lower than for Kv1.3 or the Kv previously described in cultured microglia. Most importantly, AgTx-2, which potently inhibits Kv1.3, did not block the current. Voltage dependence is not a well conserved property; for instance, we have found post-insertional changes in the voltage dependence of Kv1.3 (Pahapill and Schlichter, 1990; Chung and Schlichter 1997).
Differences in toxin sensitivity and cumulative inactivation appear to be diagnostic because cloned and native Kv1.3 channels show the same pharmacology and cumulative inactivation (Grissmer et al., 1994). Our results strongly argue that the current is not Kv1.3 but instead resembles Kv1.5 (Table 3). Unfortunately, there is no high-affinity selective Kv1.5 blocker, and 4-AP is not diagnostic because it blocks almost all Kv channels at similar concentrations. From the pharmacological and biophysical properties (Grissmer et al., 1994;Chandy and Gutman, 1995; Garcia et al., 1997; Mathie et al., 1998), several Kv channels are unlikely candidates for the early current. Kv1.1, 1.3, and 1.6 are very sensitive to AgTx-2, and Kv1.2 is sensitive to charybdotoxin and margatoxin, but even 10–50 nm of these toxins did not significantly reduce the current. TEA (5 mm) should have blocked Kv1.1, 1.6, 2.1, 2.2, and 3.1–3.4, but the effect was nonsignificant. Lack of rapid (N-type) inactivation appears to rule out Kv1.4, 4.1–4.3. These biophysical and pharmacological properties are entirely consistent with the immunocytochemical evidence that most of these microglia express abundant Kv1.5 protein on the membrane.
As the tissue prints were cultured, the percentage of microglia expressing detectable Kv current decreased. Changes in the current's biophysical and pharmacological properties included increases in inactivation rate and degree of cumulative inactivation, an increased sensitivity to AgTx-2, and hyperpolarizing shifts in the activation and steady-state inactivation curves. After >10 DIC, the Kv current in tissue-printed microglia was very similar to Kv1.3 (Table 3). In addition, the number of microglia expressing Kv1.3 immunoreactivity and localization to the membrane increased with time in culture. Thus, Kv1.3 is upregulated in microglia as tissue prints are cultured, and this channel is implicated as a major component of the Kv current. Although it is not possible to rule out involvement of Kv1.2 or 1.6, their mRNA levels are low in cultured microglia. In tissue-printed microglia, Kv1.5 and Kv1.3 proteins are abundantly expressed, and their properties can account for the types and changes in the currents observed. Therefore, the simplest interpretation of our data is that there is a switch in Kv1.5 and Kv1.3 expression.
Like other Kv channels within the same family (Isacoff et al., 1990;Ruppersberg et al., 1990), Kv1.5 and Kv1.3 could form heteromultimers in microglia. However, given the incidence and localization of channels, this is unlikely to occur in our system at both early and late times. From 0–5 DIC, only ∼15% of microglia expressed detectable Kv1.3 immunoreactivity, and where examined with confocal microscopy (e.g., Fig. 8), it was largely intracellular, whereas Kv1.5 was present in 95% of microglia and was highly expressed on the surface of those cells examined. Conversely, at >10 DIC, 49% of cells had detectable Kv1.5 but it was mainly intracellular, whereas Kv1.3 was highly expressed on the surface of 72% of the cells. Because at intermediate times 88% of cells expressed Kv1.5 and 65% expressed Kv1.3—if expression is on the membrane—an intriguing possibility is that the proportion of heteromeric channels increases with time in culture, conferring increasing cumulative inactivation and sensitivity to block by AgTx-2.
Biological implications of changes in Kv expression
Most studies of microglia have used dissociated cultures, and Kv current expression has been highly variable (Eder, 1998): from no detectable current (Kettenmann et al., 1990, 1993; Brockhaus et al., 1993) to substantial current (Korotzer and Cotman, 1992; Norenberg et al., 1994; Schlichter et al., 1996). The hypothesis that Kv current is absent from resting cells (Kettenmann et al., 1990; Brockhaus et al., 1993) and upregulated by microglial activation (Norenberg et al., 1994;Fischer et al., 1995; Visentin et al., 1995; Gebicke-Haerter et al., 1996) has been challenged because ramified microglia, widely believed to represent resting cells, express a prominent Kv current when exposed to astrocytes or astrocyte-conditioned medium (Schmidtmayer et al., 1994; Eder et al., 1997). One group reported stronger Kv1.5 and weaker Kv1.3 immunostaining after rat microglia were activated with lipopolysaccharide (Pyo et al., 1997), but membrane channel localization and a corresponding Kv1.5-like current were not shown. Because Kv1.3-like current in cultured microglia is apparently affected by pro-inflammatory stimuli, cytokines, growth factors, and culturing conditions, multiple factors may control its expression and ability to contribute to cell function.
Microglia proliferation increased with time in the present study, as reported for dissociated cultures (Slepko and Levi, 1996). We now provide the first evidence that Kv channels play important roles in this proliferation and that the specific contributions of each Kv channel change, consistent with changes in their protein and current levels. That is, when the Kv1.3 blocker was added from 0–5 DIC, the period during which proliferation of control cells was dramatically increased, it had little effect, whereas the nonselective Kv blocker 4-AP profoundly reduced proliferation. Later (e.g., 10 DIC), Kv1.3 also contributed greatly to proliferation, as seen from the potent inhibition by AgTx-2. It is interesting that Kv1.5 protein turnover can be very rapid (∼4 hr) (Takimoto et al., 1993), and decreases in Kv1.5 mRNA and/or protein can occur in astrocytes and oligodendrocyte progenitor cells after several days in culture (Attali et al., 1997). The subcellular localization of the channel protein was not examined in those studies, and unlike microglia, Kv1.5 may not be required because Kv1.5 antisense oligonucleotide treatment did not inhibit oligodendrocyte proliferation (Attali et al., 1997).
It is unlikely that the change we observed in Kv current reflects a normal in vivo switch during early postnatal development, because it was not a function of the age of the young rats. That is, 95% of microglia had Kv1.5-like currents soon after the tissue prints were prepared, regardless of the animal's age (from 5 to 14 d old), nor did the change require a transition from resting (ramified) to activated (round/reactive) because it occurred in microglia with a unipolar/bipolar morphology. Instead, there was a strong correlation with the microglia proliferative state in vitro; the current was Kv1.5-like in nonproliferating and Kv1.3-like in proliferating cells. Colony-stimulating factor (CSF-1) (produced by astrocytes) stimulates microglia proliferation (Gehrmann et al., 1995), thus our previous finding is intriguing; i.e., Kv1.3-like current was present in dissociated cultured microglia for ∼2 weeks but disappeared after prolonged CSF-1 treatment (Schlichter et al., 1996). This may explain why Kv currents were expressed in only ∼22% of mouse microglia cultured for several weeks with CSF-1 (Fischer et al., 1995). The present study used microglia from rat hippocampus, as opposed to the usual cultures of enzymatically dissociated neopallium, which should have selected against hippocampal-derived microglia. In the future, it will be interesting to determine whether microglia from different brain regions express different types or amounts of Kv channels, perhaps as a result of local cellular influences. The tissue print technique we developed will greatly facilitate such studies.
Biophysical implications of a switch from Kv1.5 to Kv1.3 current include their different voltage dependencies, which will affect the membrane potentials over which the channels are active. The resulting window currents, which are particularly important for nonexcitable cells (Pahapill and Schlichter, 1990; Chung and Schlichter, 1997), will affect their ability to oppose both brief and long depolarizing influences, such as those resulting from activation of Cl− channels, ATP receptors, or Ca2+ channels (Kettenmann et al., 1993;Gebicke-Haerter et al., 1996; Schlichter et al., 1996). Lack of cumulative inactivation in Kv1.5 should result in increased channel availability after single or repetitive depolarizations. Furthermore, Kv1.5 and Kv1.3 channels might be subject to different forms of regulation, which could allow microglia to respond differently to receptor-linked stimuli depending on which channel is expressed. There are also therapeutic implications. If Kv1.5 is most important for “resting” cells and Kv1.3 is necessary for activated microglia functions, it may be possible to downregulate overactive microglia (e.g., after a stroke or acute brain injury) without compromising the functions of resting microglia (pinocytosis, growth factor, and cytokine production).
Footnotes
This study was supported by grants to L.C.S. from the Medical Research Council (MT-13657) and the Heart and Stroke Foundation of Canada (NA-3182, T3726). We are particularly indebted to R. Khanna for RT-PCR and Western blot analysis. We thank J. Trogadis for confocal imaging, X.-P. Zhu and L. Chen for assistance with immunofluorescence, and M. C. Chang for help with analysis and presentation. Dr. E. F. Stanley provided insightful comments on this manuscript.
Correspondence should be addressed to Dr. L. C. Schlichter, MC 11-417, Toronto Western Hospital, 399 Bathurst Street, Toronto, Ontario, Canada M5T 2S8. E-mail:schlicht@playfair.utoronto.ca.
REFERENCES
- 1.Attali B, Wang N, Kolot A, Sobko A, Cherepanov V, Soliven B. Characterization of delayed rectifier Kv channels in oligodendrocytes and progenitor cells. J Neurosci. 1997;17:8234–8245. doi: 10.1523/JNEUROSCI.17-21-08234.1997. [DOI] [PMC free article] [PubMed] [Google Scholar]
- 2.Bertoli A, Moran O, Conti F. Activation and deactivation properties of rat brain K+ channels of the Shaker-related subfamily. Eur Biophys J. 1994;23:379–384. doi: 10.1007/BF00188662. [DOI] [PubMed] [Google Scholar]
- 3.Brockhaus J, Ilschner S, Banati RB, Kettenmann H. Membrane properties of amoeboid microglial cells in the corpus callosum slice from early postnatal mice. J Neurosci. 1993;13:4412–4421. doi: 10.1523/JNEUROSCI.13-10-04412.1993. [DOI] [PMC free article] [PubMed] [Google Scholar]
- 4.Cai YC, Douglass J. In vivo and in vitro phosphorylation of the T lymphocyte type n (Kv1.3) potassium channel. J Biol Chem. 1993;268:23720–23727. [PubMed] [Google Scholar]
- 5.Chamak B, Mallat M. Fibronectin and laminin regulate the in vitro differentiation of microglial cells. Neuroscience. 1991;45:513–527. doi: 10.1016/0306-4522(91)90267-r. [DOI] [PubMed] [Google Scholar]
- 6.Chandy KG, Gutman GA. Voltage-gated potassium channel genes. In: North RA, editor. Handbook of receptors and channels: ligand and voltage-gated ion channels. CRC; Boca Raton, FL: 1995. pp. 1–71. [Google Scholar]
- 7.Chung I, Schlichter LC. Native Kv1.3 channels are upregulated by protein kinase C. J Membr Biol. 1997;156:73–85. doi: 10.1007/s002329900189. [DOI] [PubMed] [Google Scholar]
- 8.Damoiseaux JG, Dopp EA, Calame W, Chao D, MacPherson GG, Dijkstra CD. Rat macrophage lysosomal membrane antigen recognized by monoclonal antibody ED1. Immunology. 1994;83:140–147. [PMC free article] [PubMed] [Google Scholar]
- 9.Dijkstra CD, Dopp EA, Joling P, Kraal G. The heterogeneity of mononuclear phagocytes in lymphoid organs: distinct macrophage subpopulations in the rat recognized by monoclonal antibodies ED1, ED2 and ED3. Immunology. 1985;54:589–599. [PMC free article] [PubMed] [Google Scholar]
- 10.Dubois JM, Rouzair-Dubois B. Role of potassium channels in mitogenesis. Prog Biophys Mol Biol. 1993;59:1–21. doi: 10.1016/0079-6107(93)90005-5. [DOI] [PubMed] [Google Scholar]
- 11.Eder C. Ion channels in microglia (brain macrophages). Am J Physiol. 1998;275:C327–C342. doi: 10.1152/ajpcell.1998.275.2.C327. [DOI] [PubMed] [Google Scholar]
- 12.Eder C, Klee R, Heinemann U. Distinct soluble astrocytic factors induce expression of outward K+ currents and ramification of brain macrophages. Neurosci Lett. 1997;226:147–150. doi: 10.1016/s0304-3940(97)00281-4. [DOI] [PubMed] [Google Scholar]
- 13.Fadool DA, Holmes TC, Berman K, Dagan D, Levitan IB. Tyrosine phosphorylation modulates current amplitude and kinetics of a neuronal voltage-gated potassium channel. J Neurophysiol. 1997;78:1563–1573. doi: 10.1152/jn.1997.78.3.1563. [DOI] [PubMed] [Google Scholar]
- 14.Fischer HG, Eder C, Hadding U, Heinemann U. Cytokine-dependent K+ channel profile of microglia at immunologically defined functional states. Neuroscience. 1995;64:183–191. doi: 10.1016/0306-4522(94)00398-o. [DOI] [PubMed] [Google Scholar]
- 15.Garcia ML, Hanner M, Knaus H-G, Koch R, Schmalhofer W, Slaughter RS, Kaczorowski GJ. Pharmacology of potassium channels. Adv Pharmacol. 1997;39:425–471. doi: 10.1016/s1054-3589(08)60078-2. [DOI] [PubMed] [Google Scholar]
- 16.Gebicke-Haerter PJ, Van Calker D, Norenberg W, Illes P. Molecular mechanisms of microglial activation. A. Implications for regeneration and neurodegenerative diseases. Neurochem Int. 1996;29:1–12. [PubMed] [Google Scholar]
- 17.Gehrmann J, Matsumoto Y, Kreutzberg GW. Microglia: intrinsic immunoeffector cell of the brain. Brain Res Rev. 1995;20:269–287. doi: 10.1016/0165-0173(94)00015-h. [DOI] [PubMed] [Google Scholar]
- 18.Graeber MB. Microglia, macrophages, and the blood-brain barrier. Clin Neuropathol. 1993;12:296–297. [PubMed] [Google Scholar]
- 19.Grissmer S, Nguyen AN, Aiyar J, Hanson DC, Mather RJ, Gutman GA, Karmilowicz MJ, Auperin DD, Chandy KG. Pharmacological characterization of five cloned voltage-gated K+ channels, types Kv1.1, 1.2, 1.3, 1.5 and 3.1, stably expressed in mammalian cell lines. Mol Pharmacol. 1994;45:1227–1234. [PubMed] [Google Scholar]
- 20.Hailer NP, Jarhult JD, Nitsch R. Resting microglial cells in vitro: analysis of morphology and adhesion molecule expression in organotypic hippocampal slice cultures. Glia. 1996;18:319–331. doi: 10.1002/(sici)1098-1136(199612)18:4<319::aid-glia6>3.0.co;2-s. [DOI] [PubMed] [Google Scholar]
- 21.Ichinose M, Asai M, Sawada M. Activation of outward current by pituitary adenylate cyclase activating polypeptide in mouse microglial cells. J Neurosci Res. 1998;51:382–390. doi: 10.1002/(SICI)1097-4547(19980201)51:3<382::AID-JNR11>3.0.CO;2-9. [DOI] [PubMed] [Google Scholar]
- 22.Isacoff EY, Jan YN, Jan LY. Evidence for the formation of heteromultimeric potassium channels in Xenopus oocytes. Nature. 1990;345:530–534. doi: 10.1038/345530a0. [DOI] [PubMed] [Google Scholar]
- 23.Jou I, Pyo H, Chung S, Jung SY, Gwag BJ, Joe EH. Expression of Kv1.5 K+ channels in activated microglia in vivo. Glia. 1998;24:408–414. [PubMed] [Google Scholar]
- 24.Kettenmann H, Hoppe D, Gottmann K, Banati R, Kreutzberg G. Cultured microglial cells have a distinct pattern of membrane channels different from peritoneal macrophages. J Neurosci Res. 1990;26:278–287. doi: 10.1002/jnr.490260303. [DOI] [PubMed] [Google Scholar]
- 25.Kettenmann H, Banati R, Walz W. Electrophysiological behavior of microglia. Glia. 1993;7:93–101. doi: 10.1002/glia.440070115. [DOI] [PubMed] [Google Scholar]
- 26.Khanna R, Chang MC, Joiner WJ, Kaczmarek LK, Schlichter LC. hSK4/hIK1, a calmodulin-binding KCa channel in human T lymphocytes: roles in proliferation and volume regulation. J Biol Chem. 1999;274:14838–14849. doi: 10.1074/jbc.274.21.14838. [DOI] [PubMed] [Google Scholar]
- 27.Korotzer AR, Cotman CW. Voltage-gated currents expressed by rat microglia in culture. Glia. 1992;6:81–88. doi: 10.1002/glia.440060202. [DOI] [PubMed] [Google Scholar]
- 28.Kotecha SA, Schlichter LC. Early expression of a novel K+ current in rat microglia. Soc Neurosci Abstr. 1998;24:830. [Google Scholar]
- 29.Kotecha SA, Eley DW, Turner RW. Tissue printed cells from teleost electrosensory and cerebellar structures. J Comp Neurol. 1997;386:277–292. [PubMed] [Google Scholar]
- 30.Kreutzberg GW. Microglia: a sensor for pathological events in the CNS. Trends Neurosci. 1996;19:312–318. doi: 10.1016/0166-2236(96)10049-7. [DOI] [PubMed] [Google Scholar]
- 31.Lawson LJ, Perry VH, Dri P, Gordon S. Heterogeneity in the distribution and morphology of microglia in the normal adult mouse brain. Neuroscience. 1990;39:151–170. doi: 10.1016/0306-4522(90)90229-w. [DOI] [PubMed] [Google Scholar]
- 32.Lewis RS, Cahalan MD. Potassium and calcium channels in lymphocytes. Annu Rev Immunol. 1995;13:623–653. doi: 10.1146/annurev.iy.13.040195.003203. [DOI] [PubMed] [Google Scholar]
- 33.Mathie A, Wooltorton JR, Watkins CS. Voltage-activated potassium channels in mammalian neurons and their block by novel pharmacological agents. Gen Pharmacol. 1998;30:13–24. doi: 10.1016/s0306-3623(97)00034-7. [DOI] [PubMed] [Google Scholar]
- 34.Milligan CE, Cunningham TJ, Levitt P. Differential immunochemical markers reveal the normal distribution of brain macrophages and microglia in the developing rat brain. J Comp Neurol. 1991;314:125–135. doi: 10.1002/cne.903140112. [DOI] [PubMed] [Google Scholar]
- 35.Norenberg W, Gebicke-Haerter PJ, Illes P. Voltage-dependent potassium channels in activated rat microglia. J Physiol (Lond) 1994;475:15–32. doi: 10.1113/jphysiol.1994.sp020046. [DOI] [PMC free article] [PubMed] [Google Scholar]
- 36.Ogura KI, Ogawa M, Yoshida M. Effects of aging on microglia in the normal rat brain: immunohistochemical observations. NeuroReport. 1994;5:1224–1226. doi: 10.1097/00001756-199406020-00016. [DOI] [PubMed] [Google Scholar]
- 37.Pahapill PA, Schlichter LC. Modulation of potassium channels in human T lymphocytes: effects of temperature. J Physiol (Lond) 1990;422:103–126. doi: 10.1113/jphysiol.1990.sp017975. [DOI] [PMC free article] [PubMed] [Google Scholar]
- 38.Perry VH, Gordon S. Microglia and macrophages. In: Keane RW, Hickey WF, editors. Immunology of the nervous system. Oxford UP; New York: 1997. p. 824. [Google Scholar]
- 39.Philipson LH, Malyev A, Kuzetsov A, Chang C, Nelson DJ. Functional and biochemical characterization of the human potassium channel Kv1.5 with a transplanted carboxy-terminal epitope in stable mammalian cell lines. Biochem Biophys Acta. 1993;1153:111–121. doi: 10.1016/0005-2736(93)90282-5. [DOI] [PubMed] [Google Scholar]
- 40.Pyo H, Chung S, Jou I, Gwag B, Joe EH. Expression and function of outward K+ channels induced by lipopolysaccharide in microglia. Mol Cells. 1997;7:610–614. [PubMed] [Google Scholar]
- 41.Roy ML, Saal D, Perney T, Sontheimer H, Waxman SG, Kaczmarek LK. Manipulation of the delayed rectifier Kv1.5 potassium channel in glial cells by antisense oligodeoxynucleotides. Glia. 1996;18:177–184. doi: 10.1002/(SICI)1098-1136(199611)18:3<177::AID-GLIA2>3.0.CO;2-X. [DOI] [PubMed] [Google Scholar]
- 42.Ruppersberg JP, Schroter KH, Sakmann B, Stocker M, Sewing S, Pongs O. Heteromultimeric channels formed by rat brain potassium-channel proteins. Nature. 1990;345:535–537. doi: 10.1038/345535a0. [DOI] [PubMed] [Google Scholar]
- 43.Sambrook J, Fritsch EF, Maniatis T. Molecular cloning: a laboratory manual, Ed 2. Cold Spring Harbor Laboratory; Cold Spring Harbor, NY: 1989. [Google Scholar]
- 44.Schlichter LC, Sakellaropoulos G, Ballyk B, Pennefather PS, Phipps DJ. Properties of K+ and Cl− channels and their involvement in proliferation of rat microglial cells. Glia. 1996;17:225–236. doi: 10.1002/(SICI)1098-1136(199607)17:3<225::AID-GLIA5>3.0.CO;2-#. [DOI] [PubMed] [Google Scholar]
- 45.Schmidtmayer J, Jacobsen C, Miksch G, Sievers J, Parwaresch R. Blood monocytes and spleen macrophages differentiate into microglia-like cells on monolayers of astrocytes: membrane currents. Glia. 1994;12:259–267. doi: 10.1002/glia.440120403. [DOI] [PubMed] [Google Scholar]
- 46.Slepko N, Levi G. Progressive activation of adult microglial cells in vitro. Glia. 1996;16:241–246. doi: 10.1002/(SICI)1098-1136(199603)16:3<241::AID-GLIA6>3.0.CO;2-4. [DOI] [PubMed] [Google Scholar]
- 47.Sobko A, Peretz A, Shirihai O, Etkin S, Cherepanova V, Dagan D, Attali B. Heteromultimeric delayed-rectifier K+ channels in Schwann cells: developmental expression and role in proliferation. J Neurosci. 1998;18:10398–10408. doi: 10.1523/JNEUROSCI.18-24-10398.1998. [DOI] [PMC free article] [PubMed] [Google Scholar]
- 48.Spencer RH, Sokolov Y, Li H, Takenaka B, Milici AJ, Aiyar J, Nguyen A, Park H, Jap BK, Hall JE, Gutman GA, Chandy KG. Purification, visualization, and biophysical characterization of Kv1.3 tetramers. J Biol Chem. 1997;272:2389–2395. doi: 10.1074/jbc.272.4.2389. [DOI] [PubMed] [Google Scholar]
- 49.Streit WJ, Kincaid-Colton CA. The brain's immune system. Sci Am. 1995;273:54–61. doi: 10.1038/scientificamerican1195-54. [DOI] [PubMed] [Google Scholar]
- 50.Streit WJ, Graeber MB, Kreutzberg GW. Functional plasticity of microglia: a review. Glia. 1988;1:301–307. doi: 10.1002/glia.440010502. [DOI] [PubMed] [Google Scholar]
- 51.Takimoto K, Fomina AF, Gealy R, Levitan ES. Dexamethasone rapidly induces Kv1.5 K+ channel gene transcription and expression in cloned pituitary cells. Neuron. 1993;11:359–369. doi: 10.1016/0896-6273(93)90191-s. [DOI] [PubMed] [Google Scholar]
- 52.Uebele VN, England SK, Gallagher DJ, Snyders DJ, Bennett PB, Tamkun MM. Distinct domains of the voltage-gated K+ channel Kvβ1.3 β-subunit affect voltage-dependent gating. Am J Physiol. 1998;274:C1485–C1495. doi: 10.1152/ajpcell.1998.274.6.C1485. [DOI] [PubMed] [Google Scholar]
- 53.Visentin S, Agresti C, Patrizio M, Levi G. Ion channels in rat microglia and their different sensitivity to lipopolysaccharide and interferon-γ. J Neurosci Res. 1995;42:439–451. doi: 10.1002/jnr.490420402. [DOI] [PubMed] [Google Scholar]
- 54.Wu CH, Wen CY, Shieh JY, Ling EA. A quantitative study of the differentiation of microglial cells in the developing cerebral cortex in rats. J Anat. 1993;182:403–413. [PMC free article] [PubMed] [Google Scholar]
- 55.Wu YP, Ling EA. Induction of microglial and astrocytic response in the adult rat lumbar spinal cord following middle cerebral artery occlusion. Exp Brain Res. 1998;118:235–242. doi: 10.1007/s002210050277. [DOI] [PubMed] [Google Scholar]
- 56.Zhou J, Jeron A, London B, Han X, Koren G. Characterization of a slowly inactivating outward current in adult mouse ventricular myocytes. Circ Res. 1998a;83:806–814. doi: 10.1161/01.res.83.8.806. [DOI] [PubMed] [Google Scholar]
- 57.Zhou W, Cayabyab FS, Pennefather PS, Schlichter LC, DeCoursey TE. HERG-like K+ channels in microglia. J Gen Physiol. 1998b;111:781–794. doi: 10.1085/jgp.111.6.781. [DOI] [PMC free article] [PubMed] [Google Scholar]