

Abstract
To elucidate the detailed organization of corticostriatal projections from rodent somatosensory cortex, the anterograde tracers biotinylated dextran amine (BDA) and fluoro-ruby (FR) were injected into separate parts of the whisker “barrel” representation. In one group of rats, the two tracers were injected into different barrel columns residing in the same row; in the other group of rats, the tracers were deposited into barrel columns residing in different rows. Reconstructions of labeled axonal varicosities in the neostriatum and ventrobasal thalamus were analyzed quantitatively to compare the extent of overlapping projections to these subcortical structures. For both groups of animals, corticostriatal projections terminated in densely packed clusters that occupied curved lamellar-shaped regions along the dorsolateral edge of the neostriatum. When the tracers were injected into different whisker barrel rows, the distribution of BDA- and FR-labeled terminals in the neostriatum followed a crude somatotopic organization in which the amount of overlap was approximately the same as in the ventrobasal thalamus. When both tracers were injected into the same whisker barrel row, however, the amount of corticostriatal overlap was significantly higher than the amount of overlap observed in the ventrobasal thalamus. These results indicate that corticostriatal projections from whisker barrel cortex have an anisotropic organization that correlates with the pattern of vibrissal movements during whisking behavior.
Keywords: anterograde tracing, axonal varicosities, convergence, divergence, neostriatum, pattern recognition, somatosensory cortex, ventrobasal thalamus
The dorsolateral neostriatum receives excitatory projections from primary somatosensory (SI) cortex, presumably to regulate movements, posture, and other somesthesis-guided behaviors (McGeorge and Faull, 1989; Flaherty and Graybiel, 1991;Brown, 1992). Corticostriatal projections from SI cortex do not follow a typical “one-to-one” sensory mapping pattern, but have a complex topography in which divergent and convergent connections are superimposed on each other. Thus, each somatotopic representation in SI cortex projects to multiple regions in the dorsolateral neostriatum (Malach and Graybiel, 1986; Flaherty and Graybiel, 1994; Alloway et al., 1998; Brown et al., 1998; Wright et al., 1998), and many of these regions receive overlapping projections from related parts of sensorimotor cortex (Flaherty and Graybiel, 1993).
The principles governing corticostriatal overlap remain an important issue for understanding neostriatal function because several facts suggest that neostriatal activity depends on convergent inputs from the cerebral cortex. Medium spiny neurons, which comprise 90% of the neuronal population in the neostriatum, exhibit long silent periods that are intermittently interrupted by bursts of action potentials (Wilson et al., 1983). These neurons have a strong rectifying potassium current that shunts weak excitatory input and prevents action potentials except, perhaps, when the neurons are strongly depolarized by excitatory inputs over large portions of their dendritic field. Each medium spiny neuron receives only a few synapses from a single corticostriatal axon (Kincaid and Wilson, 1998), and it appears that many corticostriatal neurons must discharge to evoke neostriatal activity (Wilson, 1995). Because related cortical areas often project to overlapping parts of the neostriatum, it has been hypothesized that neostriatal neurons may signal when specific cortical regions are coactivated (Houk, 1995).
The SI vibrissal representation of rats and other rodents is an ideal model for studying the principles of corticostriatal convergence. Rodent SI contains a grid-like isomorphic map of the vibrissal field in which each mystacial whisker is represented by a “barrel” in layer IV (Woolsey and Van der Loos, 1970; Killackey and Leshin, 1975; Welker, 1976; Simons, 1978; Land and Simons, 1985b). Adjacent barrels representing whiskers in the same row are interconnected to a much greater degree than barrels representing whiskers in different rows (Bernardo et al., 1990a,b; McCasland et al., 1991). This is significant because several reports suggest that interconnected cortical areas are likely to send convergent projections to the neostriatum (Yeterian and Van Hoesen, 1978; Flaherty and Graybiel, 1991; Parthasarathy et al., 1992). Presumably, the density of interconnections between barrel columns in the same row is related to the repetitive back-and-forth sweeping movements made by the whiskers along the axis of each row during exploratory behavior. Furthermore, as a rat makes whisking movements to acquire tactile information about its environment, whiskers within a row are sequentially stimulated as they contact external objects (Carvell and Simons, 1990). Based on these factors— greater intracortical connectivity along each barrel row, repetitive whisking movements along the row axis, and the patterned sequence of cutaneous stimulation during whisking behavior— we hypothesize that corticostriatal projections from barrel columns in the same row are likely to overlap in the dorsolateral neostriatum. We tested this hypothesis by measuring the amount of corticostriatal overlap originating from barrel columns residing in the same or different rows of SI cortex. We also compared neostriatal overlap with that observed in the ventrobasal thalamus to determine if corticostriatal convergence was merely a function of cortical proximity.
MATERIALS AND METHODS
Experiments were conducted on male Sprague Dawley rats ranging between 300 and 400 gm. All animal procedures were reviewed by our institutional animal welfare committee and are in compliance with National Institutes of Health guidelines for the use and care of laboratory animals.
Animal surgery. A surgical level of anesthesia was induced in each rat by administering ketamine (20 mg/kg) and xylazine (6 mg/kg) intramuscularly. Each animal also received atropine sulfate (0.05 mg/kg) to reduce bronchial secretions, and chloromycetin sodium succinate (50 mg/kg) to help prevent infection. After intubating the animal through the oral cavity with a 16 gauge plastic tube, the rat's head was immobilized in a stereotaxic frame. Anesthesia was maintained throughout the surgery by ventilating the animal with a 2:1 mixture of nitrous oxide and oxygen containing 0.5% halothane. Ophthalmic ointment was placed on each eye to prevent corneal drying, and body temperature was maintained by placing the animal between a heated water pad and a thermostatically controlled homeothermic blanket. End-tidal CO2, EKG, and body temperature were continuously displayed throughout the procedure.
The cranium overlying the left or right hemisphere was exposed, and a small cavity (500-μm-diameter) was slowly drilled through the bone overlying the SI whisker representations (2.0 mm posterior and 5.5 mm lateral to bregma, according to Chapin and Lin, 1984). A small probe, obtained from one-half of a pair of fine forceps, was used to remove the final layer of bone and to expose the dura mater and surface blood vessels. A 27 gauge needle was used to make a tiny incision through the dura, and a carbon fiber electrode (Armstrong-James and Millar, 1978) was lowered through the incision to record multiunit activity. Neural discharges were amplified and displayed by conventional means, and individual whiskers were stimulated with a slender rod to determine the best whisker for activating neuronal discharges when the electrode reached a cortical depth of 800–1000 μm. A second hole was drilled through the cranium at a site located more lateral (across whisker barrel rows) or rostral (within the same whisker barrel row) to the first opening. Multiunit recording was repeated at the second site to determine its vibrissal representation.
Tracer injections. A 10% solution of fluoro-ruby (FR) (D-1817; Molecular Probes, Eugene, OR) was loaded into a glass pipette (100 μm tip) that had previously been cemented to a 30 gauge needle on a 1.0 μl Hamilton syringe. The Hamilton syringe was placed in a microinjection unit (model 5000; Kopf, Tujunga, CA), which was secured to a microelectrode holder on the stereotaxic frame. Depending on the lateral distance from the midline, the microinjection assembly and pipette were oriented at angles ranging from 25 to 45° so that the pipette passed orthogonally through successive layers of the same cortical column in the SI whisker barrel representation. At a depth of 1.4 mm below the pial surface, a volume of 25 nl of FR was deposited. After 5 min, the pipette was raised to a depth of 1.2 mm, and another 25 nl of tracer was deposited. After waiting another 5 min, the pipette was raised to a depth of 1.0 mm where a third 25 nl volume of FR was injected. The pipette remained in place another 10 min before being withdrawn from the brain.
A second glass pipette (35–40 μm tip) was filled with a 10% solution of biotinylated dextran amine (BDA) (D-1956; Molecular Probes) and was lowered 1.4 mm into the brain. Positive current pulses of 4.0 μA were used to eject BDA in alternating on/off periods (7 sec each) for a duration of 7–8 min. An ammeter in series with the constant current stimulator (BSI-2; Bak Electronics, Inc., Germantown, MD) was used to verify current delivery. Subsequently, the pipette was partially withdrawn, and BDA iontophoresis was repeated at cortical depths of 1.20 and 1.00 mm to insure the tracer was deposited throughout the infragranular layers. Using these procedures, the cortical volumes infiltrated by FR or BDA were approximately the same. After injections were completed, the wound margins were sutured, and the animal was returned to its home cage for 6–8 d.
Histology. After allowing 1 week for axoplasmic transport of both tracers, each rat was deeply anesthetized with sodium pentobarbital (50 mg/kg, i.p.), and its head was immobilized in a stereotaxic frame. Four small holes were drilled in the cranium, and a thin tungsten rod coated with India ink was used to make fiduciary marks at rostral and caudal locations in the brain. Each rat was transcardially perfused with 500 ml of cold 0.9% saline containing 1000 U.S.P. units of heparin and 20 mg of lidocaine. After desanguination, the rat was perfused with 500 ml of cold 4% paraformaldehyde in 0.1 m phosphate buffer followed by 500 ml of 4% paraformaldehyde with 5% sucrose. The brain was removed and refrigerated in 4% paraformaldehyde with 30% sucrose for 16 hr. Subsequently, the cerebral cortex was dissected from the underlying external capsule, and the resulting cortical slab was flattened between two glass slides. The flattened cortical slab and the remaining hemisphere were stored in cold fixative and 30% sucrose for another 24 hr. The cortical slab was frozen and sectioned tangentially into 50 μm sections. The remaining hemisphere was also frozen and sectioned coronally into 50 μm sections.
Alternate serially ordered sections from the flattened cortex and underlying hemisphere were processed for BDA labeling as described previously (Kincaid and Wilson, 1996; Alloway et al., 1998). Briefly, free-floating sections were washed in 0.1 m phosphate buffer (PB) with 0.25% Triton X-100 and incubated in activated avidin–biotinylated horseradish peroxidase complex (PK-4000; Vector/Novocastra Laboratories, Burlingame, CA) for 2 hr at 37°C. The sections were washed again in PB and incubated with 0.05% diaminobenzidine (DAB) and 0.005% hydrogen peroxide in 0.1m Tris buffer. The DAB solution contained 0.25% NiCl to produce a purple–black reaction product. The sections were washed again in 0.1 m PB, mounted onto gelatin-coated slides, and dried overnight. The mounted sections were defatted in xylene and coverslipped with Cytoseal.
An Olympus light microscope equipped for fluorescent microscopy was used to view corticostriatal terminals impregnated with BDA or FR. The fluorescent FR-labeled terminals were visualized in the BDA-processed sections by viewing them with light transmitted through a TRITC filter cube (Chroma Technology, Brattleboro, VT) that had excitation filters permitting transmission from 540 to 580 nm and emission filters permitting transmission from 590 to 660 nm. The BDA-labeled terminals were then viewed with conventional light microscopy after blocking the fluorescent light source. Alternate coronal sections through the thalamus and neostriatum were stained for Nissl material and were viewed with light microscopy to reconstruct their boundaries as depicted in Paxinos and Watson (1986).
Alternate serially ordered tangential sections through SI cortex were processed for cytochrome oxidase (CO) using procedures previously described (Wong-Riley, 1979; Land and Simons, 1985a). Briefly, sections were rinsed in 0.1 m PB and incubated for 8 hr in 0.05% DAB, 0.05% cytochrome C, and sucrose at 40°C. The sections were rinsed in 0.1 m PB, mounted in serial order on gelatin-coated slides, and dried overnight. The mounted sections were post-fixed in neutral formalin for 30 min, rinsed in distilled water, and dipped in an ascending series of ethanol baths. Sections were placed in xylene for 5 min and coverslipped with Permount.
Anatomic reconstructions. A 35 mm camera was used to obtain photomicrographs of the tracer injection sites and the CO-labeled SI whisker barrels. The photomicrographs were scanned and imported into a computer file. A software drawing program (Canvas 6.0; Deneba Systems, Miami, FL) was used to draw outlines of the injection sites with respect to blood vessels in layer V and with respect to CO-labeled whisker barrels in layer IV. These drawings were used to identify the whisker barrel columns invaded by the tracer injections and to measure the distance separating the boundaries of the injections in layer V.
Coronal sections containing BDA- and FR-labeled structures in the thalamus and neostriatum were inspected with 20 and 40× objectives. This magnification allows visualization of beaded varicosities appearing along the length of corticostriatal and corticothalamic axons densely impregnated with BDA or FR (Fig.1). Ultrastructural analysis of corticostriatal terminals has demonstrated that these beaded varicosities contain synaptic vesicles and, thus, appear to represent corticostriatal synapses (Kincaid et al., 1998). We used a microscopic reconstruction system (MD-3; Minnesota Datametrics, St. Paul, MN) to plot the location of the beaded varicosities seen in BDA- or FR-labeled corticostriatal and corticothalamic terminals. In addition to reconstructing the topography of these corticofugal projections, we also plotted the location of retrogradely labeled cell bodies in the thalamus. We sometimes observed neostriatal cells that were retrogradely labeled with FR, but never observed neostriatal cells labeled with BDA. Compared to the retrogradely labeled thalamic neurons, the neostriatal FR-labeled cells were extremely faint in appearance, and it is unlikely that these cells gave rise to the puffs of densely impregnated terminals appearing in the neostriatum. Brightly labeled perivascular cells were often labeled by FR throughout the brain, but their processes had a discontinuous, granular appearance that allowed them to be distinguished from the continuous labeling seen in densely impregnated corticostriatal terminals. Although the exact reason for perivascular labeling is unknown, vascular transport of FR from the injection site may facilitate this labeling.
Fig. 1.

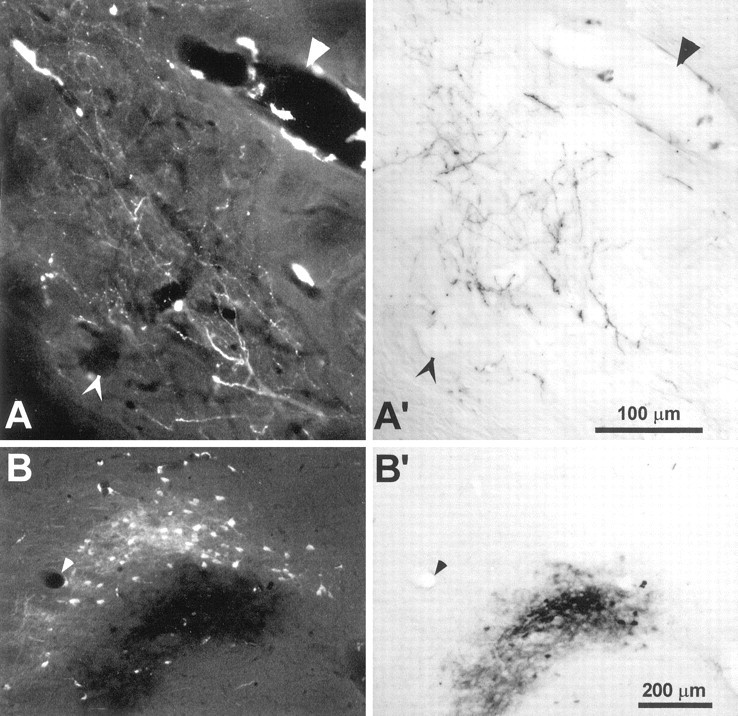
Photomicrographs of isolated branches of corticostriatal terminals labeled by injections of FR or BDA into SI barrel cortex. A, FR-labeled corticostriatal terminals in the neostriatum of rat D45. B, BDA-labeled axons in the neostriatal neuropil of rat D48; some axons appear blurred because they lie outside the focal plane. Arrowheads indicate some of the beaded varicosities appearing along the length of the labeled axons. The scale bar applies to both panels.
In addition to plotting labeled retrogradely labeled cells and corticofugal terminals, the MD-3 reconstruction system was used to plot the anatomic boundaries of the thalamus and neostriatum. Digital reconstructions of the labeled processes and surrounding anatomic landmarks were stored on computer disk and were analyzed with the use of a JAVA-based software program written by one of the authors (S.A.R.). This program is similar to software used in other laboratories to perform gradient density analyses (He et al., 1993). Our program subdivided each plotted section into an array of 35 μm2 bins. Bins containing two or more FR-labeled varicosities were colored red; bins containing two or more BDA-labeled varicosities were colored blue. Those bins containing projections from both injections sites (at least two BDA- and two FR-labeled varicosities) were colored white. The number of red, blue, and white bins in the neostriatum and thalamus were counted for each section and were summed across sections to determine the total number of bins in the neostriatum and thalamus that were occupied by BDA- or FR-labeled processes. To indicate the proportion of BDA- and FR-labeled projections that overlapped with each other, the ratio of white bins to colored bins was calculated separately for the thalamus and neostriatum. Thus, the number of white bins divided by the number of blue or red bins yielded an index for BDA or FR overlap, respectively. In addition, the number of white bins divided by the sum of all red, blue, and white bins yielded an index of total overlap.
Technical considerations for quantifying corticofugal overlap. Quantification of terminal overlap is influenced by bin size and threshold criteria. If small bins (e.g., 5 μm2) and high thresholds (e.g., >10 varicosities per bin) are used, the amount of corticostriatal overlap would appear minimal; by comparison, large bins and low thresholds tend to maximize the proportion of labeled bins that contain overlapping projections.
We used 35 μm2 bins to characterize the distribution of corticostriatal and corticothalamic labeling for several reasons. The dominant factor in choosing this bin size was that larger bins yielded overlapping distributions in cases where the labeled terminals were clearly segregated. When we examined the thalamic nucleus reticularis, for example, we frequently observed separate patches of labeled corticothalamic terminals that were lumped together when bins larger than 35 μm2were used. We decided not to use bins smaller than 35 μm2 because many facts suggest that information is integrated over larger, not smaller, areas of the neostriatum. Thus, dendrites and local axon collaterals of medium spiny cells and other types of neostriatal neurons may extend 150–200 μm or more from the soma of the cell (Preston et al., 1980; Wilson and Groves, 1980; Kawaguchi et al., 1990). Furthermore, corticostriatal projections from somatosensory cortex frequently terminate in well-defined clusters extending several hundred micrometers (Flaherty and Graybiel, 1994; Kincaid and Wilson, 1996). Although there is no consensus regarding the specific dimensions of functional processing modules in the neostriatum, these facts suggest that a bin size of 35 μm2 represents a reasonable compromise among the spectrum of possible choices.
Only bins that contained at least two varicosities labeled by BDA or FR were counted in our analysis. For our operational definition of overlapping projections, we required a bin to contain a minimum of two FR-labeled and two BDA-labeled varicosities. Our analysis did not count bins that contained only one labeled varicosity because we wished to avoid analyzing neostriatal regions where the density of labeling was extremely low. We frequently observed regions with a high density of labeled varicosities, but we did not require more than four overlapping varicosities per bin because of the inherent difficulty in plotting high-density labeling with any degree of accuracy. Although we could not reconstruct the density of terminal labeling, our technique effectively indicates the topography of corticostriatal projections that originate from a focal injection site.
RESULTS
A total of 32 animals received injections of BDA and FR into separate regions of SI barrel cortex. We only analyzed those cases in which both tracers produced patches of labeling in the neostriatum and thalamus; if thalamic or neostriatal labeling was absent, the case was discarded. We also discarded cases in which the tracers were deposited into the external capsule or cases in which the neostriatum was damaged during cortical dissection. Based on these criteria, we were able to analyze corticostriatal and corticothalamic projections in 17 rats. In eight cases, BDA and FR were injected into different rows of barrel cortex; in the remaining nine cases, both tracers were injected into the same row. Table 1indicates the whisker barrel location and edge-to-edge separation of BDA and FR injection sites for the “across row” and “within row” cases.
Table 1.
Location and separation of BDA and FR injection sites
| SI barrel injection sites | Layer V separation (μm) | ||
|---|---|---|---|
| BDA | FR | ||
| Across rows | |||
| D7 | B3,4 | D1 E1 | 790 |
| D11 | A2,3,4 B2,3 | C1,2 D1,2 | 390 |
| D41 | C4 | E2 | 880 |
| D42 | C4,5 | E1,2 | 850 |
| D48 | D2 | C3 | 120 |
| D49 | B2,3 | E3 | 1530 |
| D51 | C2,3 | E2 | 630 |
| D52 | B3,4 | E2 | 1200 |
| Within rows | |||
| D25 | E6,7 | E1,2 | 1110 |
| D30 | D4,5 | C2 D2 | 730 |
| D35 | D3,4 | D1 | 860 |
| D37 | D1,2 | D3 | 400 |
| D39 | C2 D2 | D4,5 | 800 |
| D43 | δγ | D4 | 1740 |
| D44 | C2 D2 | D4,5 | 730 |
| D45 | E4 | E2 | 760 |
| D46 | E5 | E2,3 | 930 |
Corticostriatal projections from different barrel rows
To verify the extent of tracer diffusion with respect to the whisker barrels, SI cortex was sectioned tangentially, and the outlines of the BDA and FR injection sites were traced with respect to the CO-labeled barrels appearing in layer IV. Figure2 illustrates the results of this procedure in the animal (D11) that received the largest BDA and FR injections in SI barrel cortex. As Figure 2 indicates, BDA diffused into multiple barrels occupying rows A and B, whereas FR invaded barrels occupying rows C and D. In most cases, injection sites had diameters ranging from 500 to 1000 μm and, because the largest barrels are only 400–600 μm in diameter, this meant that most injections involved more than one whisker barrel column (Table 1).
Fig. 2.
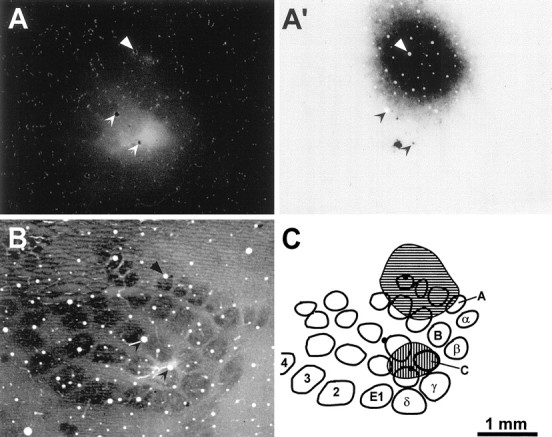
Topography of FR and BDA injections into different rows of SI barrel cortex of rat D11. A, Photomicrograph of a tangential section through layer V of SI cortex reveals the extent of the FR injection. A′. Another view of the same section in A indicates that BDA was injected into a region of SI that did not overlap with the FR injection site.B, A tangential section through layer IV of SI cortex was labeled for CO to indicate the location of individual whisker barrels in the right hemisphere of rat D11. C, Outline drawing of the CO-labeled barrels shown in B.Hatching indicates the relative location of the FR and BDA injections sites shown in A and A′, respectively. This reconstruction indicates that BDA diffused into barrels A2, A3, A4, B2, and B3, whereas FR diffused into barrels C1, C2, D1, and D2. All panels are illustrated at identical scales;arrowheads or filled circles indicate the same set of blood vessels in each panel.
Reconstructions of the distribution of neostriatal labeling in animal D11 are illustrated in Figure 3. Consistent with other reports indicating whisker-sensitive regions in the neostriatum (Carelli and West, 1991; Mittler et al., 1994; Brown and Sharp, 1995), we found that the majority of labeled projections terminated in the dorsolateral part of the neostriatum. Multiple patches of FR- and BDA-labeled varicosities occupied widespread regions of the neuropil, and the pattern of labeling in the neostriatum was similar for both tracers. Thus, the densest patches of labeled terminals tended to aggregate in curved lamellar-shaped strips along the lateral margin of the neostriatum just below the external capsule. These lamellae did not necessarily occupy a continuous region, however, because the labeled neuropil was occasionally interrupted by unlabeled neuropil or by compact bundles of fibers projecting to the thalamus and other subcortical areas. Some patches of labeled neuropil were located more medially in a zone distinctly separate from the lateral neostriatum and, if enough of these medial patches were present, they sometimes appeared as curved lamellae that resembled those located beneath the external capsule (Fig. 3). Although tracer injections in all animals involved focal regions of SI cortex, neostriatal labeling along the rostrocaudal axis usually extended over 3–4 mm. In the most caudal sections of the neostriatum, however, labeling was not present in the medial zone, and the lateral zone of labeling was positioned more ventrally.
Fig. 3.
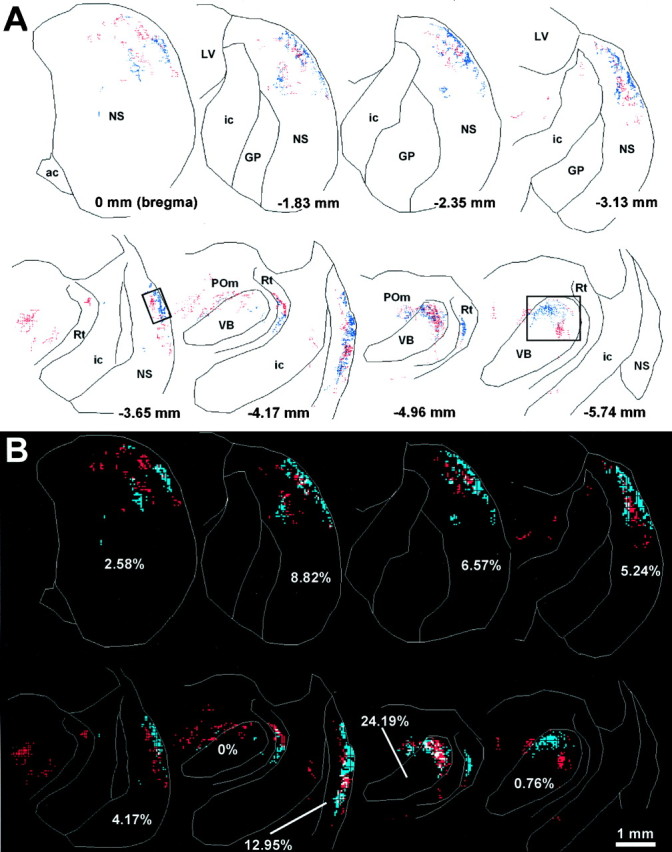
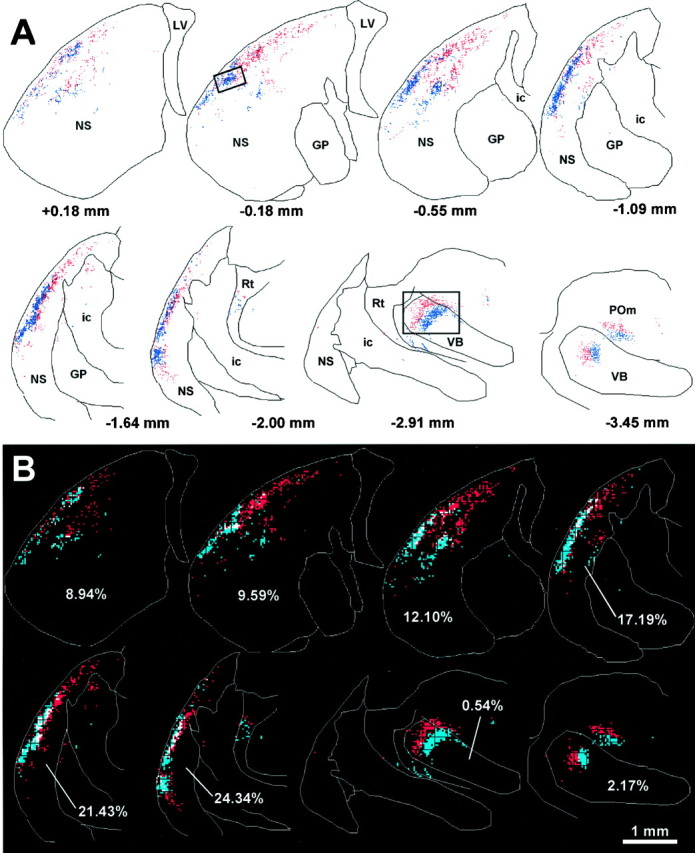
Topography of labeled terminal varicosities in the neostriatum and thalamus after injections of FR and BDA into different barrel rows of rat D11. A, Reconstructions of selected coronal sections show the relative pattern of corticostriatal projections from the FR and BDA injection sites. In these and subsequent reconstructions, each red or blue dot marks the location of a beaded varicosity labeled with FR or BDA, respectively. Photomicrographs of the region shown in the rectangular insets appear in Figure 4. ac, Anterior commissure; ic, internal capsule; GP, globus pallidus; LV, lateral ventricle;NS, neostriatum; POm, medial posterior nucleus; Rt, nucleus reticularis; VB, ventrobasal complex. B, Overlap analysis of FR- and BDA-labeled varicosities in the neostriatum and thalamus. Each reconstructed plot in A was subdivided into a grid of 35 μm2 bins, and the number of FR- and BDA-labeled varicosities in each bin was counted. Bins containing at least two FR- or BDA-labeled varicosities were colored red orblue, respectively; those containing at least two of each type of labeled varicosity were colored white. Percentages indicate the proportion of white-colored bins in the neostriatum or ventrobasal complex of each section.
Injections of BDA and FR into different rows of SI barrel cortex produced multiple neostriatal lamellae that followed a crude topographic organization. In the part of the neostriatum lying adjacent to the external capsule, the densest labeling was topographically organized so that row A whiskers were represented laterally, and row E whiskers were represented more medially. As illustrated in Figure4, for example, the densest BDA-labeled projections from SI barrels in rows A and B terminated in the neostriatal rim abutting the external capsule, whereas the densest projections from rows C and D terminated slightly more medially in a nonoverlapping strip of neuropil. This result corroborates a previous report indicating that the dorsolateral neostriatum contains a crude somatotopic map of the different rows of mystacial whiskers (Wright et al., 1998). Furthermore, in sections having a high density of labeling in both the lateral and medial zones of the neostriatum, the whisker rows were represented twice as mirror images of each other. Thus, progressing medially from the external capsule toward the internal capsule, the lateral series of labeled strips followed a sequence of rows A through E, whereas the second, more medial, series of strips followed the reverse order of rows E through A.
Fig. 4.
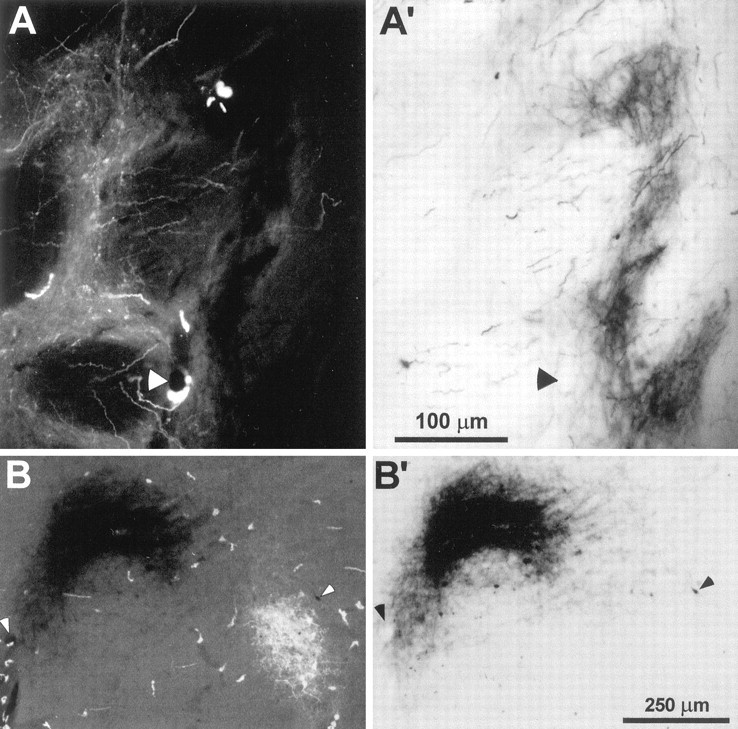
Photomicrographs of FR and BDA labeling in the neostriatum and ventrobasal complex of rat D11. A,FR-labeled corticostriatal terminals enclosed by theinset in Figure 3A (3.65 mm posterior to bregma). A′, Another view of the same section inA reveals BDA-labeled terminals in a neighboring region of neuropil. B, FR and BDA labeling in the nucleus VPM as indicated by the inset in Figure 3A(5.74 mm posterior to bregma). B′, Another view of the same section in B reveals BDA-labeled corticothalamic terminals. Magnification of A and B are the same as A′ and B′, respectively;arrowheads indicate the same blood vessels in each pair of panels.
The relative location of BDA and FR labeling in rat D11 suggests that only a small portion of the neostriatum receives convergent projections from different rows of SI barrel cortex (Fig. 3). To assess corticostriatal overlap quantitatively, we subdivided each of the reconstructed sections into bins and counted the number of bins containing projections from one or both injection sites (see Materials and Methods). As shown in Figure 3B, most of the labeled bins in rat D11 represented one tracer or the other but not both. Indeed, as indicated by Table 2, the proportion of labeled bins in the neostriatum of D11 that contained overlapping projections from both injection sites was only 4.8%.
Table 2.
Case-by-case comparison of overlap in the neostriatum and ventrobasal complex
| BDA overlap2-a | FR overlap2-a | Total overlap2-a | Overlap ratio (NS/VB) | ||||
|---|---|---|---|---|---|---|---|
| NS | VB | NS | VB | NS | VB | ||
| Across rows | |||||||
| D7 | 6.7 | 3.2 | 5.6 | 6.9 | 3.1 | 2.3 | 1.35 |
| D11 | 8.3 | 15.9 | 10.4 | 17.8 | 4.8 | 9.2 | 0.52 |
| D41 | 7.1 | 20.9 | 4.1 | 6.5 | 2.7 | 5.2 | 0.52 |
| D42 | 2.8 | 16.5 | 1.8 | 9.9 | 1.1 | 6.6 | 0.17 |
| D48 | 19.2 | 11.8 | 3.8 | 21.9 | 3.3 | 8.3 | 0.40 |
| D49 | 0.5 | 0.2 | 0.3 | 0.2 | 0.2 | 0.1 | 2.00 |
| D51 | 5.9 | 6.9 | 4.8 | 5.0 | 2.7 | 3.0 | 0.90 |
| D52 | 1.2 | 3.7 | 1.2 | 2.7 | 0.7 | 1.6 | 0.44 |
| Within rows | |||||||
| D25 | 5.3 | 1.4 | 3.7 | 1.3 | 2.2 | 0.6 | 3.67 |
| D30 | 24.6 | 4.6 | 17.6 | 5.9 | 11.4 | 2.6 | 4.38 |
| D35 | 16.3 | 2.4 | 5.0 | 1.9 | 4.0 | 1.1 | 3.64 |
| D37 | 28.4 | 17.5 | 12.3 | 16.3 | 12.3 | 9.2 | 1.34 |
| D39 | 33.4 | 6.9 | 14.0 | 5.4 | 11.0 | 3.1 | 3.55 |
| D43 | 10.8 | 2.2 | 3.0 | 1.8 | 2.4 | 1.0 | 2.40 |
| D44 | 16.7 | 1.5 | 2.0 | 0.4 | 1.8 | 0.3 | 6.00 |
| D45 | 26.6 | 10.2 | 11.2 | 9.5 | 8.6 | 5.2 | 1.65 |
| D46 | 21.6 | 4.4 | 13.6 | 3.4 | 9.1 | 1.9 | 4.79 |
Values are expressed as percentages.
Corticostriatal projections from a single row
Although recent work indicates the dorsolateral neostriatum contains a crude somatotopic map of the SI barrel rows (Wright et al., 1998), no study has investigated how corticostriatal projections from barrels within the same row might relate to each other. Therefore, in several rats we injected BDA and FR into separate parts of the same barrel row to determine if their corticostriatal projections terminated in segregated or overlapping parts of the neostriatum.
A representative example of a within row experiment is illustrated in Figure 5. In this case (rat D30), FR was injected into the septal region between rows C and D, and the tracer diffused into barrels D2 and C2. The BDA injection site was located in barrel D5, although some of the tracer diffused into barrel D4. Because of the difficulty in limiting tracer diffusion to a single barrel column, it was not uncommon for one or both tracers to diffuse into multiple rows of SI barrel cortex (Table 1). Nonetheless, cases where both tracers involved the same whisker barrel row were always classified as within row experiments.
Fig. 5.
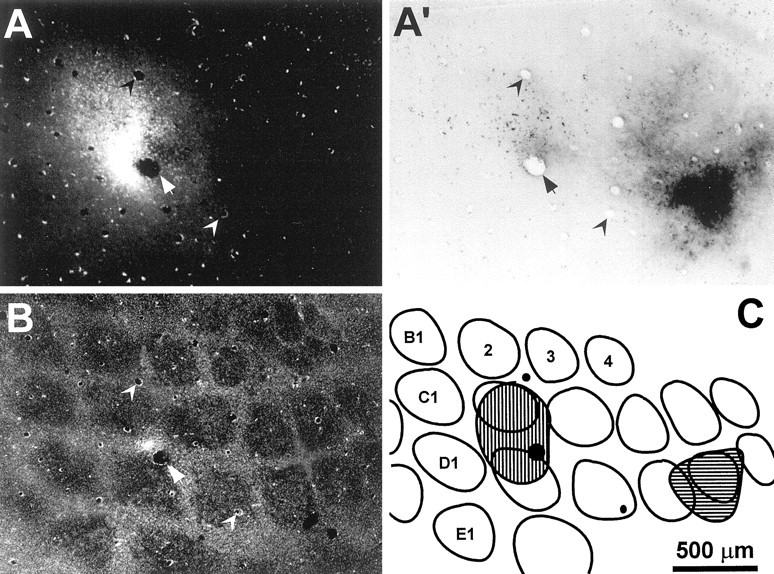
Topography of FR and BDA injections into the same rows of SI barrel cortex in rat D30. A, Photomicrograph of a tangential section through layer V of SI cortex reveals the FR injection site. A′, Another view of the same section inA indicates that the BDA injection site did not overlap with the FR injection site. B, A tangential section through layer IV of SI cortex was labeled for CO to indicate the location of individual whisker barrels in the left hemisphere of rat D30. The center of the FR injection site appears in the septal region between two whisker barrels. C, Outline drawing of the CO-labeled barrels shown in B. Hatching indicates the relative location of the FR and BDA injections sites shown inA and A′, respectively. This reconstruction indicated that the injected BDA diffused into barrels D4 and D5, whereas the injected FR diffused into barrels C2 and D2. All panels are illustrated at identical scales; arrowheadsor filled circles indicate the same set of blood vessels in each panel.
The distribution of BDA and FR corticostriatal labeling in rat D30 is illustrated in Figure 6. As in the across row experiments, we observed multiple patches of labeled corticostriatal terminals residing in curved lamellae located in the superficial aspect of the dorsolateral neostriatum. In some sections, labeled patches of each tracer also appeared more medially to form a second lamellar-shaped region of labeling (Fig. 6). Thus, the distribution of corticostriatal labeling was similar to the topographic patterns described previously (Brown et al., 1998; Wright et al., 1998).
Fig. 6.
Topography of corticostriatal and corticothalamic projections after injections of FR and BDA into the same whisker barrel rows of rat D30. Reconstructed plots and overlap analysis of selected coronal sections are depicted as in Figure 3. Photomicrographs of the region enclosed by the insets appear in Figure 7.
In contrast to these previous reports, however, the relative distribution of BDA and FR labeling in the within row experiments revealed several aspects of corticostriatal organization that were not apparent when the tracers were injected into different whisker barrel rows. As shown in Figure 6, corticostriatal projections from barrels representing the posterior whiskers (e.g., D2) terminated in more dorsal regions of each lamellar-shaped strip, whereas projections from sites representing more anterior whiskers (e.g., D4) were located more ventrally. More importantly, these lamellar-shaped distributions merged into each other and occupied overlapping parts of the neostriatal neuropil. When the distribution of labeled corticostriatal projections in rat D30 were analyzed quantitatively, we found many labeled bins that contained overlapping projections from both injection sites. Although the amount of tracer overlap varied considerably across sections (Fig. 6B), the total proportion of neostriatal bins that contained overlapping projections in rat D30 was 11.4%, or more than twice the total overlap measured in a typical across row case such as rat D11 (Table 2). Photomicrographs of a neostriatal region in D30 that contained overlapping BDA- and FR-labeled terminals appear in Figure7.
Fig. 7.
Photomicrographs of FR and BDA labeling in the neostriatum and ventrobasal complex of rat D30. A,FR-labeled corticostriatal terminals enclosed by theinset in Figure 6A (0.18 mm posterior to bregma). A′, Another view of the same section in A reveals BDA-labeled terminals in an overlapping part of the neostriatal neuropil. B, FR and BDA labeling in the nucleus VPM (2.91 posterior to bregma).B′, Another view of the same section in Breveals BDA-labeled corticothalamic terminals. Magnification ofA and B are the same as A′and B′, respectively; arrowheads indicate the same blood vessels in each pair of panels. Near some blood vessels in A and B are FR-labeled perivascular cells whose processes were easily discriminated from labeled corticostriatal or corticothalamic terminals.
Topography of thalamic labeling
All animals listed in Table 1 exhibited labeled processes in several thalamic nuclei, especially the ventrobasal complex (VB), the medial part of the posterior complex (POm), the nucleus reticularis (Rt) and, to a lesser extent, the ventromedial nucleus, and parts of the intralaminar nuclei. This distribution of labeling is comparable to thalamic labeling patterns described by other laboratories after injections of neuronal tracers into barrel cortex (for review, seeDiamond, 1995).
Consistent with findings showing that VB and SI barrel cortex are reciprocally connected (Hoogland et al., 1987; Chmielowska et al., 1989; Land et al., 1995), we observed retrogradely labeled soma and dendrites as well as anterogradely labeled axon terminals in overlapping parts of VB. These compact, densely labeled regions in VB were usually 200–500 μm in diameter and extended rostrocaudally for 1–2 mm, in accord with the description of corticothalamic projections from the cortical barrel field of mice (Hoogland et al., 1987). As indicated by photomicrographs in Figures 4, 7, and8, the central area of labeling was so dense that it was usually impossible to distinguish labeled axons from other processes. To mark the spatial extent of labeling in these densely labeled regions, we moved the microscope stage along one axis and plotted the labeled processes as they passed under the cross hairs of the eyepiece; the microscope stage was then shifted orthogonally 25–50 μm, and this process was repeated as the stage moved in the reverse direction. In regions where thalamic labeling was less dense, we plotted the labeled corticothalamic varicosities appearing along the length of densely impregnated axons, and avoided the tracer granules appearing in the dendrites of retrogradely labeled cells. Inspection of the photomicrographs and subsequent reconstructions of VB labeling indicate that this process produced accurate representations of the spatial extent of VB labeling (compare the thalamic insets in Figs.3A and 6A with the photomicrographs in Figs. 4B and 7B). As indicated by our photomicrographs, retrogradely labeled cell bodies were usually scattered throughout the plexus of corticothalamic terminals and their beaded varicosities.
Fig. 8.
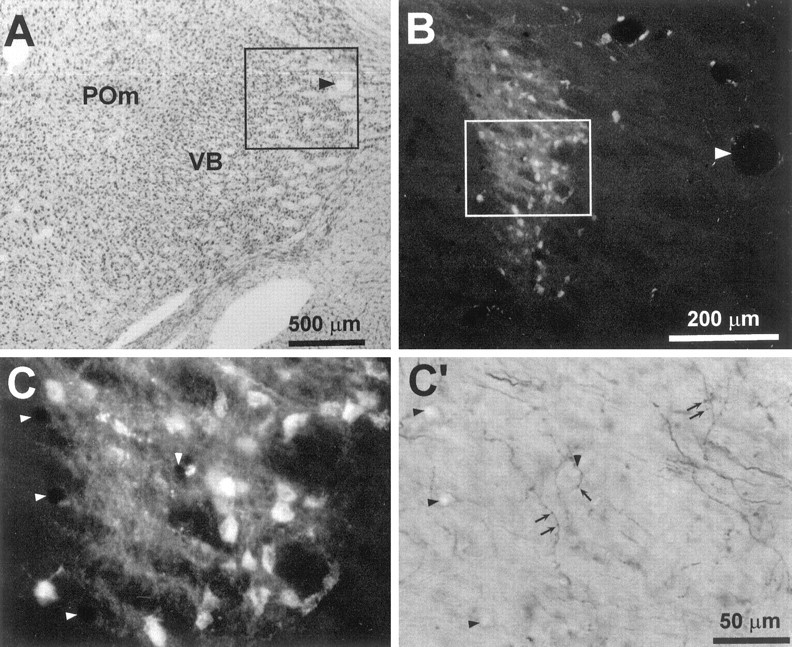
Photomicrographs indicating overlapping corticothalamic projections in the ventrobasal complex of rat D30.A, Thionin-stained coronal section (5.02 mm posterior to bregma) indicating the cytoarchitecture of the ventrobasal complex and nucleus POm. The inset encloses the region appearing inB; arrowhead indicates a prominent blood vessel. B, FR-labeled cell bodies and corticothalamic terminals in an adjacent coronal section (5.08 mm posterior to bregma).Arrowhead indicates the same blood vessel indicated inA. C, C′, Microscopic views of BDA- and FR-labeled processes appearing in theinset of B. Arrowsindicate some of the BDA-labeled varicosities that overlapped with FR-labeled processes; arrowheads indicate the same blood vessels appearing in both panels.
Consistent with its role as the primary thalamic nucleus for relaying specific somatosensory information to SI cortex, the relative labeling patterns in VB were topographically organized. When viewed in coronal sections, corticothalamic projections from the ventral whisker representations (SI barrel rows E and D) occupied regions that were ventral to the corticothalamic projections from the more dorsal whisker representations (SI barrel rows A and B) (Fig. 3B). In experiments in which the tracers were placed in the same whisker row, the caudal whisker representations (SI barrel rows A1-E1) projected to VB regions that were lateral to projections from the more rostral whisker representations (SI barrel rows A4-E4) (Fig. 6B). These patterns are consistent with other reports that have characterized the topography of the rodent VB vibrissal representation in coronal sections (Hoogland et al., 1987; Ito, 1988; Sugitani et al., 1990).
The labeled regions in VB often abutted each other when the BDA and FR injection sites in SI were in close proximity, but the densely labeled core regions for each tracer remained segregated. The margins surrounding these core regions contained substantially less labeling but often included overlapping corticothalamic projections from both injection sites. The only exception to these findings appeared in the most rostral levels of the VB where corticothalamic axons labeled by one tracer often traversed a region that was densely labeled by the other tracer. Figure 8, for example, illustrates a region in the rostral VB (5.06 mm posterior to bregma) of rat D11 in which several BDA-labeled corticothalamic projections passed through a dense plexus of terminals and cell bodies labeled with FR. In more caudal (5.74 mm posterior to bregma) sections through VB of the same animal, however, BDA- and FR-labeled processes occupied nonoverlapping regions (Figs. 3, 4).
Compared to the larger zones of labeling in VB, labeling in the nucleus reticularis occupied a smaller, more slender region and had a wispy quality because the labeling consisted entirely of axon terminals. Previous reports indicate that the nucleus reticularis receives collateral axons from corticothalamic projections that originate primarily from layers V and VI (Wise and Jones, 1977; Hoogland et al., 1987). Terminal labeling was present in the nucleus reticularis of each animal, and this finding indicates that all BDA and FR injection sites included the infragranular layers of the SI whisker barrel columns.
We observed both anterogradely labeled terminals and retrogradely labeled cell bodies in the nucleus POm. In rostral sections through the thalamus, labeling in VB and POm were sometimes fused along their common boundary because the whisker representations in these nuclei form mirror images of each other (Fabri and Burton, 1991). To determine whether labeled varicosities were located in VB or POm, the nuclear outlines of these regions were plotted from adjacent thionin-stained sections and then were superimposed onto the reconstructed plots of BDA and FR labeling. Progressing caudally in the thalamus, labeling in VB and POm split apart to form two separate entities. Labeling in POm was less dense than in VPM and corticothalamic-labeled terminals in POm had large, glomerular-like endings as described previously (Hoogland et al., 1987). As in the VB complex, BDA- and FR-labeled processes in the POm occupied separate regions and appeared to be somatotopically organized, as described in other reports (Fabri and Burton, 1991;Diamond et al., 1992). Although some reports indicate that POm does not possess the same degree of topographic precision as VB (Hoogland et al., 1987; Lu and Lin, 1993), Table 3indicates that we observed similar amounts of overlap in the distributions of BDA- and FR-labeled corticothalamic terminals in both of these nuclei.
Table 3.
Comparison of overlap among the thalamic nuclei
| Thalamic nuclei | BDA overlap | FR overlap | Total overlap |
|---|---|---|---|
| VB | 8.1 ± 1.6 | 7.3 ± 1.5 | 3.8 ± 0.7 |
| POm | 8.8 ± 2.4 | 5.8 ± 1.4 | 3.6 ± 1.0 |
| Rt | 8.7 ± 1.6 | 10.1 ± 2.6 | 4.7 ± 1.1 |
Values are expressed as the mean percentage ± SEM.
Comparison of neostriatal and thalamic overlap
The amount of overlap in the neostriatum may vary with several factors, including differences in the proximity of the cortical injection sites. To ascertain the role of this factor in determining the relative pattern of corticostriatal projections, we compared the amount of overlap observed in the neostriatum and ventrobasal complex. This comparison was done because, although some divergence might be present among thalamocortical and corticothalamic projections (Hoogland et al., 1987), the vast majority of retrogradely and anterogradely labeled processes arising from specific whisker-related columns in SI cortex are confined to the corresponding barreloid in the ventrobasal thalamus (Chmielowska et al., 1989; Land et al., 1995). Consequently, any variations in the proximity of our cortical injections should affect the amount of overlapping labeled processes observed in the thalamus. Table 2 provides a case-by-case comparison of the overlap observed in the neostriatum and ventrobasal complex of the 17 animals analyzed in this study. Because of inherent differences in the denominators used to calculate each index of overlap (see Materials and Methods), the proportion of BDA or FR overlap was always larger than the proportion of total overlap. For each brain region, however, the magnitude of BDA and FR overlap for a particular animal were similar, and we used the index of total overlap for our subsequent analyses.
Statistical analysis of total overlap in the neostriatum revealed that the proportion of bins containing both BDA- and FR-labeled varicosities was higher among animals in which both tracer injections were placed in barrel columns residing in the same row of the vibrissal representation. Thus, in animals in which the tracers were placed in different rows, the amount of total overlap in the neostriatum was only 2.3 ± 1.5% (mean ± SEM). Among animals in which both tracers were placed in the same row, the mean amount of total overlap in the neostriatum was 7.0 ± 4.3%. A Student's ttest indicated that these group differences were statistically significant (t = 2.87; p < 0.05).
Analysis of total overlap in the ventrobasal complex suggests that individual variations were caused primarily by differences in the proximity of the cortical injection sites. Although the mean overlap in the ventrobasal complex of animals that received injections in the same row of barrels (2.8 ± 1.0%) was lower than the group mean for animals that received injections in different barrel rows (4.5 ± 3.3%), these differences were insignificant (t = 1.18;p > 0.20). It should be noted that the average separation between injection sites in layer V was only 798 ± 166 μm in the across row group, but was 895 ± 130 μm in the within row group. Furthermore, the angles of the two injections were different in animals receiving tracers across rows, and this meant that tracer deposits in layer VI, which contains corticothalamic neurons, were actually closer than 798 μm. Figure9A shows individual differences in thalamic overlap as a function of injection site separation and substantiates our view that most of the variation in thalamic overlap was caused by differences in the proximity of the cortical injection sites. Although a similar trend was observed when neostriatal overlap was plotted as a function of injection site separation (Fig. 9B), the amount of neostriatal overlap in the two groups of animals diverged when the edges of the injection sites were separated by <1000 μm. Therefore, to determine whether neostriatal overlap was proportional to the amount of overlap in the ventrobasal complex, we used a ratio of these two quantities (NS overlap/VB overlap) to normalize the comparison between the two groups of animals. For animals that received injections in different barrel rows, the mean overlap ratio (0.79 ± 0.23) indicated that neostriatal overlap was proportional to the amount of overlap measured in the ventrobasal complex. By comparison, in animals that received both tracers in the same row the overlap ratio (3.49 ± 0.53) indicated that neostriatal overlap was three to four times greater than would be predicted on the basis of overlap in the ventrobasal complex. Statistical analysis of the overlap ratios indicated that these group differences were significant (t = 4.74;p < 0.01).
Fig. 9.

Scatter diagrams illustrating changes in the amount of overlap as a function of the distance separating the injection sites in layer V. A, The amount of overlap in the ventrobasal complex was similar for both the “within row” and “across row” groups. Most of the individual variation was caused by differences in the cortical distances separating the injection sites.B, The amount of overlap in the neostriatum also varied inversely with the distance separating the cortical injection sites, but was noticeably greater among projections originating from barrel columns in the same row of SI cortex.
DISCUSSION
This study demonstrates that corticostriatal projections from the vibrissal representation of SI cortex are anisotropically organized. Not only does corticostriatal overlap vary as a function of cortical proximity, but the organization of corticostriatal projections from the vibrissal representation appears to be correlated with salient aspects of whisking behavior and the degree of intracortical connectivity. As discussed below, these findings have important implications for understanding the relationship between corticostriatal convergence and sensorimotor integration.
Principles of corticostriatal organization
There is widespread agreement that the neostriatum contains a complex somatotopic map in which individual body part representations are distributed across multiple discontinuous regions of the neuropil (Kunzle, 1977; Malach and Graybiel, 1986; Carelli and West, 1991;Flaherty and Graybiel, 1991, 1993; Brown, 1992; Mittler et al., 1994;Brown et al., 1998; Wright et al., 1998). The complexity of this somatotopic map derives from the divergent pattern of corticostriatal projections which, in turn, permits specific regions in the neostriatum to receive convergent projections from multiple cortical areas. To elucidate the principles governing this complex organization, many studies have characterized the relative topography of corticostriatal projections from cortical regions (i.e., different Brodmann areas) that are functionally related. That approach has shown that cortical areas representing the same body part or having related sensorimotor functions may project to overlapping neostriatal regions (Flaherty and Graybiel 1991, 1993; Parthasarathy and Graybiel, 1992; Updyke, 1993;Inase et al., 1996). Several studies suggest that interconnected cortical areas project to overlapping portions of the neostriatum (Yeterian and Van Hoesen, 1978; Van Hoesen et al., 1981; Cavada and Goldman-Rakic, 1991; Flaherty and Graybiel, 1991; Parthasarathy and Graybiel, 1992; Inase et al., 1996), but other findings indicate that corticocortical connectivity and corticostriatal convergence are not always associated (Selemon and Goldman-Rakic, 1985; Flaherty and Graybiel, 1993; Takada et al., 1998).
Instead of analyzing projections from separate cortical regions, the present study characterized corticostriatal projections from sites in the same cortical region and compared the amount of overlap from groups of sites having an orthogonal relationship (within-row barrels vs across-row barrels). Because barrel columns in the same row are more strongly interconnected than barrel columns in different rows (Bernardo et al.,1990a,b; McCasland et al., 1991; Hoeflinger et al., 1995; Kim and Ebner, 1999), this allowed us to analyze the role of cortical connectivity independent of spatial proximity. Consistent with reports showing that cortical regions in close proximity tend to project to adjacent parts of the neostriatum (Parthasarathy et al., 1992), we showed that corticostriatal projections from the SI whisker representation are somatotopically organized. As shown by Figure10, the neostriatum contains a pair of mirror-image representations of the mystacial vibrissae on the contralateral face. This neostriatal map is relatively crude because each barrel column has divergent projections that overlap the corticostriatal projections from neighboring barrels in the same row. There was substantially less overlap among projections originating from different barrel rows, however, and this supports the view that interconnected cortical areas are more likely to send convergent projections to the neostriatum.
Fig. 10.

Diagram of a coronal section through the neostriatum illustrating the topography of projections from the SI whisker barrel cortex. The lateral neostriatum contains a prominent representation of rows A–E; the medial neostriatum contains a smaller, mirror-image representation of rowsE–A. The relative location of whiskers within each row is represented by numbers 1 (posterior whisker) through6 (anterior) in row C. The gray regions illustrate the divergence of corticostriatal projections by showing areas that would be occupied by labeled terminals after tracer injections in barrel columns B2 and D5.GP, Globus pallidus; NS, neostriatum.
The mere fact that we detected overlapping projections in a given bin does not necessarily indicate synaptic convergence. Ultrastructural analysis is required to determine if any of the overlapping projections actually synapse on the same postsynaptic targets. Nonetheless, synaptic convergence cannot exist unless overlapping projections are present at the light microscopic level (Bevan et al., 1997), and our data indicate how synaptic convergence in the sensorimotor channel of the neostriatum is likely to be organized.
Whisking behavior and corticostriatal projections
Rodents exhibit a pattern of repetitive forward (protraction) and backward (retraction) sweeping movements of the mystacial vibrissae during exploratory behavior. These whisking movements occur in a frequency range of 5–11 Hz and are tightly coordinated with movements of the head, neck, and nose (Welker, 1964; Carvell and Simons, 1990). Whisking movements are controlled by two sets of striated muscles (Dorfl, 1982; Wineski, 1985). One set, the extrinsic muscles, move the entire mystacial pad forward but are not capable of moving individual whiskers. The other set, the intrinsic muscles, are responsible for moving individual whisker follicles. Each intrinsic muscle forms a sling as it wraps around the rostral part of the follicle at its base; therefore, contraction of the intrinsic muscle pulls the base of the whisker backward so that the distal end of the whisker pivots forward. The intrinsic muscles contract together and cause the whiskers to protract synchronously during whisking behavior (Carvell et al., 1991).
The overlapping topography of corticostriatal projections from whisker barrels within the same row of SI cortex appears consistent with available evidence concerning whisking behavior and the concomitant pattern of whisker stimulation. First, the mystacial whiskers move forward and backward, not upward and downward. Second, behavioral studies indicate that rats can use their whiskers to discriminate objects with similar textures if two adjacent whiskers in the same row are intact, but cannot perform this task if only a single whisker is present (Simons, 1995). Although the ability to perform this task was not tested with intact whiskers residing across different rows, it is clear that rats can integrate information from adjacent whiskers in the same row and may use this information to perform difficult discriminations. Finally, high-speed video analysis of trained rats performing a tactile discrimination indicates that adjacent whiskers within a row often contact an external stimulus in sequential order (Carvell and Simons, 1990, their Fig. 3). The pattern of whisker movements is complex, however, and adjacent whiskers may contact external objects in a spatially overlapping fashion even though the excursion of each individual vibrissa during whisker protraction is limited to ∼12°. Although the relative positions of the whiskers are not fixed at static coordinates, the geometry of the vibrissal pad and the limited excursion of individual vibrissae does not permit stimulus-induced whisker deflections to occur in a random pattern during whisking behavior. These findings suggest that the pattern of within-row whisker contact with an external stimulus is less likely to vary than the pattern of activation across different whisker rows (Fig.11). The fact that we observe substantial corticostriatal overlap when tracers are injected into the same barrel row, but not after injections in different rows, suggests that corticostriatal projections are an important component of the anatomical substrate that mediates the sensorimotor functions of whisking behavior.
Fig. 11.

Schematic diagram illustrating the rostrocaudal back-and-forth vibrissal movements during whisking behavior with respect to an external object at different orientations. Although the relative pattern of whisker stimulation across rows may vary significantly with changes in head orientation or stimulus angle, the temporal sequence of stimulation within a whisker row remains unaffected.
Neostriatal integration of sensorimotor information
Several findings suggest that neostriatal neurons may perform a pattern recognition function. The initial hint of this idea comes from work indicating that many sites in the neostriatum receive information from cortical areas representing body parts that move together, but they do not combine information from body parts that move independently of each other (Flaherty and Graybiel, 1991). Furthermore, in view of data indicating that medium spiny neurons have extremely low rates of activity and receive few excitatory synapses from a single cortical neuron, it is thought that neostriatal discharges may signal when convergent inputs from multiple cortical areas are active at the same time (Wilson, 1995). Our results, which indicate the predominance of overlapping corticostriatal projections from barrel columns in the same row, suggest that whisker-sensitive neostriatal neurons should respond when neighboring whiskers in the same row are stimulated simultaneously or in close temporal sequence. This prediction is consistent with a growing body of evidence indicating that neostriatal neurons respond to cortical inputs that reflect behaviorally relevant events (Apicella et al., 1992; Houk, 1995). Sequential or simultaneous stimulation of adjacent whiskers within a row is likely to represent a pattern of stimulation that rodents frequently encounter, and the specific spatiotemporal patterns of whisker activation may code for different features of objects that have behavioral significance. In accord with this suggestion, infragranular neurons in barrel cortex have firing patterns that appear to mimic stimulus movement in a particular direction across the vibrissal field (Simons, 1995).
To the extent that neostriatal activity depends on convergent corticostriatal pathways, cortical regions that send overlapping projections to the neostriatum should exhibit synchronous or near-coincident discharges to activate common postsynaptic targets in the neostriatum. This may explain why somatosensory and motor cortical areas 3b and 4, which become synchronized during manipulative behaviors (Murthy and Fetz, 1996a,b), send overlapping projections to the neostriatum even though these cortical regions are not directly interconnected (Jones et al., 1978; Ghosh et al., 1987). Although direct corticocortical connections may provide one type of substrate for synchronizing separate cortical regions, related cortical regions can also be synchronized by subcortical or multisynaptic corticocortical pathways. Hence, the apparent association between cortical interconnections and corticostriatal convergence could be a manifestation of one mechanism by which convergent corticostriatal pathways become synchronized. Other cortical areas that send convergent projections to the neostriatum, but are not directly interconnected, are probably synchronized by other neural mechanisms.
Footnotes
This work was supported by United States Public Health Service Grants NS-29363 and NS-37532 awarded to K.D.A., and by a Pennsylvania State University Computational Fellowship awarded to S.A.R. We thank Dr. John Hoover for his advice and constructive criticisms of earlier drafts of this manuscript.
Correspondence should be addressed to Dr. Kevin D. Alloway, Department of Neuroscience and Anatomy, H109 Hershey Medical Center, 500 University Drive, Hershey, PA 17033. E-mail: kda1@psu.edu.
REFERENCES
- 1.Alloway KD, Mutic JJ, Hoover JE. Divergent corticostriatal projections from a single cortical column in the somatosensory cortex of rats. Brain Res. 1998;785:341–346. doi: 10.1016/s0006-8993(97)01363-2. [DOI] [PubMed] [Google Scholar]
- 2.Apicella P, Scarnati E, Ljungberg T, Schultz W. Neuronal activity in monkey striatum related to the expectation of predictable environmental events. J Neurophysiol. 1992;68:945–960. doi: 10.1152/jn.1992.68.3.945. [DOI] [PubMed] [Google Scholar]
- 3.Armstrong-James M, Millar J. Carbon fibre microelectrodes. J Neurosci Methods. 1978;1:279–287. doi: 10.1016/0165-0270(79)90039-6. [DOI] [PubMed] [Google Scholar]
- 4.Bernardo KL, McCasland JS, Woolsey TA. Local axonal trajectories in mouse barrel cortex. Exp Brain Res. 1990a;82:247–253. doi: 10.1007/BF00231244. [DOI] [PubMed] [Google Scholar]
- 5.Bernardo KL, McCasland JS, Woolsey TA, Strominger RN. Local intra- and interlaminar connections in mouse barrel cortex. J Comp Neurol. 1990b;291:231–255. doi: 10.1002/cne.902910207. [DOI] [PubMed] [Google Scholar]
- 6.Bevan MD, Clarke NP, Bolam JP. Synaptic integration of functionally diverse pallidal information in the entopeduncular nucleus and subthalamic nucleus in the rat. J Neurosci. 1997;17:308–324. doi: 10.1523/JNEUROSCI.17-01-00308.1997. [DOI] [PMC free article] [PubMed] [Google Scholar]
- 7.Brown LL. Somatotopic organization in rat striatum: Evidence for a combinatorial map. Proc Nat Acad Sci USA. 1992;89:7403–7407. doi: 10.1073/pnas.89.16.7403. [DOI] [PMC free article] [PubMed] [Google Scholar]
- 8.Brown LL, Sharp FR. Metabolic mapping of rat neostriatum: somatotopic organization of sensorimotor activity. Brain Res. 1995;686:207–222. doi: 10.1016/0006-8993(95)00457-2. [DOI] [PubMed] [Google Scholar]
- 9.Brown LL, Smith DM, Goldblum LM. Organizing principles of cortical integration in the rat neostriatum: somatotopic organization of sensorimotor activity. J Comp Neurol. 1998;392:468–499. [PubMed] [Google Scholar]
- 10.Carelli RM, West MO. Representation of the body by single neurons in the dorsolateral striatum of the awake, unrestrained rat. J Comp Neurol. 1991;309:231–249. doi: 10.1002/cne.903090205. [DOI] [PubMed] [Google Scholar]
- 11.Carvell GE, Simons DJ. Biometric analyses of vibrissal tactile discrimination in the rat. J Neurosci. 1990;10:2638–2648. doi: 10.1523/JNEUROSCI.10-08-02638.1990. [DOI] [PMC free article] [PubMed] [Google Scholar]
- 12.Carvell GE, Simons DJ, Lichtenstein SH, Bryant P. Electromyographic activity of mystacial pad musculature during whisking behavior in the rat. Somatosens Mot Res. 1991;8:159–164. doi: 10.3109/08990229109144740. [DOI] [PubMed] [Google Scholar]
- 13.Cavada C, Goldman-Rakic PS. Topographic segregation of corticostriatal projections from posterior parietal subdivisions in the macaque monkey. Neuroscience. 1991;42:683–696. doi: 10.1016/0306-4522(91)90037-o. [DOI] [PubMed] [Google Scholar]
- 14.Chapin J, Lin CS. Mapping the body representation in SI cortex of anesthetized and awake rats. J Comp Neurol. 1984;229:199–213. doi: 10.1002/cne.902290206. [DOI] [PubMed] [Google Scholar]
- 15.Chmielowska J, Carvell GE, Simons DJ. Spatial organization of thalamocortical and corticothalamic projection systems in the rat SmI barrel cortex. J Comp Neurol. 1989;285:325–338. doi: 10.1002/cne.902850304. [DOI] [PubMed] [Google Scholar]
- 16.Diamond ME. Somatosensory thalamus of the rat. In: Jones EG, Diamond IT, editors. Cerebral cortex: the barrel cortex of rodents, Vol 11. Plenum; New York: 1995. pp. 189–219. [Google Scholar]
- 17.Diamond ME, Armstrong-James M, Ebner FF. Somatic sensory responses in the rostral sector of the posterior group (POm) and in the ventral posterior medial nucleus (VPM) of the rat thalamus. J Comp Neurol. 1992;318:462–476. doi: 10.1002/cne.903180410. [DOI] [PubMed] [Google Scholar]
- 18.Dorfl J. The musculature of the mystacial vibrissae of the white mouse. J Anat. 1982;135:147–154. [PMC free article] [PubMed] [Google Scholar]
- 19.Fabri M, Burton H. Topography of connections between primary somatosensory cortex and posterior complex in rat: a multiple fluorescent tracer study. Brain Res. 1991;538:351–357. doi: 10.1016/0006-8993(91)90455-5. [DOI] [PubMed] [Google Scholar]
- 20.Flaherty AW, Graybiel AM. Corticostriatal transformations in the primate somatosensory system. Projections from physiologically mapped body-part representations. J Neurophysiol. 1991;66:1249–1263. doi: 10.1152/jn.1991.66.4.1249. [DOI] [PubMed] [Google Scholar]
- 21.Flaherty AW, Graybiel AM. Two input systems for body representation in the primate striatal matrix: experimental evidence in the squirrel monkey. J Neurosci. 1993;13:1120–37. doi: 10.1523/JNEUROSCI.13-03-01120.1993. [DOI] [PMC free article] [PubMed] [Google Scholar]
- 22.Flaherty AW, Graybiel AM. Input-output organization of the sensorimotor striatum in the squirrel monkey. J Neurosci. 1994;14:599–610. doi: 10.1523/JNEUROSCI.14-02-00599.1994. [DOI] [PMC free article] [PubMed] [Google Scholar]
- 23.Ghosh S, Brinkman C, Porter R. A quantitative study of the distribution of neurons projecting to the precentral motor cortex in the monkey (M. fascicularis). J Comp Neurol. 1987;259:424–444. doi: 10.1002/cne.902590309. [DOI] [PubMed] [Google Scholar]
- 24.He SQ, Dum RP, Stick P. Topographic organization of corticospinal projections from the frontal lobe: motor areas on the lateral surface of the hemisphere. J Neurosci. 1993;13:952–980. doi: 10.1523/JNEUROSCI.13-03-00952.1993. [DOI] [PMC free article] [PubMed] [Google Scholar]
- 25.Hoeflinger BF, Bennett-Clarke CA, Chiaia NL, Killackey HP, Rhoades RW. Patterning of local intracortical projections within the vibrissae representation of rat primary somatosensory cortex. J Comp Neurol. 1995;311:405–424. doi: 10.1002/cne.903540406. [DOI] [PubMed] [Google Scholar]
- 26.Hoogland PV, Welker E, van der Loos H. Organization of the projections from barrel cortex to thalamus in mice studied with Phaseolus vulgaris-leucoagglutinin and HRP. Exp Brain Res. 1987;68:73–87. doi: 10.1007/BF00255235. [DOI] [PubMed] [Google Scholar]
- 27.Houk JC. Information processing in modular circuits linking basal ganglia and cerebral cortex. In: Houk JC, Davis JL, Beiser DG, editors. Models of information processing in the basal ganglia. MIT; Cambridge: 1995. pp. 3–9. [Google Scholar]
- 28.Inase M, Sakai ST, Tanji J. Overlapping corticostriatal projections from the supplementary motor area and the primary motor cortex in the macaque monkey: An anterograde double labeling study. J Comp Neurol. 1996;373:283–296. doi: 10.1002/(SICI)1096-9861(19960916)373:2<283::AID-CNE10>3.0.CO;2-M. [DOI] [PubMed] [Google Scholar]
- 29.Ito M. Response properties and topography of vibrissa-sensitive VPM neurons in the rat. J Neurophysiol. 1988;60:1181–1197. doi: 10.1152/jn.1988.60.4.1181. [DOI] [PubMed] [Google Scholar]
- 30.Jones EG, Coulter JD, Hendry SHC. Intracortical connectivity of architectonic fields in the somatic sensory, motor, and parietal cortex of monkeys. J Comp Neurol. 1978;181:291–348. doi: 10.1002/cne.901810206. [DOI] [PubMed] [Google Scholar]
- 31.Kawaguchi Y, Wilson CJ, Emson PC. Projection subtypes of rat neostriatal cells revealed by intracellular injection of biocytin. J Neurosci. 1990;10:3421–3438. doi: 10.1523/JNEUROSCI.10-10-03421.1990. [DOI] [PMC free article] [PubMed] [Google Scholar]
- 32.Killackey HP, Leshin S. The organization of specific thalamocortical projections to the posteromedial barrel subfield of the rat somatic sensory cortex. Brain Res. 1975;86:469–472. doi: 10.1016/0006-8993(75)90897-5. [DOI] [PubMed] [Google Scholar]
- 33.Kim U, Ebner FF. Barrels and septa: separate circuits in rat barrel field cortex. J Comp Neurol. 1999;408:489–505. [PubMed] [Google Scholar]
- 34.Kincaid AE, Wilson CJ. Corticostriatal innervation of the patch and matrix in the rat neostriatum. J Comp Neurol. 1996;374:578–592. doi: 10.1002/(SICI)1096-9861(19961028)374:4<578::AID-CNE7>3.0.CO;2-Z. [DOI] [PubMed] [Google Scholar]
- 35.Kincaid AE, Zheng T, Wilson CJ. Connectivity and convergence of single corticostriatal axons. J Neurosci. 1998;18:4722–4731. doi: 10.1523/JNEUROSCI.18-12-04722.1998. [DOI] [PMC free article] [PubMed] [Google Scholar]
- 36.Kunzle H. Projections from the primary somatosensory cortex to basal ganglia and thalamus in the monkey. Exp Brain Res. 1977;30:481–492. doi: 10.1007/BF00237639. [DOI] [PubMed] [Google Scholar]
- 37.Land PW, Simons DJ. Cytochrome oxidase staining in the rat SmI barrel cortex. J Comp Neurol. 1985a;238:225–235. doi: 10.1002/cne.902380209. [DOI] [PubMed] [Google Scholar]
- 38.Land PW, Simons DJ. Metabolic and structural correlates of the vibrissae representation in the thalamus of the adult rat. Neurosci Lett. 1985b;60:319–324. doi: 10.1016/0304-3940(85)90597-x. [DOI] [PubMed] [Google Scholar]
- 39.Land PW, Buffer SA, Jr, Yaskosky JD. Barreloids in adult rat thalamus: three-dimensional architecture and relationship to somatosensory cortical barrels. J Comp Neurol. 1995;355:573–588. doi: 10.1002/cne.903550407. [DOI] [PubMed] [Google Scholar]
- 40.Lu S, Lin CS. Thalamic afferents of the rat barrel cortex: A light- and electron-microscopic study using Phaseolus vulgaris leucoagglutinin as an anterograde tracer. Somatosens Mot Res. 1993;10:1–16. doi: 10.3109/08990229309028819. [DOI] [PubMed] [Google Scholar]
- 41.Malach R, Graybiel AM. Mosaic architecture of the somatic sensory-recipient sector of the cat's striatum. J Neurosci. 1986;6:3436–3458. doi: 10.1523/JNEUROSCI.06-12-03436.1986. [DOI] [PMC free article] [PubMed] [Google Scholar]
- 42.McCasland JS, Carvell GE, Simons DJ, Woolsey TA. Functional asymmetries in the rodent barrel cortex. Somatosens Mot Res. 1991;8:11–116. doi: 10.3109/08990229109144735. [DOI] [PubMed] [Google Scholar]
- 43.McGeorge AJ, Faull RLM. The organization of the projection from the cerebral cortex to the striatum in the rat. Neuroscience. 1989;29:503–537. doi: 10.1016/0306-4522(89)90128-0. [DOI] [PubMed] [Google Scholar]
- 44.Mittler T, Cho J, Peoples LL, West MO. Representation of the body in the lateral striatum of the freely moving rat: single neurons related to licking. Exp Brain Res. 1994;98:163–167. doi: 10.1007/BF00229122. [DOI] [PubMed] [Google Scholar]
- 45.Murthy VN, Fetz EE. Oscillatory activity in sensorimotor cortex of awake monkeys: synchronization of local field potentials and relation to behavior. J Neurophysiol. 1996a;76:3949–3967. doi: 10.1152/jn.1996.76.6.3949. [DOI] [PubMed] [Google Scholar]
- 46.Murthy VN, Fetz EE. Synchronization of neurons during local field potential oscillations in sensorimotor cortex of awake monkeys. J Neurophysiol. 1996b;76:3968–3982. doi: 10.1152/jn.1996.76.6.3968. [DOI] [PubMed] [Google Scholar]
- 47.Parthasarathy HB, Schall JD, Graybiel AM. Distributed but convergent ordering of corticostriatal projections: analysis of the frontal eye field and the supplementary eye field in the macaque monkey. J Neurosci. 1992;12:4468–4488. doi: 10.1523/JNEUROSCI.12-11-04468.1992. [DOI] [PMC free article] [PubMed] [Google Scholar]
- 48.Paxinos G, Watson C. The rat brain in stereotaxic coordinates. Academic; New York: 1986. [DOI] [PubMed] [Google Scholar]
- 49.Preston RJ, Bishop GA, Kitai ST. Medium spiny neuron projection from the rat striatum: an intracellular horseradish peroxidase study. Brain Res. 1980;183:253–263. doi: 10.1016/0006-8993(80)90462-x. [DOI] [PubMed] [Google Scholar]
- 50.Selemon LD, Goldman-Rakic PS. Longitudinal topography and interdigitation of corticostriatal projections in the rhesus monkey. J Neurosci. 1985;5:776–794. doi: 10.1523/JNEUROSCI.05-03-00776.1985. [DOI] [PMC free article] [PubMed] [Google Scholar]
- 51.Simons DJ. response properties of vibrissa units in rat SI somatosensory neocortex. J Neurophysiol. 1978;41:798–820. doi: 10.1152/jn.1978.41.3.798. [DOI] [PubMed] [Google Scholar]
- 52.Simons DJ. Neuronal integration in the somatosensory whisker/barrel cortex. In: Jones EG, Diamond IT, editors. Cerebral cortex: the barrel cortex of rodents, Vol 11. Plenum; New York: 1995. pp. 263–297. [Google Scholar]
- 53.Sugitani M, Yano J, Sugai T, Ooyama H. Somatotopic organization and columnar structure of the vibrissae representation in the rat ventrobasal complex. Exp Brain Res. 1990;81:346–351. doi: 10.1007/BF00228125. [DOI] [PubMed] [Google Scholar]
- 54.Takada M, Tokuno H, Nambu A, Inase M. Corticostriatal projections from the somatic motor areas of the frontal cortex in the macaque monkey: segregation versus overlap of input zones from the primary motor cortex, the supplementary moor area, and the premotor cortex. Exp Brain Res. 1998;120:114–128. doi: 10.1007/s002210050384. [DOI] [PubMed] [Google Scholar]
- 55.Updyke BV. Organization of visual corticostriatal projections in the cat, with observations on visual projections to claustrum and amygdala. J Comp Neurol. 1993;327:159–193. doi: 10.1002/cne.903270202. [DOI] [PubMed] [Google Scholar]
- 56.Van Hoesen GW, Yeterian EH, Lavizzo-Mourey R. Widespread corticostriate projections from temporal cortex of the rhesus monkey. J Comp Neurol. 1981;199:205–219. doi: 10.1002/cne.901990205. [DOI] [PubMed] [Google Scholar]
- 57.Welker C. Receptive fields of barrels in the somatosensory neocortex of the rat. J Comp Neurol. 1976;166:173–190. doi: 10.1002/cne.901660205. [DOI] [PubMed] [Google Scholar]
- 58.Welker WI. Analysis of sniffing of the albino rat. Behaviour. 1964;12:223–244. [Google Scholar]
- 59.Wilson CJ. The contribution of cortical neurons to the firing patterns of striatal spiny neurons. In: Houk JC, Davis JL, Beiser DG, editors. Models of information processing in the basal ganglia. MIT; Cambridge: 1995. pp. 29–50. [Google Scholar]
- 60.Wilson CJ, Chang HT, Kitai ST. Disfacilitation and long-lasting inhibition of neostriatal neurons in the rat. Exp Brain Res. 1983;51:227–235. doi: 10.1007/BF00237198. [DOI] [PubMed] [Google Scholar]
- 61.Wilson CJ, Groves PM. Fine structure and synaptic connections of the common spinyneuron of the rat neostriatum: a study employing intracellular injection of horseradish peroxidase. J Comp Neurol. 1980;194:599–615. doi: 10.1002/cne.901940308. [DOI] [PubMed] [Google Scholar]
- 62.Wineski LE. Facial morphology and vibrissal movement in the golden hamster. J Morphol. 1985;183:199–217. doi: 10.1002/jmor.1051830208. [DOI] [PubMed] [Google Scholar]
- 63.Wise SP, Jones EG. Cells of origin and terminal distribution of descending projections of the rat somatic sensory cortex. J Comp Neurol. 1977;175:129–158. doi: 10.1002/cne.901750202. [DOI] [PubMed] [Google Scholar]
- 64.Wong-Riley M. Changes in the visual system of monocularly sutured or enucleated cats demonstrable with cytochrome oxidase histochemistry. Brain Res. 1979;171:1–28. doi: 10.1016/0006-8993(79)90728-5. [DOI] [PubMed] [Google Scholar]
- 65.Woolsey TA, van der Loos H. The structural organization of layer IV in the somatosensory region, SI, of mouse cerebral cortex. Brain Res. 1970;17:205–242. doi: 10.1016/0006-8993(70)90079-x. [DOI] [PubMed] [Google Scholar]
- 66.Wright AK, Norrie L, Ingham CA, Hutton EAM, Arbuthnott GW. Double anterograde tracing of outputs from adjacent “barrel columns” of rat somatosensory cortex. Neostriatal projection patterns and terminal ultrastructure. Neuroscience. 1998;88:119–133. doi: 10.1016/s0306-4522(98)00186-9. [DOI] [PubMed] [Google Scholar]
- 67.Yeterian EH, Van Hoesen GW. Cortico-striate projections in the rhesus monkey: the organization of certain cortico-caudate connections. Brain Res. 1978;139:43–63. doi: 10.1016/0006-8993(78)90059-8. [DOI] [PubMed] [Google Scholar]