

Abstract
The generation of genetic diversity is a fundamental characteristic of HIV-1 replication, allowing the virus to successfully evade the immune response and antiviral therapies. Although mutations are the first step towards diversity, mixing of the mutations through the process of recombination increases the variation and allows for the faster establishment of advantageous strains within the viral population. Therefore, studying recombination of HIV-1 provides insights into not only the mechanisms of HIV-1 replication but also into the potential for spread of antiviral drug resistance mutations within and across viral subtypes. This chapter describes, in detail, a highly sensitive recombination assay designed to measure the frequency of recombination between two viruses. This assay allows us to investigate the requirements, mechanisms, and final products of recombination. Additionally, software-based phylogenetic tools are described in this chapter, which allow for the identification of specific recombination events within patient samples or viral progeny from the recombination assay.
Keywords: Recombination, flow cytometry analysis, HIV-1, immunostaining, template switching, phylogenetic analysis
1. Introduction
Recombination between two HIV-1 viruses promotes the assortment of mutations within the gene pool, thereby increasing the genetic diversity within the viral population. The resulting variation enhances the virus’s ability to adapt and evolve around selective pressures, such as the host immune system and antiviral drug interventions. Currently, many circulating recombinant forms of HIV-1 have been identified and these viral strains are an integral part of the HIV-1 pandemic. Therefore, it is important to analyze the ability of HIV-1 to recombine in both experimental systems and clinical settings in order to obtain a greater understanding of its recombination potential and the impact of these recombination events.
The recombination assay described in this chapter is based on the reconstitution of functional green fluorescence protein (GFP) through recombination between two viruses, both encoding for mutated, inactive gfp genes. In this system, one virus (HIV-H0) contains a reporter cassette in the Nef reading frame encoding the heat stable antigen gene (hsa), followed by an internal ribosomal entry site (IRES), and a gfp gene containing a nonsense mutation at its 5′ end. The other virus (HIV-T6) also contains a reporter cassette in Nef; this cassette includes a mouse thy 1.2 gene (thy), an IRES, and a gfp gene mutated at its 3′ end. Therefore, if recombination occurs between these two viruses, more specifically at a site between the two mutations in gfp, the resulting provirus could contain a functional gfp gene. As both of the parental viruses encode for a nonfunctional gfp, the recovery of a GFP signal can be used to score recombination events. In addition to gfp, the two parental viruses and the recombinants all contain another marker gene, hsa or thy; hence, the expression of HSA or Thy can be used to score all infection events. The number or cells that express HSA, Thy, or GFP can be measured using immunostaining and flow cytometry.
Using this recombination assay and by varying the distance between the two inactivating mutations in gfp we have demonstrated that HIV-1 recombines at a very high frequency (1). We have also used this system to compare the recombination rates of HIV-1 in various target cells (2). Additionally, we have measured the HIV-1 intersubtype recombination rates between subtype B and subtype C and found them to be ninefold lower than the intrasubtype recombination rates (3). We further determined that a 3-nucleotide difference within the dimer initiation site of the stem loop 1 was responsible for the low recombination rate observed between these two subtypes.
As recombination has been shown to occur in experimental systems at high frequencies, it is important to evaluate its impact in clinical settings within HIV-1-infected patients. Additionally, phylogenetic analyses of various HIV-1 strains are complicated by the presence of recombinant sequences; therefore identification of such sequences is a critical part of evolutionary studies into HIV-1. Identification of recombinants involves the detailed examination of the viral sequences using computer software. The software highlighted in this chapter uses representative examples of each viral subtype to which a sample sequence is compared. Then statistical methods are employed to calculate the phylogeny and parental makeup of the potential recombinant. These techniques can also be used to identify specific recombination events within the in vitro system outlined above, providing a more detailed picture of the reverse transcriptase template switching pattern and the identification of recombination hotspots.
2. Materials
2.1. Viral Production
293T cells.
Complete medium for 293T cells (293T-CM), consisting of Dulbecco’s Modified Eagle’s Medium (DMEM) (Mediatech, Inc.), 10% fetal calf serum (FCS, HyClone), 1% penicillin/streptomycin (P/S) (Gibco).
Trypsin (0.25%) and ethylenediamine tetraacetic acid (EDTA) (1 mM) (Gibco).
Transfection agent for mammalian cells. For this purpose 25 kDa poly(ethyleneimine) (PEI, Sigma) is used but can be substituted at all stages by other agents, most commonly the calcium phosphate method (Promega).
Plasmids HIV-H0 and HIV-T6 (Fig. 7.1) or derivatives thereof that are being studied.
Plasmid pHCMV-G, encoding the vesicular stomatitis virus glycoprotein (VSV-G) from the CMV promoter (4).
Syringe filters (0.45 μm pore size).
Fig. 7.1.

Schematic representation of the viral genomes used in the recombination assay. The two viruses used in this study are depicted. Both are based on pNL4.3 sequence but with inactivating deletions in vif, vpu, vpr and env. Within the nef reading frame a double marker gene cassette has been inserted using an IRES to express the downstream gene. HIV-H0 encodes hsa and a gfp with an inactivating mutation near its 5′ end. HIV-T6 encodes thy and a gfp with an inactivating mutation near its 3′ end.
2.2. Dual Infected Cell Line Production
Polybrene.
Phosphate-buffered saline (PBS) supplemented with 2.5% FCS (PBS+FCS).
R-phycoerythrin (R-PE) conjugated rat anti-mouse CD24 (heat stable antigen, HSA) antibody (PE-α-HSA, BD Pharmingen).
Allophycocyanin (APC) conjugated anti-mouse CD90.2 (Thy1.2) antibody (APC-α-Thy, eBioscience).
1% paraformaldehyde in PBS.
Fluorescence-activated cell sorting apparatus with 488 and 635 nm excitation lasers and at least three channels for detection of GFP (520 nm emission), PE (590 nm emission) and APC (675 nm emission), e.g., FACSCantage SE system with the FACSDiVa digital option (BD Biosciences).
2.3. Assay of Virus Released by the Cell Lines
Plasmid pIIINL(AD8)env encoding the CCR5 tropic HIV-1 envelope gene (5).
Hut/CCR5 cell line, derived from Hut78 cells modified to constitutively express the CCR5 co-receptor.
Complete media for Hut/CCR5 cells (Hut-CM) consisting of Roswell Park Memorial Institute-1640 (RPMI, Mediatech, Inc.), 10% FCS, 1% P/S, 1% glutamine, 500 μg/mL Gentamicin and 1 μg/mL Puromycin.
Flow cytometry apparatus with 488 nm and 635 nm excitation lasers and at least three channels (520, 590 and 675 nm), e.g., FACSCalibur (BD Biosciences) or CyFlow® ML (Partec).
2.4. Calculation of Virus Recombination
FlowJo FACS analysis software or equivalent.
2.5. Software Analysis of HIV-1 Recombination
Recombination identification program (RIP) (at http://www.hiv.lanl.gov/content/sequence/RIP/RIP.html).
SimPlot (from http://sray.med.som.jhmi.edu/SCRoftware/simplot/).
3. Methods
3.1. The Recombination Assay
The recombination assay involves the establishment of a dualinfected virus producer cell line and the subsequent phenotypic analysis of its viral progeny through target cell infection (Fig. 7.2). The accuracy of this assay relies on generating cells containing two proviruses, one from each virus under study, resulting in similar expression of the two viral genomic RNAs. This is achieved by infecting the cells with the two viruses separately, each at low multiplicities of infection (MOI), thereby reducing the probability of a cell containing multiple copies of a provirus derived from the same virus. Although generating a cell line is more time-consuming than cotransfection of two plasmids, viral production from cell lines yields far more accurate and consistent data than those from cotransfection. There are at least two issues associated with generating viruses used for recombination studies via cotransfection: first, DNA recombination between the two plasmids encoding the viral genome under study can occur, which generates unnecessary background signal. Secondly, during transient transfection, one cannot control the distributions of the two plasmids in the producer cells, which introduces inaccuracy and variations in the results. The confidence in the results obtained with the dual-infected cell lines relies on infecting cells at low MOIs and collecting a large pool of independently infected cells, each containing two proviruses but integrated into different regions of the genome. Thus the result obtained from a single cell line is actually an average of multiple viruses from many different cells. Additionally, we generally prefer to generate at least two cell lines for each viral pairing and analyze more than one viral harvest from each cell line to create even greater confidence in the measurement.
Fig. 7.2.

Cell sorting schedule for production of dual infected cell lines. The cell lines used to analyze the recombination potential between two viruses were produced by two successive rounds of infection at low MOIs, each infection followed by a cell sorting event. A final cell sort for double positive cells results in more than 95% of cells being double positive. These cells are then transfected with an envelope encoding plasmid and the resulting virus is harvested and used to infect Hut/CCR5 cells. Flow cytometry is performed on the infected target cells and the data obtained are used to calculate the frequency with which GFP is reconstituted by the two parental viruses through recombination. Also shown are representative flow cytometry data for the cells at each stage of the procedure.
3.1.1. Viral Production
The 293T cells are plated at 4 × 10⁶ cells per 100-mm-diameter tissue culture dish in 10 mL of 293T-CM.
Twenty-four hours later, the cells are transfected with 10 of a plasmid encoding the viral vector (based on HIV-H0 or HIV-T6) and 4 μg of a plasmid encoding the VSV-G protein (pHCMV-G). Transfection can be accomplished by a variety of methods including calcium phosphate or PEI (see Note 1). Both techniques require an incubation of the cells in serumfree media containing the transfection mixture for 4 h, after which the transfection mixture is replaced with 10 mL of fresh 293-CM. Cells are then incubated at 37 °C in 5% CO2 for 48 h for optimal virus production.
Virus is released from transfected cells into the supernatant, which is harvested using a 10 mL syringe and passed through a 0.45-μm filter to remove cellular debris. Viral supernatants are then ready to use or are frozen and stored at −70 °C.
3.1.2. Dual Infected Cell Line Production
Low passage 293T cells are seeded at 1 × 10⁶ cells per 100-mm-diameter tissue culture dish in 10 mL of 293T-CM. (see Note 2).
Twenty-four hours later the medium is replaced with 2 mL of transduction medium. Transduction medium consists of between 5 × 10⁴ and 1 × 10⁵ transducing units of HAS-encoding virus (equal to an MOI of between 0.05 and 0.1) generated in Section 3.1.1, diluted in 293T-CM and supplemented with 50 μg/mL polybrene (see Note 3).
The cells are incubated with the transduction medium for 2h, which is then removed and replaced with 10mL of fresh 293T-CM
When the transduced cells reach confluency (about 72 h postinfection), the cells are trypsinized (remove medium, add 1 Ml trypsin/EDTA, incubate for I min, remove trypsin and pipette the cells off the plate using 10mL of 293T-CM) and divided into five 100-mm-duaneter tissue culture dishes.
When nearing confluency again (another 48–72 h) the cells are re-trypsinized and the resulting single cell suspension is stained for the presence of the HAS marker gene.
The cells are pelleted by centrifugation at 300 × g for 3 min in a 15-mL falcon tube and resuspended in 10 mL of cold (4 °C) PBS+FCS (1× wash).
The cells are washed again and resuspended at 1 × 10⁷ cells/mL in staining solution. Staining solution consists of PBS+FCS supplemented with 0.2 μg/mL of PE-conjugated anti-HSA antibody (see Note 4).
Cells are incubated on ice for 1h to allow binding of the antibody to the cell surface marker HSA.
Once stained, the cells are washed twice in PBS+FCS to remove excess antibody and finally resuspended at 1 × 10⁷ cells/mL in cold PBS+FCS ready for cell sorting.
For sorting, the cells are gated for live cells first, then sorted based on HSA expression by gating on PE-positive cells.
Successfully sorted cells (about 1 × 10⁶ cells), collected from the machine in 10 mL of 293T-CM, are pelleted and resuspended in fresh 293T-CM and plated into a 100-mm-diameter tissue culture dish (see Note 5).
Once the cells near confluency they are expanded. When sufficient cells have been produced they are re-plated into a 100-mm-diameter tissue culture dish at 1 × 10⁶ cells in 10 mL of 293T-CM.
The cells are then infected for the second time (repeat Sections 1–6) using the thy encoding virus at an estimated MOI of 0.05–0.1 (i.e., infection will result in 5–10% of cells positive for Thy).
For immunostaining of the dual infected cells, cells are washed once with PBS+FCS as described in step 6 and resuspended at 1 × 10⁷ cells/mL in PBS+FCS containing 0.2 μg/mL PE-α-HSA and 2 μg/mL APC-α-Thy antibodies (see Note 6).
The cells are stained on ice for 1 h followed by two washes in 10 mL PBS+FCS and resuspension in PBS+FCS at 1 × 10⁷ cells/mL.
The cells are sorted a second time but this time the live cells are gated for HSA+, Thy+, GFP− (see Note 7).
Again the cells (about 1 × 10⁶) are collected from the cell sorter in 10 mL of 293-CM, pelleted at 300 × g, resuspended in 10 mL fresh 293T-CM and plated in a 100-mm-diameter tissue culture dish. Once near confluency the dual infected cells are split into four 100-mm-diameter tissue culture dishes.
Forty-eight hours later, one plate of cells is frozen as a backup, the others are harvested as before (steps 5 + 6) and readied for a second round of HSA+, Thy+, GFP− sorting (repeat steps 14–17).
The cells are then expanded and a sample can be stained, as before, for the two marker genes. The dual infected cell line at this stage should be more than 95% double positive, if not it can be resorted a third time. A sample of the resulting cell line should be frozen for backup and the rest used promptly (minimum number of passages) to evaluate the recombination frequency between the two viruses under study.
3.1.3. Assay of Virus Released by the Producer Cell Lines
The newly created dually infected virus producer cell line is plated at 4 × 10⁶ cells per 100-mm-diameter tissue culture dish in 10 mL 293T-CM.
Twenty-four hours later the cells are transfected with 4 μg of pIII(AD8)env, a plasmid encoding for the HIV-1 CCR5 tropic envelope glycoprotein (see Note 8).
Forty-eight hours post-transfection the cell supernatant, containing the released virus, is harvested with a 10-mL syringe, clarified through a 0.45-μm filter, and used to transduce the target cell line Hut/CCR5.
The Hut/CCR5 cells are plated at 1 × 10⁶ cells per well of a six-well plate in 1 mL of Hut-CM, to which 1 mL of virus is added (see Note 9 and 10).
After four hours incubation at 37 °C the cells are harvested from the six-well plate, pelleted by centrifugation at 300 × g for 3min, resuspended in 10 mL Hut-CM and seeded into a 25-cm2 tissue culture flask.
Seventy-two hours post-transduction the Hut/CCR5 cells are recovered by centrifugation at 300 × g for 3min and resuspended in 10 mL of cold PBS + FCS.
The cells are then re-pelleted at 300 × g for 3min, and resuspended in cold PBS + FCS supplemented with antibodies against HSA and Thy, as before, and are incubated on ice for 1 h.
The immunostained cells are washed twice with PBS + FCS, as described in Section 3.1.2 step 6, resuspended in 1 mL of PBS supplemented with 1% paraformaldehyde fixative (fixative is optional), and incubated on ice for 20min prior to analysis.
The cells are then analyzed by flow cytometry for the presence of PE (HSA+), APC (Thy+) and GFP. The cells are gated for live cells and correct compensation between PE and GFP is performed (Fig. 7.3) (see Note 11). To ensure accurate results are obtained, at least 1000 GFP positive cells or 1 × 10⁶ live cells should be scored for each infection.
Fig. 7.3.

Effects of compensation on the flow cytometry data. Due to the bleed-through of fluorescence between the PE (HSA) and GFP signals, compensation is required. A representative Hut/CCR5 infection shows the effect of compensation on the data, allowing accurate gating of the positive cells.
3.1.4. Calculation of Virus Recombination
The flow cytometry results are then analyzed using a software package, such as FlowJo.
The flow cytometry machine data file is first opened and the live cell population gated.
The cells are then divided up as either GFP+ or GFP− by gating on the GFP histogram plot. These subpopulations are then displayed separately as a dotplot of PE (HAS+) on the x-axis and APC (Thy+) on the y-axis. A quadrant gate is used to subdivide the GFP+/− populations according to HSA+/Thy−, HSA+/Thy+, HSA−/Thy+ and HSA−/Thy− (Fig. 7.4). The results of each subdivision in actual cell numbers are then used to calculate the MOI of each viral phenotype.
-
The total MOI is calculated by the formula below:
Where ϒ represents the number of total live cells analyzed and Zi the number of infected cells (i.e., the total number of cells positive for any of the three markers: HSA, Thy or GFP).
-
The MOI of GFP is calculated by a similar formula:
Where ϒ represents the number of total live cells analyzed and Zg the number of GFP positive cells detected.
- Finally, the recombination rate between the two viruses is calculated using the formula below with the previously estimated MOI results (Table 7.1):
Fig. 7.4.

Software analysis of flow cytometry data to obtain the recombination rate. In order to calculate the recombination rate the number of cells positive for each marker gene is required. To achieve this, the live cells are first gated upon and plotted as a histogram of GFP signal. The live cells are then divided into positive and negative according to their GFP signal. The subdivided cells are then plotted on a dot plot of HSA and Thy expression, and gated accordingly.
Table 7.1.
Calculation of the Recombination Rate. The number of live cells, GFP, HSA and Thy positive cells are all used to produce a final result for the recombination rate between two viruses. GFP MOI and Infection MOI are calculated as described in Section 3.1.4. Recombination rate is calculated as GFP MOI/Infection MOI × 100%
| No. of infected cells | ||||||
|---|---|---|---|---|---|---|
| No. live cells |
No. GFP+ cells |
(HSA+, Thy+, or GFP+) |
GFP MOI |
Infection MOI |
Recomb. rate |
|
| Virus infection | 1,648,452 | 30,406 | 373,215 | 0.0186 | 0.2567 | 7.25% |
3.2. Software Analysis of HIV-1 Recombination
To identify an HIV-1 recombinant, the virus sequence is first analyzed using the RIP; if recombination is detected it can be confirmed and further analyzed using a bootscanning program called SimPlot. RIP is a web-based program accessible through the HIV Sequence Database at the Los Alamos National Laboratory (6), which provides likely parental sequences for a query sequence. SimPlot is a freeware program available for download at the author’s homepage (7), and allows for detailed statistical comparisons between the query sequence and the parental sequences.
The RIP uses a nucleotide window of defined size to scan over a sequence alignment containing the query sequence and several background representatives. The relationship between the sequences is calculated according to similarity, Hamming, and Juke-Cantor distance measurements. The window is then advanced one nucleotide (step) and the same calculations are repeated until the end of the query sequence is reached and the likely parental sequences are identified.
The SimPlot program again scans over a sequence alignment with a defined nucleotide window size and step size. For each window, the alignment is subjected to a phylogenetic analysis and a bootstrapped phylogenetic tree is built (8). Bootstrapping is a statistical method to test the reliability of a phylogenetic analysis by resampling the alignment many times (default in SimPlot is set at 100). The result of the resampling is a bootstrap value, which is the percentage of times the query sequence is placed together with each of the reference sequences within an internal branch of the constructed phylogenetic tree. The bootstrap values of each window are plotted along the query sequence after the scan; the bootstrap values can be used to identify from which parental sequence each window of the query originated. Recombination breakpoints within the query sequence are detected as the point at which an increase is observed in bootstrap values for the query to one parent along with a simultaneous decrease in bootstrap values to a different parent.
3.2.1. RIP
Prepare the query sequence in Fasta/Pearson format and upload the sequence as a file or paste it from the clipboard.
Choose one of the options to define the background alignment (see Note 12).
Select a window size and a significance threshold (see Note 13).
Choose one of the options for handling nucleotide gaps within the sequence alignment (see Note 14).
If multistate character code is present in the sequence, select “True” to count the characters as a partial match or “False” to count the characters as mismatches (see Note 15).
With all the parameters defined, press “Run” to analyze the query sequence.
The results are presented in three graphs each presenting a different distance measurement (similarity, Hamming, and Juke- Cantor) between the query and the background sequences (see Note 16).
Press “Rerun” to re-analyze the query using only the best match sequence if necessary (Fig. 7.5) (see Note 17).
If the output of the RIP suggests the query is a recombinant, it is necessary to confirm the analysis using the SimPlot program ( see Note 18).
Fig. 7.5.
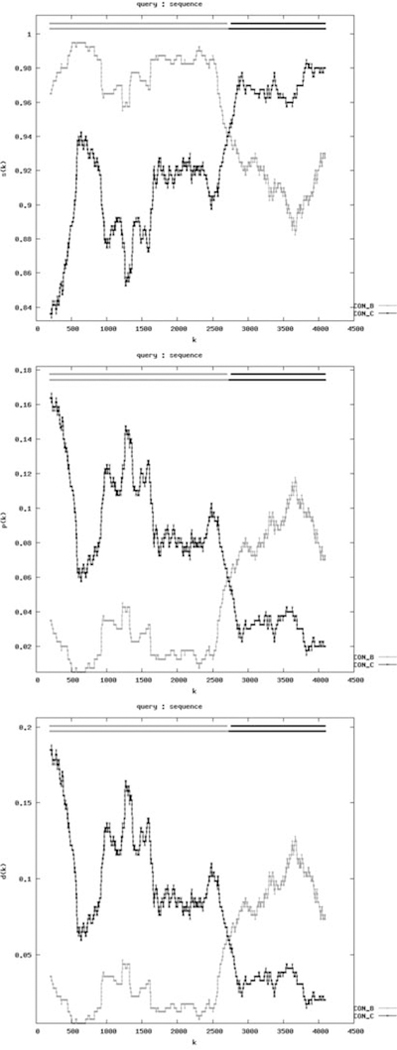
RIP analysis of an HIV-1 recombinant. A 4.2-kb sequence of HIV-1 gag and pol is subjected to RIP analysis. Plots show the similarity, Hamming, and Juke-Cantor distances (from top to bottom) between the query and the reference sequences after “Rerun”. The distance values are shown on the y-axis and the position along the query sequence is shown on the x-axis. Potential parents will have the highest similarity distance but lowest Hamming and Juke-Cantor distances. The first 2.7 kb of the query sequence most closely resembles the consensus sequence of subtype B HIV-1 (gray) whereas the rest of the query sequence more closely resembles the subtype C HIV-1 consensus sequence (black).
3.2.2. SimPlot
Align the query sequence with reference sequences of your choice (see Note 19).
In the SimPlot program, use the “File” menu and open the aligned sequence file.
The sequences are now assigned into different groups under the “SeqPage” tab, reassign the groups if necessary and select those intended for comparison (see Note 20).
Select the “BootScan” tab and select the query sequence under the “Commands” menu.
Change the window size and step size by selecting the relevant settings at the bottom of the window if needed (see Note 21).
Start bootscanning by selecting “Do BootScan” under the “Command” menu.
The percentages of permuted trees (bootstrap value) of the scanning windows are plotted after the bootscanning is complete (Fig. 7.6). Zoom in on a plot area by selecting and enclosing the area of interest. Pan around the plot by dragging with the right mouse button and zoom out by dragging up to the left.
Reference sequences that are placed together with the query sequence in a high percentage of permuted trees are the potential parents. Repeat the analysis with the potential parental sequences until all the irrelevant reference sequences are omitted (see Note 22).
Fig. 7.6.

SimPlot analysis to confirm recombination within a query sequence. The same 4.2 kb sequence of HIV-1 gag and pol is subjected to SimPlot analysis. The percentage of permuted trees is shown on the y-axis and the position along the query sequence is shown on the x-axis. SimPlot analysis indicates that the query is a recombinant of subtype B (dark gray) and subtype C (black) HIV-1. The recombination breakpoint is located approximately 2.7 kb along the recombinant sequence. HIV-1 subtype A1 (light gray) is used as background in this analysis.
4. Notes
The transfection agent PEI provides efficient, consistent transfection of 293T cells. The 25-kDa branched PEI is diluted to 10 mM in water (stock, store in dark at 4 °C) then further diluted to 10 μM in DMEM prior to use (make fresh on day of transfection). Plasmid DNA is diluted in 2.5 mL DMEM and added drop wise, with constant vortex agitation, to 2.5 mL DMEM containing 100 μL of 10 μM PEI. The PEI-DNA complex is allowed to form at room temperature for 20 min before being added to the 4 × 10⁶ 293T cells seeded into a 100-mm-diameter tissue culture dish the previous day. After 4h incubation at 37 °C, the transfection mix is removed and replaced with fresh 293T-CM.
The transfection efficiency of 293T cells decreases with age, particularly at over passage 40–50. As production of the dual infected cell lines can take about 20 passages and transfection of the envelope plasmid is required to obtain infectious virus from the cell lines, it is essential to start with very early passage 293T cells (preferably less than passage 10).
In order to estimate the correct amount of virus required to obtain a 5–10% infection rate it is important to perform a “dry-run” infection for each virus harvest. Moreover, when generating a cell line, multiple groups of cells should be infected, each with a varied virus dilution, so that at least one group meets the required infection rate of around 5–10%. To test each group for the level of infection, the medium is removed 48 h postinfection and a small area of cells (about 1 cm2) is harvested with a pipette using the residual medium on the plate (about 500 μL). These cells are then immunostained and analyzed by flow cytometry; the cells with the correct level of infection progress to the next stage of dual infected cell line production.
The antibodies used to stain HSA and Thy markers are flurescently labeled, and as such are photosensitive. It is therefore important to limit their exposure to light during the immunostaining procedure. All manipulations of the antibodies should be performed with the tissue culture cabinet overhead light switched off and the incubation on ice should be performed in the dark (i.e., covered by aluminum foil).
After each cell sort only around 1 × 10⁶ cells are recovered. However, there is a degree of cell death associated with cell sorting and the surviving cells adhere to the tissue culture plates slowly and exhibit a delay in cell division. This results in extended cell expansion periods of about 2 weeks between each cell sorting event in order to produce enough cells to progress to the next step. It is possible to reduce the lag time between sorts to about 8 days by plating the sorted cells in conditioned medium. Conditioned medium is 293T-CM that has previously been used to culture 293T cells; it requires clarification through a 0.45-μm filter prior to use and should only be used for the first two days post-sorting, after which fresh 293T-CM should be sufficient for normal cell growth.
To ensure efficient staining has been achieved it is useful to transduce a sample of cells with the functional GFP version of the two viruses. After staining, almost all of these cells should be double positive for the marker gene and GFP.
During the production of the cells lines, functional gfp can arise through cellular mitotic DNA recombination of the proviruses. This is a rare event, but these cells are removed during sorting of the dual infected cell lines by gating on the GFP− population.
To improve viral titers and to achieve higher levels of target cell transduction, alternative transfection agents that demonstrate greater transfection efficiency with low levels of DNA can be used (e.g., FuGene6). Alternatively, transfection efficiency with PEI can be increased by supplementing the 4 μg of HIV-1 envelope plasmid with 10 μg of filler DNA (e.g., salmon sperm DNA).
If the level of target cell infection is too low and insufficient GFP+ cells are detected for accurate quantification of the recombination rate, then improvements in the infection efficiency can be made by modifying the infection procedure. A spinoculation procedure can be used (centrifugation at 1200 × g for 45 min at 15 °C), and 10 μg/mL polybrene can be added during the transduction. If polybrene is used, it must be removed 4 h postinfection due to cytotoxic effects on Hut/CCR5 cells.
The calculation of recombination rates uses the MOIs of each virus and not the percentages of infections. MOI calculation is based on the Poisson distribution, thus multiple infections are taken into consideration. However, the accuracy of the MOI calculation is compromised when the infection level is too high and the system is saturated or too low and insufficient numbers of cells are scored. We generally limit our total transduction level to < 50%.
For flow cytometry of the three different colors (PE, Thy and GFP) it is important that any cross-talk between the fluorescent channels is accounted for by using compensation. This is most evident between the GFP and PE signals, both of which demonstrate a small amount of fluorescent bleed- through (about 1% of PE into the GFP channel and 31% of GFP into the PE channel, depending on the filter sets used). Using the FACScalibur machine such compensation must be performed prior to analyzing the samples using control cells only fluorescing in one channel. Alternatively, the PARTEC machine uses software based compensation that can be performed after acquisition of the data.
The default background alignment consists of a comparison to near full length consensus sequences of subtypes A1, B, C, D, F1, F2, G, H and CRF01_AE, and one sequence each from subtypes A2, J and K. It is not necessary to omit any reference sequences from the analysis at this point. A “Rerun” function in the output will perform a re-analysis of the data with only the most relevant reference sequences included.
Larger window sizes result in a smoother output but will reduce the likelihood of observing small recombinant segments. Smaller window sizes give better resolution but generate a more noisy output. A z-test is applied to the calculation of distances with confidence levels at 90%, 95% or 99%. The default window size of 400 nucleotides and significance threshold of 90% is a good starting point for detecting most of the recombination breakpoints.
The user can choose to analyse the sequence with nucleotide gaps present in the alignment or to remove (strip) them. Removing the gaps may result in the loss of some informative nucleotides, thus for the initial analysis, it is best to run the program with the gaps present.
Multistate character code may be present in the query or reference sequences, select “True” to perform a more accurate comparison.
Reference sequences of different subtypes are shown in different colors on the graph and each data point represents the distance value of each window analyzed. The lower colored bar of the two horizontal bars near the top of the graph represents the background sequence with the highest similarity to the query (the best match). Above it is another colored bar which shows whether the best match is significantly better than the second best match using the significance threshold selected in Section 3.2.1 Step 3. Following the graphs is an alignment of the query sequence to the background sequence. It is very important to check the quality of the alignment to ensure the program has been accurate.
If the default consensus sequences are used it will be apparent that only a few subtypes in the background are closely related to the query. By performing the “Rerun” option, the RIP automatically runs the analysis using only the best match sequences, making the results easier to read.
If recombination is not detected, try a smaller window but keep the threshold at 90%.
The program requires a minimum of four sequences in the alignment for each analysis; two or more potential parental sequences, one outgroup sequence for comparison and the query sequence. The outgroup sequence can be selected from the HIV-1 subtypes identified by the RIP to have low similarity to the query. To repeat the RIP analysis using SimPlot, the earlier alignment performed by the RIP can be downloaded and used as its input alignment. SimPlot version 3.5.1 will accept most sequence formats, such as MSF, Clustal, Fasta/Pearson, PHYLIP and NEXUS.
Each group should contain sequences of the same subtype. The SimPlot default setting uses the first character of the sequence name to assign groups. If the program is not assigning groups correctly, change the setting using the “Use first character to identify groups” button on the right to correct it.
The default window size of 200 nucleotides and step size of 20 is a good starting point for bootscanning. The default distance model and tree model for the phylogenetic analysis are Kimura-2-parameter and Neighbor-Joining, respectively, which are fast and quite accurate. There are other models to choose from using “Preferences” within the “Options” menu.
When the parental sequences are determined, repeat the analysis but reduce the window size and step size. Again, larger window sizes will overlook recombination breakpoints that are close together whereas smaller window sizes generate noisy results. Smaller step sizes result in a more detailed plot by adding more data points, which helps to pinpoint the exact recombination breakpoints.
Acknowledgments
We thank Dr. Jianbo Chen for reading of this chapter; Drs. Vinay K. Pathak, Jianbo Chen, and Olga Nikolaitchik for intellectual input and discussions.
References
- 1.Rhodes TD, Nikolaitchik O, Chen J, et al. (2005) Genetic recombination of human immunodeficiency virus type 1 in one round of viral replication: effects of genetic distance, target cells, accessory genes, and lack of high negative interference in crossover events. J Virol 79, 1666–1677. [DOI] [PMC free article] [PubMed] [Google Scholar]
- 2.Chen J, Rhodes TD, and Hu WS (2005) Comparison of the genetic recombination rates of human immunodeficiency virus type 1 in macrophages and T cells. J. Virol 79, 9337–9340. [DOI] [PMC free article] [PubMed] [Google Scholar]
- 3.Chin MP, Rhodes TD, Chen J, et al. (2005) Identification of a major restriction in HIV-1 intersubtype recombination. Proc Natl Acad Sci USA 102, 9002–9007. [DOI] [PMC free article] [PubMed] [Google Scholar]
- 4.Yee JK, Friedmann T, Burns JC (1994) Generation of high-titer pseudotyped retroviral vectors with very broad host range. Meth Cell Biol 43 (Pt A), 99–112. [DOI] [PubMed] [Google Scholar]
- 5.Dang Q, Chen J, Unutmaz D, et al. (2004) Nonrandom HIV-1 infection and double infection via direct and cell-mediated pathways. Proc Natl Acad Sci USA 101, 632–637. [DOI] [PMC free article] [PubMed] [Google Scholar]
- 6.Siepel AC, Halpern AL, Macken C, et al. (1995) A computer program designed to screen rapidly for HIV type 1 intersubtype recombinant sequences. AIDS Res Hum Retroviruses 11, 1413–1416. [DOI] [PubMed] [Google Scholar]
- 7.Lole KS, Bollinger RC, Paranjape RS, et al. (1999) Full-length human immunodeficiency virus type 1 genomes from subtype C-infected seroconverters in India, with evidence of intersubtype recombination. J Virol 73, 152–160. [DOI] [PMC free article] [PubMed] [Google Scholar]
- 8.Salminen MO, Carr JK, Burke DS, et al. (1995) Identification of breakpoints in intergenotypic recombinants of HIV type 1 by bootscanning. AIDS Res Hum Retroviruses 1423–1425. [DOI] [PubMed] [Google Scholar]