Abstract
Purpose:
Most surveillance efforts in childhood diabetes have focused on incidence, whereas prevalence is rarely reported. This study aimed to assess whether a mathematical illness-death model accurately estimated future prevalence from baseline prevalence and incidence rates in children.
Methods:
SEARCH for Diabetes in Youth is an ongoing population-based surveillance study of prevalence and incidence of diabetes and its complications among youth in the United States. We used age-, sex-, and race/ethnicity-specific SEARCH estimates of the prevalence of type I and type II diabetes in 2001 and incidence from 2002 to 2008. These data were used in a partial differential equation to estimate prevalence in 2009 with 95% bootstrap confidence intervals. Model-based prevalence was compared with the observed prevalence in 2009.
Results:
Most confidence intervals for the difference between estimated and observed prevalence included zero, indicating no evidence for a difference between the two methods. The width of confidence intervals indicated high precision for the estimated prevalence when considering all races/ethnicities. In strata with few cases, precision was reduced.
Conclusions:
Future prevalence of type I and type II diabetes in youth may be accurately estimated from baseline prevalence and incidence. Diabetes surveillance could benefit from potential cost savings of this method.
Keywords: Adolescents, Children, Epidemiology, Ethnic groups, Illness-death model, Surveillance, Type I diabetes, Type II diabetes
Introduction
Although diabetes mellitus is one of the most common chronic diseases of childhood, the absolute prevalence is small, making it difficult to estimate prevalence [1]. The most common form of youth-onset diabetes is type I diabetes, which results from an autoimmune attack of the insulin-producing beta cells of the pancreas. At the end of the 20th century, type II diabetes, the most common form of diabetes in adults, emerged as a pediatric health concern [2]. This phenomenon may be linked to the increase in obesity prevalence among adolescents [3], as obesity is a major risk factor for type II diabetes [4].
In the United States, in youth aged younger than 20 years, the prevalence and incidence of both type I and type II diabetes are increasing [5,6]. Public health surveillance of type I and type II diabetes at the population level is important for identifying risk factors and planning for future health care delivery as well as determining the population effect of prevention efforts. With the rising prevalence of type II diabetes in children and adolescents, surveillance efforts have begun to include both forms of diabetes. In the United States, the population-based registry of the SEARCH for Diabetes in Youth study is fulfilling this need [7]. Yet, registries are costly, time consuming, and place a substantial burden on health care systems and public health agencies. There is, therefore, continuous need for improving efficiency and timeliness of surveillance efforts.
One potential approach for reducing costs and work load in childhood diabetes surveillance could consist of using annual incidence rates of childhood diabetes to predict prevalence at one point in time. Most of the surveillance systems for diabetes with onset in childhood have focused on incidence, and prevalence is rarely reported. Assessing incidence and following cohorts of newly diagnosed cases over time are important for understanding the disease etiology and natural history. However, knowing the prevalence may be more important for assessing health care needs and planning health care resources. Thus, predicting prevalence using incidence data seems appropriate for maximizing the use of resources in public health surveillance.
The aim of this project was to test the validity of theoretical relationships between incidence and prevalence estimates and the practical applicability of using incidence data to estimate prevalence in a real-world setting. If the theoretical relationships are practical, they may help reduce the efforts and endeavors that are necessary for public health surveillance of diabetes in youth. Specifically, the present study used the SEARCH study incidence and prevalence data to determine whether mathematical models developed by Brinks and Landwehr [8] can be used to predict future age-, sex-, race/ethnicity-, and type-specific prevalence from the observed SEARCH baseline prevalence and incidence data.
Methods
Data sources
The data for this study came from the SEARCH for Diabetes in Youth study. SEARCH is an ongoing multicenter study that starting in 2001 has been conducting population-based ascertainment of clinically diagnosed, non-gestational diabetes cases among youth aged less than 20 years in the United States. A detailed description of the SEARCH study has been published elsewhere [7,9]. In brief, prevalent and incident cases were ascertained in five centers across the U.S. Diabetes cases were identified using networks of endocrinologists (pediatric and adult), as well as other health care providers, hospitals, community health centers, clinical and administrative data systems, and electronic medical records. Diagnosis of diabetes was validated through review of medical records or by a physician referring the case to SEARCH. Case ascertainment was considered greater than 90% complete for the population under surveillance. Data included prevalent diabetes cases in 2001 and 2009 with corresponding denominators [5], and incident cases from 2002 to 2008 with corresponding denominators [6], collected from geographically defined populations in Ohio, Colorado, South Carolina, and Washington, Indian Health Service beneficiaries from selected American Indian populations, and enrollees in a managed health care plan in California. Institutional review board(s) for each site approved the study protocol.
Statistical analysis
Prevalence
SEARCH assessed the prevalence of type I and type II diabetes in 2001 and 2009. Methods for this assessment have been described in detail [5]. In brief, for prevalence estimates the numerator consisted of all diabetes cases prevalent in 2001 or 2009 who were aged younger than 20 years on December 31, 2001 or 2009, resident of the SEARCH geographic sites, Indian Health Service beneficiaries, or enrollees in the study’s California health plan. Active duty military and institutionalized individuals were not eligible. Race–ethnicity was based on self-report or medical records for 94.9% and 97.3% of the participants, respectively in 2001 and 2009, and on imputation via geocoding for youth who had missing data (4.1% in 2001 and 2.3% in 2009).
Denominators included youth aged younger than 20 years who were residents of the geographic study areas, Indian Health Service beneficiaries, or members of the health plan in 2001 or 2009, pooled across all sites. For this study, both numerator and denominator were grouped in four racial/ethnic groups: Hispanic, non-Hispanic white (NHW), non-Hispanic black (NHB), and non-Hispanic other (other).
Demographic information, date of diagnosis, and diabetes type were obtained from medical records. Type I and type II diabetes prevalence estimates in 2001 and 2009 were generated as a function of age (0,1, … 19 years) in 2001/2009, sex, and race/ethnicity. Prevalence was expressed as cases per 1000 youth pooled across all sites with 95% confidence intervals.
Incidence
SEARCH assessed the incidence of type I and type II diabetes yearly from 2002 onward. From 2002 to 2008, SEARCH identified 6995 incident cases of type I diabetes and 1655 incident cases of type II diabetes. Methods for diabetes incidence assessment have been previously described [6]. In brief, incident diabetes cases who were aged less than 20 years on December 31 of the index year (i.e., the year an incident case entered SEARCH) were included. Race/ethnicity for cases was based on self-report (81%), medical records (16%), or geocoding (3%). The annual denominators included youth aged younger than 20 years on December 31 of the index year who were civilian residents of the geographic study areas, Indian Health Service beneficiaries of participating American Indian tribes, or members of the study health plan.
Incidence rates were expressed per 100,000 youth per year using data pooled across the five centers. Estimates of type I and type II diabetes incidence were generated as a function of age (0, 1, … 19 years), sex, race/ethnicity (NHW, NHB, Hispanic, and other), and calendar year.
Mathematical model
The illness-death model presented in Figure 1 was used to generate the model-based estimate of the prevalence of type I and type II diabetes in youth in 2009. This model consists of the mutually exclusive states: healthy (with respect to the considered disease), diseased, and dead. The transition rates between the states are denoted by i, m1, and m0. Thereby, i denotes the incidence of the disease and m1 and m0 denotes the mortality rates with and without the disease, respectively. The transition rates are modeled as functions of age (a) and calendar time (t). Brinks and Landwehr [10] showed that the rates of transition between states in the illness-death model can be modeled using partial differential equations (PDEs) that express the temporal change of the age-specific prevalence in terms of the age-specific incidence and mortality rates. Based on the general mortality m = m(t, a) = (1 – p) × m0(t, a) + p × m1(t, a) of the population (with p = p(t, a) being the prevalence) and the mortality ratio the PDE can be formulated as
| (1) |
Fig. 1.
Illness-death model.
For this analysis, t included all years from 2001 to 2009, and a included all ages from 0 to less than 20 years. As the mortality rates in our considered age range are very low for individuals both with and without diabetes, it is likely that the difference between these rates is negligible. Therefore, our model assumed that the risk of mortality for youths with diabetes was the same as in youth without diabetes, that is, the difference m1 − m0 equals zero. In the online supplement, we show that this assumption would not affect our prevalence estimate. That simplifies the PDE to
| (2) |
Solving a PDE, such as Equation (2), requires initial values. We used a closed form solution for Equation (2) with the observed prevalence in 2001 (i.e., p(2001; a)) as starting values and the incidence rates between 2002 and 2008 as input values for the respective years. For 2001 and 2009, the observed incidence rate between 2002 and 2008 was extrapolated using natural cubic splines. To quantify the accuracy of the estimated prevalence, we calculated 95% bootstrap confidence intervals. Therefore, two sources of random error were considered. First, we sampled initial values from the distribution of the age-specific prevalence in 2001. Second, we sampled input values from the distribution of the age-specific incidence rates for each year between 2002 and 2009. Using these sampled initial and input values, we estimated the prevalence using Equation (2). We repeated this procedure 2000 times and used the 2.5 and 97.5 percentile of the resulting distribution as the lower and upper limit of the 95% confidence interval of the age-specific prevalence in 2009. To compare the measured and estimated prevalence, we determined the differences between them with the corresponding 95% bootstrap confidence intervals. For all analyses, we used the statistical software R (The R Foundation of Statistical Computing).
Results
Model input: prevalence 2001 and incidence 2002–2008
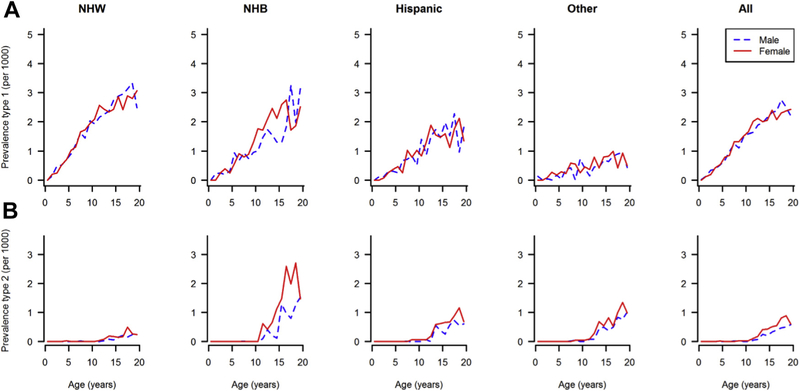
Figure 2 shows the observed 2001 prevalence of type I and type II diabetes by age, sex, and race/ethnicity. From a denominator of 3,345,777 youth aged younger than 20 years, a total of 4832 cases of type I diabetes were identified in 2001. In both males and females, the prevalence of type I diabetes increased with age, and it was higher in NHW and NHB youth than in those of other race/ethnicity group and intermediate in Hispanics. For type II diabetes, a total of 586 cases were observed in 2001. Very few cases were observed before the age of 10 years (n = 6); afterward, the prevalence increased with age and was highest among NHB girls and lowest among NHW girls and boys.
Fig. 2.
Prevalence of type I (A) and type II (B) diabetes in U.S. youth aged 0–19 years by age, sex, and race/ethnicity in 2001.
From 2002 to 2008, approximately 4.9 million youths younger than 20 years of age were under surveillance each year by SEARCH to estimate diabetes incidence by age, sex, race/ethnicity, and type. Incidence rates of type I diabetes (cases/100,000 person-years) by age, sex, race/ethnicity, and calendar year are represented in the online supplement. In both males and females, the highest incidence of type I diabetes was observed in NHW, followed by NHB and Hispanic, and lowest among youth of other race/ethnicity group, and it peeked at around 10–14 years of age. The incidence of type II diabetes in both males and females (online supplement) was extremely low under the age of 10 years and then it increased in all race/ethnicity groups, except in NHW youth. The highest rates were observed in NHB males and females, in Hispanic males and those of other race/ethnicity group.
Comparison of model estimated with observed prevalence in 2009
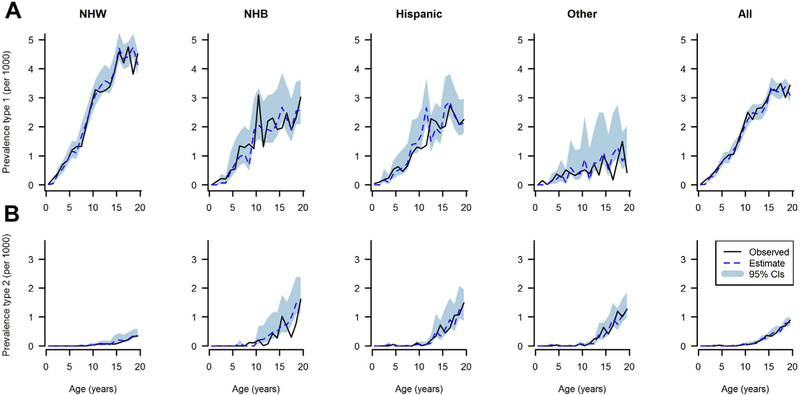
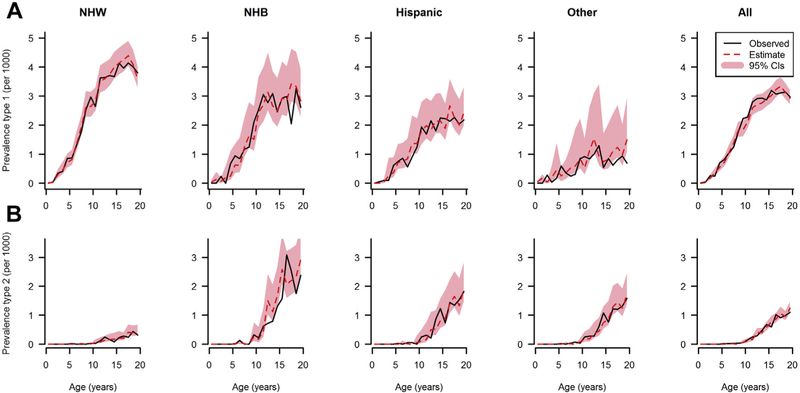
In 2009, SEARCH identified 6626 cases of diabetes from a denominator of 3,458,969 youth population aged younger than 20 years. The model-estimated and observed prevalence in 2009 of type I and type II diabetes by age, and race/ethnicity are reported in Figure 3 (males) and Figure 4 (females). In all race/ethnicity groups and both sexes, the prevalence of type I diabetes increased with age and was highest in NHW youth. Type II diabetes prevalence in 2009 in all race/ethnicity groups was extremely low before 10 years of age and then rose with increasing age. Prevalence was higher in minority race/ethnicity groups than in NHW youth. Overall, the mathematical model accurately predicted the observed prevalence.
Fig. 3.
Observed (solid line) and estimated (dotted line) prevalence of type I diabetes (A) and type II diabetes (B) in U.S. males in 2009 by age and race/ethnicity, shaded area represents 95% confidence intervals.
Fig. 4.
Observed (solid line) and estimated (dotted line) prevalence of type I diabetes (A) and type II diabetes (B) in U.S. females in 2009 by age and race/ethnicity, shaded area represents 95% confidence intervals.
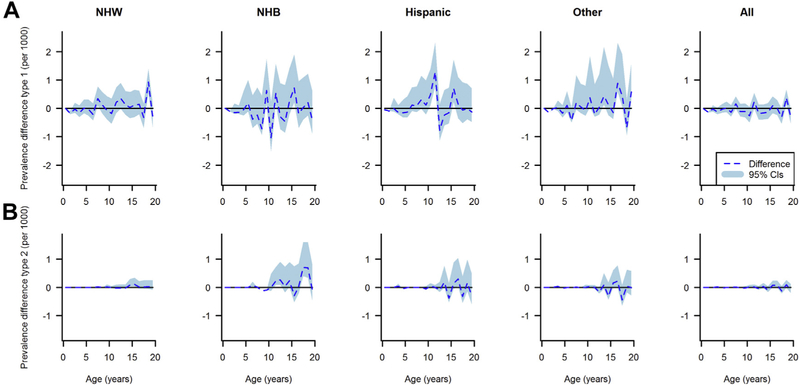
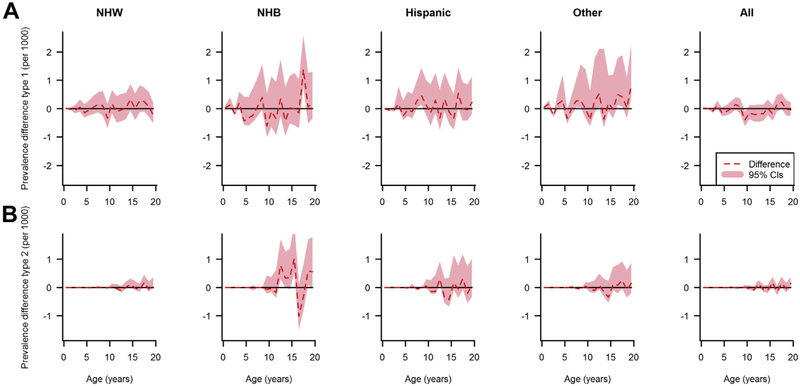
Figures 5 and 6 depict the estimated differences between the observed and estimated prevalence of type I and type II diabetes with corresponding 95% bootstrap confidence intervals. The confidence intervals suggest that a difference of zero between the observed and estimated prevalence is compatible with the data for almost the whole age range. However, in NHB, Hispanic, and other race/ethnicity groups, the statistical uncertainty estimated by bootstraps was wider because of the smaller number of cases compared with the NHW group.
Fig. 5.
Differences between the observed and estimated prevalence of type I diabetes (A) and type II diabetes (B) in U.S. males in 2009 by age and race/ethnicity, shaded area represents 95% confidence intervals.
Fig. 6.
Differences between the observed and estimated prevalence of type I diabetes (A) and type II diabetes (B) in females in 2009 by age and race/ethnicity, shaded area represents 95% confidence intervals.
Discussion
This study has demonstrated the validity of an analytical approach to estimate future disease prevalence from baseline prevalence and incidence data using an illness-death model. Up to statistical uncertainties, the estimated and observed (true) prevalence agree quite well in cases where precise estimates for the input data were available. These findings suggest that the prevalence of diabetes by type may be estimated fairly accurately from incidence data. This approach, in turn, may increase efficiency and reduce the costs of surveillance of childhood diabetes. Analysis code for use with the statistical software R is available in the Web supplement of the article by Brinks and Landwehr [8].
In general, the PDE (1) is applicable to all chronic diseases. It can also be used when diseases have a substantial remission rate and high mortality [11,12], and empirical work has shown practical applicability in these situations [13,14]. With regard to validation, extensive simulations studies [15] as well as a validation study with real-world data have been performed [16]. The validity of the PDE predictions is mainly determined by the accuracy and validity of the input data.
Besides validity, precision of the prevalence estimates is of important concern. We quantified the precision with bootstrap confidence intervals that accounted for the sampling error of the input values. The confidence intervals in smaller racial/ethnic subgroups were rather wide, indicating limited precision. Hence, the method might be less appropriate for age-specific prevalence estimation in small subgroups. However, pooling these estimates over all age groups would probably yield sufficient precision, even for racial/ethnic subgroups. When considering all races/ethnicities, the confidence intervals for the age-specific prevalence indicated high precision.
Although assessing prevalence can generally be done more easily than incidence because of the requirement of date of diagnosis for incidence, the savings by estimation of prevalence may still be substantial. In addition, if registers routinely record incident cases of a disease (e.g., through health care facilities as in SEARCH) but do not routinely perform cross-sectional studies, this method provides the possibility to quantify prevalence. Nevertheless, predicting incidence from repeated prevalence studies would enable greater savings. However, as mentioned previously, tracking incident cases allows to set up a cohort study of newly diagnosed cases (as is done in SEARCH), which provides invaluable information on the etiology of complications and the course of disease in general. Hence, there are situations in which the information from prevalent cases is more dispensable than the information from incident cases.
Incidence and prevalence of diabetes and other conditions/diseases are necessary measures for informing epidemiological, etiological, and clinical research as well as the development, implementation, and evaluation of public health programs [17]. Knowing the number and the distribution of individuals affected by diabetes in the population at a given point in time provides a framework for estimating health service needs and related costs. Incidence and temporal trends of type I diabetes, at least in high- and middle-income countries, have been well characterized [1]. Prevalence estimates, on the other hand, are sparse and often derived by applying incidence rates to age- and sex-specific estimates of population size, assuming childhood mortality being very low [18]. For type II diabetes in youth, except for the United States, population-based data on incidence and prevalence are limited [19].
Our study presents some limitations. First, PDE (1) uses the assumption that the prevalence of type I and type II in migrants is similar to the resident population. In situations where this assumption is violated extensively, the equation needs to be modified as described by Brinks and Landwehr [8]. However, U.S. national immigration statistics indicate that the annual number of immigrant youths is very low [20]. Therefore, it is reasonable to assume that in our study, the proportion of migrants was probably very low and likely did not affect our estimates.
Second, our model does not include the state of undiagnosed, that is, individuals with the disease that have not yet been identified. Type I diabetes diagnosis usually occurs soon after the onset of symptoms as glucose control deteriorates rapidly because of the lack of endogenous insulin. Type II diabetes, on the other hand, at least in adults, could be undetected for years before a diagnosis is made. However, in youth, population-based screenings for diabetes have found very few cases of undiagnosed diabetes [21,22]. This suggests that youth-onset type II diabetes is characterized by a rapid deterioration of glucose regulation [23] and severe symptoms, leading these individuals to seek medical attention. Therefore, the proportion of the youth population with undiagnosed diabetes is probably negligible and unlikely to affect our estimates.
As death rate because of diabetes is very low among U.S. youth [24,25], in our model, mortality data were not included to estimate prevalence based on incidence rate. We demonstrate (see online supplement) that the contribution of differential mortality on prevalence in this age group is negligible and assumed that the relative risk of mortality was equal to one. However, when there is a difference in mortality between healthy and diseased persons, as in adults with diabetes compared with those without it [26], then mortality rates need to be considered as shown in Tamayo et al [13].
In conclusion, we described an illness-death model capable of using baseline prevalence and incidence rates to estimate future age-, sex- and race/ethnicity-specific prevalence of youth-onset diagnosed type I and type II diabetes. This model could represent an efficient alternative for childhood diabetes surveillance. In addition, it could be used for estimating the impact of primary prevention programs, for example, by estimating the reduction in prevalent cases for any given reduction in incidence. Together with the projections of future birth, immigration, and mortality rates, this method can also be used to project numbers of diabetes cases by age, sex, and race/ethnicity. Expanding the application of the illness-death model to estimating age-, sex-, and race/ethnicity-specific incidence rates from a series of cross-sectional prevalence studies, as it has been demonstrated by Brinks et al [12], could enable further potential reductions in surveillance efforts.
Acknowledgments
SEARCH for Diabetes in Youth Registry is funded by the Centers for Disease Control and Prevention (PA numbers 00097, DP-05–069, DP-10–001, and DP-15–002) and supported by the National Institute of Diabetes and Digestive and Kidney Diseases.
Footnotes
The findings and conclusions in this report are those of the authors and do not necessarily represent the official position of the Centers for Disease Control and Prevention.
References
- [1].Imperatore G, Mayer-Davis E, Orchard T, Zhong V. Prevalence and incidence of type 1 diabetes among children and adults in the United States and comparisons with non-U.S. countries In: Cowie C, Casagrande S, Menke A, Cissell M, Eberhardt M, Meigs J, et al. , editors. Diabetes in America. 3rd ed Bethesda, MD: National Institutes of Health; 2017. [Google Scholar]
- [2].Pettitt DJ, Talton J, Dabelea D, Divers J, Imperatore G, Lawrence JM, et al. Prevalence of diabetes in U.S. youth in 2009: the SEARCH for diabetes in youth study. Diabetes Care 2014;37(2):402–8. [DOI] [PMC free article] [PubMed] [Google Scholar]
- [3].Ogden C, Carroll M, Fryar C, Flegal K. Prevalence of obesity among adults and youth: United States, 2011–2014. NCHS Data Brief 2015;(219):1–8. [PubMed] [Google Scholar]
- [4].Kivimӓki M, Kuosma E, Ferrie JE, Luukkonen R, Nyberg ST, Alfredsson L, et al. Overweight, obesity, and risk of cardiometabolic multimorbidity: pooled analysis of individual-level data for 120 813 adults from 16 cohort studies from the USA and Europe. Lancet Public Health 2017;2(6):e277–85. [DOI] [PMC free article] [PubMed] [Google Scholar]
- [5].Dabelea D, Mayer-Davis EJ, Saydah S, Imperatore G, Linder B, Divers J, et al. Prevalence of type 1 and type 2 diabetes among children and adolescents from 2001 to 2009. JAMA 2014;311(17):1778–86. [DOI] [PMC free article] [PubMed] [Google Scholar]
- [6].Mayer-Davis EJ, Lawrence JM, Dabelea D, Divers J, Isom S, Dolan L, et al. Incidence trends of type 1 and type 2 diabetes among youths, 2002e2012. N Engl J Med 2017;376(15):1419–29. [DOI] [PMC free article] [PubMed] [Google Scholar]
- [7].Hamman RF, Bell RA, Dabelea D, D’Agostino RB Jr, Dolan L, Imperatore G, et al. The SEARCH for Diabetes in Youth Study: rationale, findings, and future directions. Diabetes Care 2014;37(12):3336–44. [DOI] [PMC free article] [PubMed] [Google Scholar]
- [8].Brinks R, Landwehr S. Age- and time-dependent model of the prevalence of non-communicable diseases and application to dementia in Germany. Theor Popul Biol 2014;92:62–8. [DOI] [PubMed] [Google Scholar]
- [9].The SEARCH Study Group. SEARCH for Diabetes in Youth: a multicenter study of the prevalence, incidence and classification of diabetes mellitus in youth. Control Clin Trials 2004;25(5):458–71. [DOI] [PubMed] [Google Scholar]
- [10].Brinks R, Landwehr S. A new relation between prevalence and incidence of a chronic disease. Math Med Biol 2015;32(4):425–35. [DOI] [PMC free article] [PubMed] [Google Scholar]
- [11].Brinks R, Landwehr S. Change rates and prevalence of a dichotomous variable: simulations and applications. PLoS One 2015;10(3):e0118955. [DOI] [PMC free article] [PubMed] [Google Scholar]
- [12].Brinks R, Hoyer A, Landwehr S. Surveillance of the incidence of non-communicable diseases (NCDs) with sparse resources: A simulation study using data from a National Diabetes Registry, Denmark, 1995–2004. PLoS One 2016;11(3):e0152046. [DOI] [PMC free article] [PubMed] [Google Scholar]
- [13].Tamayo T, Brinks R, Hoyer A, Kuß O, Rathmann W. The prevalence and incidence of diabetes in Germany: an analysis of statutory health insurance data on 65 million individuals from the years 2009 and 2010. Dtsch Arztebl Int 2016;113(11):177–82. [DOI] [PMC free article] [PubMed] [Google Scholar]
- [14].Tönnies T, Hoyer A, Brinks R. Excess mortality for people diagnosed with type 2 diabetes in 2012 e Estimates based on claims data from 70 million Germans. Nutr Metab Cardiovasc Dis 2018;28(9):887–91. [DOI] [PubMed] [Google Scholar]
- [15].Brinks R, Landwehr S, Icks A, Koch M, Giani G. Deriving age-specific incidence from prevalence with an ordinary differential equation. Stat Med 2013;32(12):2070–8. [DOI] [PubMed] [Google Scholar]
- [16].Vijayakumar P, Hoyer A, Nelson RG, Brinks R, Pavkov ME. Estimation of chronic kidney disease incidence from prevalence and mortality data in American Indians with type 2 diabetes. PLoS One 2017;12(2): e0171027. [DOI] [PMC free article] [PubMed] [Google Scholar]
- [17].Thacker SB, Berkelman RL. Public health surveillance in the United States. Epidemiol Rev 1988;10:164–90. [DOI] [PubMed] [Google Scholar]
- [18].Patterson CC, Dahlquist GG, Gyürüs E, Green A, Soltész G, EURODIAB Study Group. Incidence trends for childhood type 1 diabetes in Europe during 1989–2003 and predicted new cases 2005–20: a multicentre prospective registration study. Lancet 2009;373(9680):2027–33. [DOI] [PubMed] [Google Scholar]
- [19].Fazeli Farsani S, van der Aa MP, van der Vorst MM, Knibbe CA, de Boer A. Global trends in the incidence and prevalence of type 2 diabetes in children and adolescents: a systematic review and evaluation of methodological approaches. Diabetologia 2013;56(7):1471–88. [DOI] [PubMed] [Google Scholar]
- [20].United States Department of Homeland Security. Yearbook of immigration statistics: 2016. Washington, D.C: U.S. Department of Homeland Security, Office of Immigration Statistics; 2017. [Google Scholar]
- [21].The STOPP-T2D Prevention Study Group. Presence of diabetes risk factors in a large U.S. eighth-grade cohort. Diabetes Care 2006;29(2):212–7. [DOI] [PMC free article] [PubMed] [Google Scholar]
- [22].Dolan LM, Bean J, D’Alessio D, Cohen RM, Morrison JA, Goodman E, et al. Frequency of abnormal carbohydrate metabolism and diabetes in a population-based screening of adolescents. J Pediatr 2005;146(6):751–8. [DOI] [PubMed] [Google Scholar]
- [23].Hannon TS, Arslanian SA. The changing face of diabetes in youth: lessons learned from studies of type 2 diabetes. Ann N Y Acad Sci 2015;1353(1): 113–37. [DOI] [PubMed] [Google Scholar]
- [24].Saydah S, Imperatore G, Cheng Y, Geiss L, Albright A. Disparities in diabetes deaths among children and adolescents – United States, 2000–2014. MMWR Morb Mortal Wkly Rep 2017;66(19):502–5. [DOI] [PMC free article] [PubMed] [Google Scholar]
- [25].Reynolds K, Saydah SH, Isom S, Divers J, Lawrence JM, Dabelea D, et al. Mortality in youth-onset type 1 and type 2 diabetes: the SEARCH for diabetes in youth study. J Diabetes Complications 2018;32(2):545–9. [DOI] [PMC free article] [PubMed] [Google Scholar]
- [26].Gregg EW, Cheng YJ, Saydah S, Cowie C, Garfield S, Geiss L, et al. Trends in death rates among U.S. adults with and without diabetes between 1997 and 2006 - findings from the national health interview survey. Diabetes Care 2012;35(6):1252–7. [DOI] [PMC free article] [PubMed] [Google Scholar]


