

Abstract
Background:
As football comes under greater scrutiny because of concussions and other injuries, many people are searching for safer alternatives, especially for youth athletes. The injury rate in TackleBar football, one such alternative, is not currently known.
Purpose:
To describe TackleBar football and calculate its injury rate over a single season to compare it with both traditional tackle and flag football.
Study Design:
Descriptive epidemiology study.
Methods:
TackleBar football was described, and injuries of male athletes (age range, 9-14 years) participating in TackleBar football were tracked over the course of a season (August 5 through October 27, 2018) and compared with published injury rates for traditional tackle and flag football.
Results:
The overall injury rate of TackleBar football was found to be 0.31 per 1000 athlete-exposures (AEs), which is lower than youth tackle (2.25-2.60/1000 AEs) and flag (5.77/1000 AEs) football.
Conclusion:
TackleBar football may represent a reasonable alternative to tackle and flag football with regard to injuries.
Keywords: football, injury, concussion, youth
From 2009 to 2017, the number of athletes aged 6 to 17 years playing football in the United States dropped from 7.24 million to 5.22 million.19 The number of individuals playing high school football dropped from 1.11 million to 1.05 million.17,18 Despite this, football remains the most popular sport among American high school boys.18 A commonly cited reason for this decline is the perceived danger of football, especially with regard to head injuries and concussions.
There is some concern that media hype overstating what we understand about the risks of the chronic effects of neurotrauma versus the benefits of sports is moving faster than rigorous science and research in this regard. Multiple letters in the scientific and popular press call for caution to avoid hysteria and enable the creation of policy that is scientifically supported.4,22 Limited anecdotal studies of professional athletes playing many years ago appear to be driving decision-making for current youth sports participation. What is clearly understood is that sports have immense benefits, despite their perceived risks, and greater participation is in the societal interest.2,7
The Sports Trauma and Overuse Prevention (STOP) initiative created by the American Orthopaedic Society for Sports Medicine noted that approximately 10% of youth and high school athletes were treated for football-related injuries in 2007, including heat stroke, muscle strains, and concussions, among others.23 While many injuries occurred during noncontact aspects of the game, tackling was the most common mechanism of injury, leading to suggestions that reducing tackling would decrease the injury potential.5
Reducing full-contact practices for youth players has shown mixed results on the overall concussion risk.3,14 Age thresholds for initiating contact play have been introduced by USA Hockey and Hockey Canada youth leagues.15 The Aspen Institute proposed prohibiting tackling for athletes younger than a certain age, despite minimal data support and hypotheses that delaying tackling may increase the risk of injuries because it results in bigger, stronger, and faster athletes performing improper tackles and blocks without having learned the proper technique and form at younger ages.1,5
Consideration of nontackle alternative forms of football has seen increased momentum.1,5 Flag football modifies many of the rules from tackle football, such as the lack of linemen, no rushing the quarterback or quarterback sneaks, fixed first downs, and most importantly, wearing a number of flags on a belt. A ball carrier is considered “down” not when he or she is forced to the ground but when a flag is removed from his or her belt. Because tackling is prohibited, protective padding and helmets are not worn, although the sport remains highly physical and fast-paced.20 In addition, without the need for blocking and tackling, flag football places nearly all of its emphasis on “skilled” positions such as quarterbacks, running backs, and receivers. This may discourage participants with a predilection for nonspeed positions, such as children who are obese or asthmatic, who would see disproportionate benefits with increased sports activity.6,10
In response to their sons’ desire to move on from flag football to full tackle football, a Minnesota couple created a new nontackling alternative called TackleBar football. In this version of football, the style of play is nearly identical to traditional tackle football. All players wear protective equipment (helmets, shoulder pads, a mouth guard), and the TackleBar harness. Each down is played in the exact same manner as tackle football, with teams lining up against one another. Play begins with a snap, with the offense performing passing or running plays and the defense rushing the offense. Touchdowns are still 6 points, and an extra point can be scored via a running or passing play afterward.
A ball carrier is considered down, and the play is over, when a defensive player removes one of the foam bars from the ball carrier’s harness. To remove the bar, players are taught and encouraged to use the “wrap and rip” technique (Figure 1). With this technique, players wrap their arms around the ball carrier (mimicking the proper tackling form), grab the foam bars on the harness, and remove at least one of the bars without bringing the ball carrier to the ground. Players are not allowed to leave their feet when blocking or downing the ball carrier. Excessive force and intentionally forcing the ball carrier to the ground result in a defensive penalty.
Figure 1.
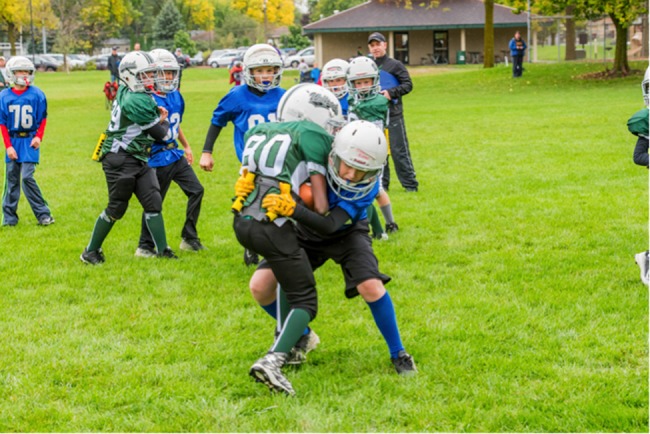
Participants demonstrating the “wrap and rip” technique used to down the ball carrier in TackleBar football. Courtesy of TackleBar.
There are no kickoffs in TackleBar football; instead, new possessions are started at the offense’s own 25 yard line. Punting is allowed, but there is no punt rush or coverage. The ball is spotted wherever the ball is caught or where it comes to rest. Coaches and team staff are provided online resources by TackleBar, explaining the techniques and rules of the game. TackleBar staff are also available to answer any questions.
Rules, drills, and playing suggestions can be found at https://cdn.shopify.com/s/files/1/0956/1468/files/TackleBar-Guidebook-new.pdf?69. Videos of athletes playing and demonstrating TackleBar can be found at https://tacklebar.com/pages/videos.
TackleBar football completed its third season in the fall of 2018 and is currently played by thousands of participants across 23 states in the United States. The purpose of this article is to describe TackleBar football in the context of its relative safety compared with historical studies of tackle and flag football.
Methods
Participants
Between August 5 and October 27, 2018, 56 TackleBar football teams composed of predominantly male athletes in grades 3 to 8 (age range, 9-14 years) were followed. Participants were divided based on grade level (third and fourth grades, fifth and sixth grades, and seventh and eighth grades). Teams were located primarily across central Minnesota, with the greatest density in the Minneapolis/St Paul area. Two leagues were from Wisconsin, and 1 was from Iowa. Teams competed with other local teams in the same age range and were independent of school-sanctioned sports.
Data Collection
None of the teams had athletic trainers; therefore, a member of the team personnel, such as the head coach or assistant coach (nearly all of whom were volunteers), utilized a web-based survey tool, which reported on game and practice occurrence and attendance as well as injuries incurred by their athletes each week. For each injury, respondents reported on the age of the athlete, his position, the body part(s) injured, what the athlete was doing at the time of the injury, the injury date, the return to play date, and a description of how the injury occurred in as much detail as possible. In addition, each week, respondents were asked to report any relevant updates to injuries reported from previous weeks.
Definitions
Respondents were told to use the following definition for an injury, based off the report by Peterson et al20: (1) occurring during a sanctioned game or practice; (2) requiring the attention of a coach, athletic trainer, or physician; and (3) requiring the athlete to miss participation in the following game or practice. Any injury event meeting the first 2 criteria but not the third was recorded but not flagged as a “true” injury.
Data Analysis
Athlete exposures (AEs), defined as 1 athlete participating in 1 game or practice, were calculated based on the number of practices and games reported, multiplied by the number of rostered athletes, and subtracting all absences reported. This definition was held as standard across all published reports used for comparison. Within TackleBar football, each participant receives roughly equal playing time per game/practice; thus, each participant present contributes equally to the AE calculation per game/practice. Practices were typically an hour and a half long, with games usually lasting an hour.
Injury rates were calculated by dividing the number of injuries by the number of AEs. To compare the injury rate of TackleBar football with those published for alternatives, risk ratios were calculated by dividing the published injury rates by the calculated rate of TackleBar football.
Results
Over the course of the 3-month period (1 season), 56 teams filed a total of 293 surveys (Figure 2). There were 926 athletes who competed, and there were 15,910 AEs, with 5 of 17 reported injuries precluding participation in a subsequent practice or game. This accounted for an injury rate of 0.31 injuries per 1000 AEs. The number of players for each team ranged from 10 to 24 players, with a mean of 15.4 ± 3.0 players and a median of 15 players. Larger teams were typically made up of athletes from multiple grades, while teams with athletes in only 1 or 2 grades usually had a smaller roster.
Figure 2.

Histogram of the number of reports submitted over the course of the season. The x-axis is the date of submission, with the beginning of August on the left and the end of October on the right.
Of the 17 total injuries reported, only 5 resulted in missing a subsequent game or practice (Table 1). Of the 12 reports excluded, 5 noted that the athlete returned to play the same day of the injury. Among the 5 reports that precluded subsequent play, 3 athletes were hurt during games, and 2 were in practices. The most common body part injured was the hand or wrist, with 3 athletes injuring the fingers or wrist. In addition, there was 1 knee hyperextension and 1 back injury. Two of these injuries resulted in entire seasons being missed: one athlete broke a growth plate in his wrist while performing up/downs, and another hurt his back, causing him to decide to leave the team, although he was cleared by a doctor that day. Among the other 3 injuries, the mean time to return to play was 4 days, roughly 2 practices/games.
Table 1.
Overview of Injuries Reported
| Injury | Age of Athlete, y | Position | Recovery Time | Extenuating Circumstances |
|---|---|---|---|---|
| Knee hyperextension | 9 | Offensive tackle | 4 d | |
| Broken finger | 13 | Offensive guard | 3 d | |
| Broken wrist | 9 | Center | Season | Broken growth plate |
| Finger dislocation | 11 | Defensive lineman | 5 d | |
| Bruised back | 11 | Defensive lineman | Season | Cleared for return, chose to leave team |
Discussion
TackleBar football likely represents a relatively safe alternative to conventional tackle and flag football, which can be widely adopted by coaches and players accustomed to these more traditional sport forms. Despite the limitation of variable mechanisms of data collection and relatively smaller sample size, the injury rate in TackleBar football appears lower than those previously reported for tackle and flag football. Using the same reporting structure, injury definitions, and participant age ranges (grades 2-7), Peterson et al20 found youth tackle football to have an injury rate of 2.60 per 1000 AEs (n = 44,164) and youth flag football to have an injury rate of 5.77 per 1000 AEs (n = 2252). Concussion rates were found to be 0.68 and 1.33 per 1000 AEs for tackle and flag football, respectively,20 while TackleBar football did not report a single concussion or head injury.
Similar injury rates for youth tackle football have been reported. Dompier et al8 found that among tackle football participants between the ages of 5 and 14 years, the injury rate was 2.25 (n = 142,536), with the concussion rate being 0.99 per 1000 AEs. However, the definition of injury used in this study may be slightly different than that used by TackleBar football and Peterson et al.20 The data collection systems used by Dompier et al8 (Youth Football Surveillance System; National Athletic Treatment, Injury and Outcomes Network; and National Collegiate Athletic Association Injury Surveillance Program) collect data on all injuries, regardless of participation restriction, but a distinction is made between “time loss” and “non–time loss” injuries, which was not noted by Dompier et al.8,9,12 In other publications using the same data collection systems, this distinction is noted, however.13 Because we do not know whether non–time loss injuries were included in the analysis by Dompier et al,8 all 17 injuries reported by TackleBar are included in an “overall” injury rate of 1.07 per 1000 AEs.
Higher levels of competition, in age groups in which TackleBar football has not been trialed, have reported higher rates of injury. Overall injury rates for high school tackle football are 4.74 and 4.36 per 1000 AEs (n = 860,202 and 431,242) and for college are 3.21 and 8.61 per 1000 AEs (n = 315,723 and 401,932).8,21 In all reports, injuries were more common during games than practices, which was also the case in TackleBar football.8,11,20,21 Table 2 summarizes these rates as well as reporting the risk ratio for each when compared with TackleBar football. These comparisons, especially between youth and collegiate leagues, should be analyzed with care. As age increases, competitiveness and speed of play do as well. Youth leagues are composed of local participants with little to no stipulation over who can and cannot play. No athletic trainers are present. Collegiate athletes are generally scouted for their natural above-average talent and trained to push themselves further. Athletic trainers and medical teams provide supportive care. Impact forces are dramatically more significant for athletes who are larger, faster, and stronger than children. These factors combined will naturally result in the greater capacity for injuries among collegiate leagues. Therefore, the ability to generalize these rates among youth athletes is low at best.
Table 2.
Outline of Reported Injuries and Ratesa
| Sport | No. of AEs | No. of Injuries | Injury Rate | Risk Ratio (of TackleBar) | No. of Concussions | Concussion Rate |
|---|---|---|---|---|---|---|
| TackleBar | 15,910 | 5b (17) | 0.31b (1.07) | — | 0 | 0.00 |
| Youth tackle8 | 142,536 | 321 | 2.25 | 2.10 | 141 | 0.99 |
| Youth tackle20 | 44,164 | 115b | 2.60b | 8.39b | 30b | 0.68b |
| Youth flag20 | 2252 | 13b | 5.77b | 18.61b | 3b | 1.33b |
| High school tackle8 | 860,202 | 4077 | 4.74 | 4.43 | 795 | 0.92 |
| High school tackle21 | 431,242 | 1881 | 4.36 | 4.07 | 208c | 0.48c |
aAE, athlete-exposure.
bTime-loss injuries only.
cCalculated from the reported proportion of injuries being concussions; no incidence or rate was reported by the authors.
Reports of higher injury rates and concussion rates in flag football may surprise many. However, insight into impact biometrics sheds some light on this.16 Lynall et al16 reported that while tackle football athletes had higher rates of head impact, flag football athletes were found to have greater median linear and rotational head acceleration upon impact as well as greater odds of high rotational acceleration. This may help explain the disparities seen in concussion rates, as head acceleration is believed to be a large contributing factor in concussions. Besides head impacts, Lynall et al16 reported anecdotal observations of increased unregulated contact in flag football that were not seen in tackle football. This may also help to explain the higher rates of injury in youth flag football.
Limitations to this study include its small study population, temporal occurrence over only 1 season, comparison to historical data, and reliance on self-reported data provided by volunteer staff and not trained athletic trainers. Although respondents were reminded to complete the weekly survey, Figure 2 outlines the disparity of submissions over the course of the season. In addition, operational definitions may be slightly different between the reported TackleBar data and previously published results. While the TackleBar methodology was adapted directly from Peterson et al,20 other authors may have grouped time loss injuries and non–time loss injuries together in their analyses. To make fair comparisons, both definitions have been used to create the injury rate for TackleBar football.
Conclusion
TackleBar football is a relatively easy-to-adopt alternative that results in a favorable safety profile in comparison to other forms of football.
Footnotes
One or more of the authors has declared the following potential conflict of interest or source of funding: T.H. is the chief executive officer of TackleBar as well as a shareholder in the company. TackleBar itself holds a number of patents covering its intellectual property. U.S. has received research support from Integra LifeSciences; consulting fees from Medtronic; speaking fees from Integra LifeSciences, Medtronic, and Abbott Laboratories; and hospitality payments from Globus Medical, Mazor Robotics, Medtronic, Vertex Pharmaceuticals, DePuy Synthes, St Jude Medical, Surgical Theater, NuVasive, and LDR Spine USA. AOSSM checks author disclosures against the Open Payments Database (OPD). AOSSM has not conducted an independent investigation on the OPD and disclaims any liability or responsibility relating thereto.
Ethical approval was not sought for the present study.
References
- 1. Aspen Institute. What if…flag becomes the standard way of playing football until high school? Available at: https://assets.aspeninstitute.org/content/uploads/2018/09/FINAL-Future-of-Football-Paper.4.pdf?_ga=2.75407890.1204141061.1541786616-2007758995.1541786616. Accessed November 19, 2018.
- 2. Babiss LA, Gangwisch JE. Sports participation as a protective factor against depression and suicidal ideation in adolescents as mediated by self-esteem and social support. J Dev Behav Pediatr. 2009;30(5):376–384. [DOI] [PubMed] [Google Scholar]
- 3. Broglio SP, Martini D, Kasper L, et al. Estimation of head impact exposure in high school football: implications for regulating contact practices. Am J Sports Med. 2013;41(12):2877–2884. [DOI] [PMC free article] [PubMed] [Google Scholar]
- 4. Chung J, Cummings P, Samadani U. Does CTE call for an end to youth tackle football? Star Tribune. February 10, 2018 Available at: http://www.startribune.com/does-cte-call-for-an-end-to-youth-tackle-football/473655913/. Accessed May 17, 2019.
- 5. Council on Sports Medicine and Fitness. Tackling in youth football. Pediatrics. 2015;136(5):e1419–e1430. [DOI] [PubMed] [Google Scholar]
- 6. Davis CL, Pollock NK, Waller JL, et al. Exercise dose and diabetes risk in overweight and obese children: a randomized, controlled trial. JAMA. 2012;308(11):1103–1112. [DOI] [PMC free article] [PubMed] [Google Scholar]
- 7. Diamond AB. The cognitive benefits of exercise in youth. Curr Sports Med Rep. 2015;14(4):320–326. [DOI] [PubMed] [Google Scholar]
- 8. Dompier TP, Kerr ZY, Marshall SW, et al. Incidence of concussion during practice and games in youth, high school, and collegiate American football players. JAMA Pediatr. 2015;169(7):659–665. [DOI] [PubMed] [Google Scholar]
- 9. Dompier TP, Marshall SW, Kerr ZY, et al. The National Athletic Treatment, Injury and Outcomes Network (NATION): methods of the surveillance program, 2011–2012 through 2013–2014. J Athl Train. 2015;50(8):862–869. [DOI] [PMC free article] [PubMed] [Google Scholar]
- 10. Ingul CB, Tjonna AE, Stolen TO, et al. Impaired cardiac function among obese adolescents: effect of aerobic interval training. Arch Pediatr Adolesc Med. 2010;164(9):852–859. [DOI] [PubMed] [Google Scholar]
- 11. Kerr ZY, Collins CL, Mihalik JP, Marshall SW, Guskiewicz KM, Comstock RD. Impact locations and concussion outcomes in high school football player-to-player collisions. Pediatrics. 2014;134(3):489–496. [DOI] [PubMed] [Google Scholar]
- 12. Kerr ZY, Dompier TP, Snook EM, et al. National Collegiate Athletic Association Injury Surveillance System: review of methods for 2004–2005 through 2013–2014 data collection. J Athl Train. 2014;49(4):552–560. [DOI] [PMC free article] [PubMed] [Google Scholar]
- 13. Kerr ZY, Marshall SW, Simon JE, et al. Injury rates in age-only versus age-and-weight playing standard conditions in American youth football. Orthop J Sports Med. 2015;3(9):2325967115603979. [DOI] [PMC free article] [PubMed] [Google Scholar]
- 14. Kontos AP, Elbin RJ, Fazio-Sumrock VC, et al. Incidence of sports-related concussion among youth football players aged 8–12 years. J Pediatr. 2013;163(3):717–720. [DOI] [PubMed] [Google Scholar]
- 15. Korioth T. AAP policy: raise body checking age to 15 to cut concussions among hockey players. AAP News. May 26, 2014 https://www.aappublications.org/content/35/6/22 Available at: Accessed November 19, 2018. [Google Scholar]
- 16. Lynall RC, Lempke LB, Johnson RS, et al. A comparison of youth flag and tackle football head impact biometrics [published online January 18, 2019]. J Neurotrauma. doi:10.1089/neu.2018.6236. [DOI] [PubMed] [Google Scholar]
- 17. National Federation of High School Associations. 2009-10 high school athletics participation survey. Available at: http://www.nfhs.org/ParticipationStatistics/PDF/2009-10%20Participation%20Survey.pdf. Accessed January 24, 2019.
- 18. National Federation of High School Associations. 2016-17 high school athletics participation survey. Available at: http://www.nfhs.org/ParticipationStatistics/PDF/2016-17_Participation_Survey_Results.pdf. Accessed January 24, 2019.
- 19. Outdoor Industry Association. Outdoor participation report. Available at: https://outdoorindustry.org/resource/2018-outdoor-participation-report/. Accessed January 24, 2019.
- 20. Peterson AR, Kruse AJ, Meester SM, et al. Youth football injuries: a prospective cohort. Orthop J Sports Med. 2017;5(2):2325967116686784. [DOI] [PMC free article] [PubMed] [Google Scholar]
- 21. Shankar PR, Fieids SK, Collins CL, Dick RW, Comstock RD. Epidemiology of high school and collegiate football injuries in the United States, 2005-2006. Am J Sports Med. 2007;35(8):1295–1303. [DOI] [PubMed] [Google Scholar]
- 22. Stewart W, Allinson K, Al-Sarraj S, et al. Primum non nocere: a call for balance when reporting on CTE. Lancet. 2019;18(3):P231–P233. [DOI] [PMC free article] [PubMed] [Google Scholar]
- 23. Stop Sports Injuries. Preventing football injuries. Available at: https://www.sportsmed.org//aossmimis/stop/downloads/Football.pdf. Accessed November 19, 2018.