Abstract
Objectives:
Bayesian interpretation of diagnostic test results usually involves point estimates of the pretest probability and the likelihood ratio corresponding to the test result; however, it may be more appropriate in clinical situations to consider instead a range of possible values to express uncertainty in the estimates of these parameters. We thus sought to demonstrate how uncertainty in sensitivity, specificity, and disease pretest probability can be accommodated in Bayesian interpretation of diagnostic testing.
Methods:
We investigated three questions: How does uncertainty in the likelihood ratio propagate to the posttest probability range, assuming a point estimate of pretest probability? How does uncertainty in the sensitivity and specificity of a test affect uncertainty in the likelihood ratio? How does uncertainty propagate when present in both the pretest probability and the likelihood ratio?
Results:
Propagation of likelihood ratio uncertainty depends on the pretest probability and is more prominent for unexpected test results. Uncertainty in sensitivity and specificity propagates into the calculation of likelihood ratio prominently as these parameters approach 100%; even modest errors of ±10% caused dramatic propagation. Combining errors of ±20% in the pretest probability and in the likelihood ratio exhibited modest propagation to posttest probability, suggesting a realistic target range for clinical estimations.
Conclusions:
The results provide a framework for incorporating ranges of uncertainty into Bayesian reasoning. Although point estimates simplify the implementation of Bayesian reasoning, it is important to recognize the implications of error propagation when ranges are considered in this multistep process.
Keywords: Bayes, decision, sensitivity, specificity, statistics
Although not commonly used in a formal sense, the Bayesian approach to diagnostic test results offers an intuitive strategy for interpreting results in the context of the physician’s clinical impression, that is, the pretest probability (pre-TP) of disease.1,2 The Bayes nomogram simplifies “bedside” application of this approach by providing a visual tool for adjusting the disease probability, from the starting point of pre-TP, based on a given test result, to yield a posttest probability (post-TP). The adjustment factor provided by the test result is known as the likelihood ratio (LR) and is a function of the sensitivity and specificity of a test. Each test can be characterized by a positive LR (providing an upward adjustment of disease probability if a positive test result occurs) and a negative LR (providing a downward adjustment if a negative test result occurs).
Despite the clinical importance of considering the pre-TP when interpreting test results, the “base-rate fallacy” (failure to consider the pre-TP) and other difficulties with probabilistic thinking have been described in studies of trainees and practicing physicians alike.3–12 These studies highlight the wide-spread difficulties associated with probabilistic thinking.13,14 Some authors have suggested that the challenges of probabilistic reasoning represent potential pitfalls to evidence-based medicine.15 Others have suggested the use of summary statistics that capture information contained in the combination of sensitivity and specificity (eg, Youden’s “J” index) or positive and negative predictive value (eg, the predictive summary index).16 Whether the introduction of composite measures is easier to understand or implement has not been tested.
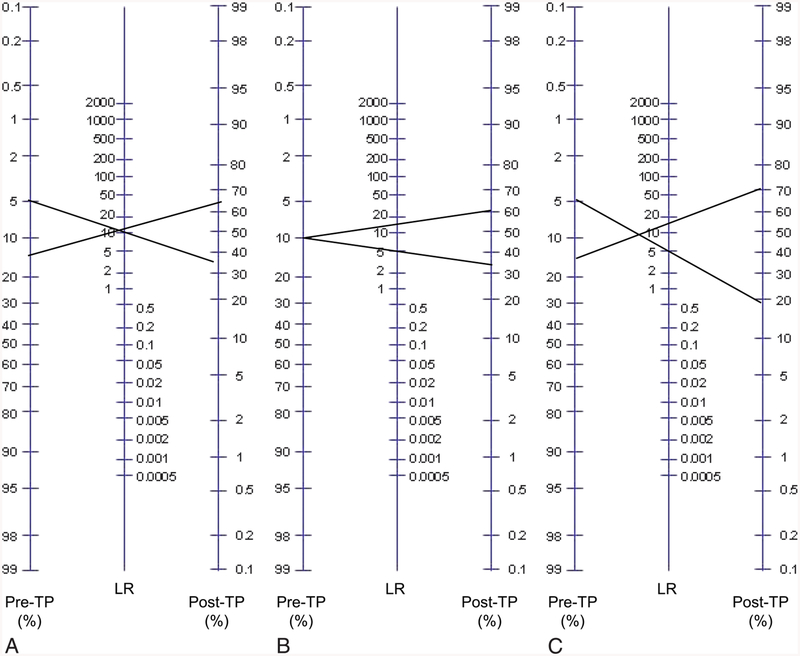
Even for those comfortable with the mathematics of Bayes theorem, using it in realistic clinical circumstances is not without challenges and criticism.15,17,18 One potential limitation involves the implication that a single value, or point estimate, is required of the pre-TP and the LR values used to define the straight line used in the nomogram (Fig. 1). Physicians may not be comfortable with such precise estimation and could justifiably be unsure about how to apply their more general clinical judgments. For example, disease probability could be considered in terms such as “low” or “high,” terms that may imply a range of possible values. Epidemiological data on dis-ease prevalence and publications regarding diagnostic test parameters are reported with error ranges or confidence intervals, and incorporating these types of data (rather than point estimates) may be a better representation of the uncertainties present in diagnostic test interpretation.
Fig. 1.
Visualizing uncertainty in the Bayes nomogram. The standard Bayes nomogram (adapted from www.CEBM.net) consists of a column of pretest probability (pre-TP) and a column of likelihood ratio (LR) values, and a column of post-TP values. One simply draws a line connecting point estimates of pre-TP and LR of a given test result and extends the line to read the resulting post-TP of disease. Ranges of pre-TP (A), LR (B), or both (C) are shown to illustrate propagation of uncertainty. Note the similar growth of post-TP disease uncertainty when considering component uncertainty in either pre-TP (A) or LR (B). When both steps contain uncertainty, the post-TP range is even larger (C), with the limits being formed by the lower limit of the pre-TP range (5%) mapping through the lower limit of the LR (5), and the upper limit of pre-TP (15%) mapping through the upper limit of LR (15).
We investigated how considering a range of pre-TP values can affect the Bayesian interpretation of test results.19 When uncertainty in pre-TP is expressed as a range of disease probability, the resulting post-TP uncertainty depends upon three factors: the absolute magnitude of the pre-TP uncertainty range, the likelihood ratio (and thus the component sensitivity and specificity values) of the test, and the extent to which the test result was unexpected. In clinical practice, uncertainty exists not only in our pre-TP estimates but also in our estimates of the sensitivity and specificity of a test (and by extension, the LR that is derived from them). In the present study, therefore, we investigated how uncertainty in the likelihood ratio affects Bayesian diagnostic test interpretation in three settings: how a range of LR values converts point-estimate pre-TP values into a range of post-TP values, how uncertainty in sensitivity and specificity values affects the calculation of LR, and how the combination of uncertainty in pre-TP and in LR propagate to the post-TP.
Methods
Calculations and figure generation were performed using MATLAB 2009a (Natick, MA). Simulations of LR calculations based on draws from distributions of sensitivity and specificity also were performed in MATLAB. In each simulation, a Gaussian distribution was assumed, then truncated to be bounded by 0% and 100%. From these distributions, 5 million draws were obtained for sensitivity and specificity values, and these were used to calculate a distribution of LR values.
Results
Point Estimates and Ranges in the Bayes Nomogram
Figure 1 illustrates the Bayes nomogram, a convenient tool for probabilistic interpretation of test results. It allows one to visually determine the post-TP by extending a straight line connecting two point estimates: the pre-TP of disease in the given clinical situation and the LR value corresponding to the obtained test result. The LR values are calculated using the sensitivity and specificity of a test. Positive LR (LR(+)) is defined as the sensitivity divided by 100% – specificity; the negative LR (LR(−)) is defined as 100% – sensitivity divided by specificity. Note that LR(+) values are numbers >1, whereas LR(−) values are fractions <1. To illustrate the effects of introducing ranges instead of point estimates for these input parameters, we consider three general examples. For our purposes, uncertainty in these parameters is represented as a range of values, and we simplify the approach by considering the boundary values of the ranges in our propagation calculations (ie, no distribution of values is imposed within the range). Thus, the term “uncertainty” refers specifically to the width of the range; a point estimate would have no uncertainty by this definition.
Figure 1A shows uncertainty isolated to the pre-TP: the edges of a pre-TP range are projected through a point estimate for LR(+). This projection yields a wider disease probability range in the post-TP projection, compared with the initial pre-TP uncertainty range. This is consistent with the idea that uncertainty in disease probability can propagate or grow in the setting of an unexpected test result (such as that shown here, with a positive test result despite a low pre-TP estimate). In Figure 1B, uncertainty is considered only in the LR value: a point estimate of pre-TP is projected through a range of LR(+) values (10 ± 5). This projection shows how uncertainty in the LR converts a point estimate of pre-TP into a range of post-TP values. Figure 1C shows uncertainty in both steps: the pre-TP (10% ± 5%) and the LR (10 ± 5) uncertainties combine to create even greater potential uncertainty in the post-TP of disease. In this example, to determine the post-TP range, the lower limit of the pre-TP range (5%) is projected through the lower limit of the LR range (5), and the upper limit of the pre-TP range (15%) is projected through the upper limit of the LR range (15), yielding the large post-TP range.
In summary, Figure 1 illustrates how uncertainty at the first step (pre-TP), second step (observing a test result), or both of these steps, in the process of using Bayes’ theorem in diagnostic test interpretation. Propagation is most prominent when tests are unexpected compared with the pre-TP.
Uncertainty in the LR: Impact on Post-TP Uncertainty
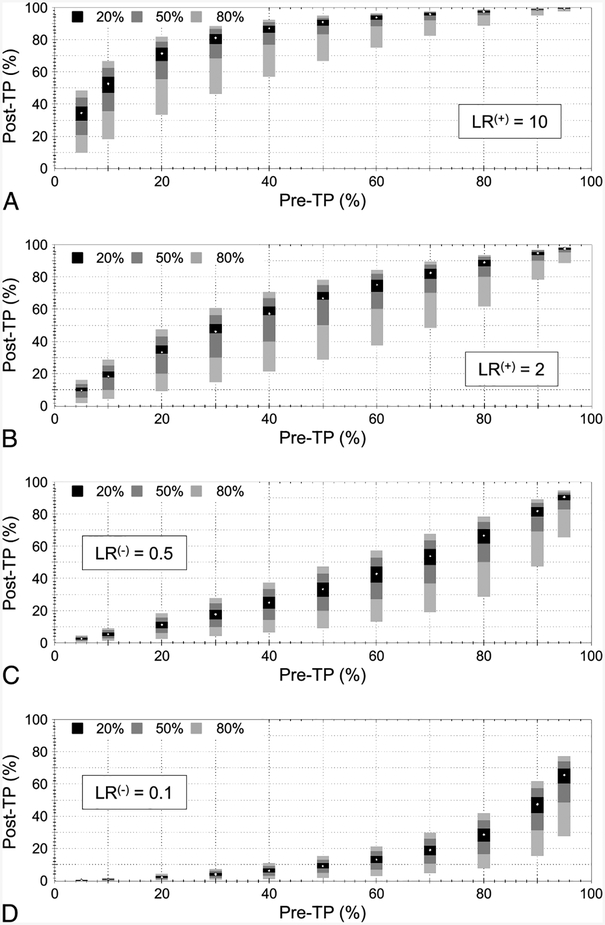
To investigate systematically the impact of LR uncertainty on the post-TP, we projected a variety of pre-TP point estimates through multiple LR ranges. We considered LR(+) values of 10 (Fig. 2A), and 2 (Fig. 2B), with uncertainty ranges of ±20%, ±50%, and ±80% relative to each LR value. The stacked bars indicate the projected post-TP ranges (Y-axis) calculated from each of the three ranges of LR uncertainty. This was performed across 11 pre-TP point estimates (X-axis). Similar examples are shown for LR(−) values of 0.5 (Fig. 2C) and 0.1 (Fig. 2D). Several features are evident in these plots. First, ceiling and floor effects occur in the magnitude and asymmetry of the projected uncertainty in post-TP. For example, the combination of higher pre-TP (>50%) and a positive test result (Fig. 2A, B) yields smaller uncertainty ranges, with asymmetry favoring extension downward. Conversely, when the pre-TP was lower (<50%) and a negative test result occurred (Fig. 2C, D), the floor effect can be seen. This observation is consistent with the intuitive idea that uncertainty grows when a test result disagrees with the clinical suspicion (ie, the result is unexpected). Second, the post-TP uncertainty range is not symmetric around the reference point-estimate post-TP values that one would obtain if LR uncertainty were ignored. This is the result of the nonlinear relation between pre-TP and LR to post-TP (note the nonlinear axes in Fig. 1). Third, post-TP uncertainty is nonlinear because the magnitude of post-TP ranges are larger comparing LR uncertainty ranges of ±50% to ± 80% (a 1.6-fold change) than comparing ±50% to ±20% (a 2.5-fold change).
Fig. 2.
Uncertainty in posttest probability (post-TP) owing to uncertainty in the likelihood ratio (LR). Three ranges of LR uncertainty are considered: ±20%, ±50%, and ±80%. In each panel, 11 pretest probability (pre-TP) point estimates are considered (X-axis). Test results included LR(+) values of 10 (A) and 2 (B), and LR(−) values of 0.5 (C) and 0.1 (D). The white point in the center of each stacked vertical bar is the post-TP corresponding to a point estimate of LR, whereas the solid bars represent the uncertainty range in pre-TP corresponding to LR ranges of ±20% (black), ±50% (dark gray), and ±80% (light gray).
In summary, the concept of propagation of uncertainty in Bayesian reasoning is relevant to unexpected test results. In contrast, when test results agree with expectations (expressed by the pre-TP), even large range uncertainty in the LR values is less problematic.
Uncertainty in Sensitivity and Specificity: Impact on LR Uncertainty
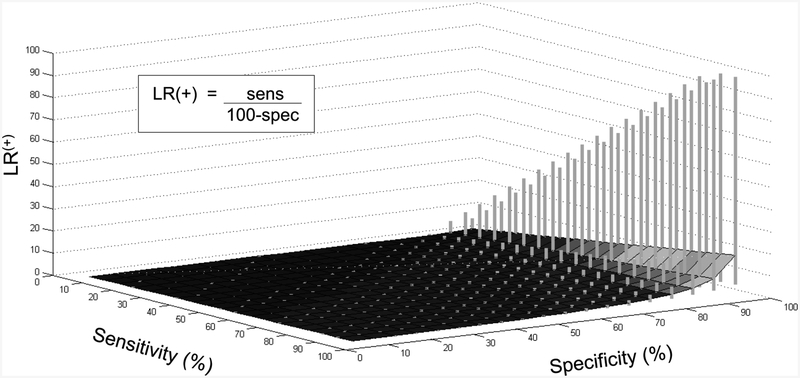
We sought to determine how uncertainty in the component sensitivity and specificity values affect LR uncertainty. In Figure 3, we calculated LR(+) ranges based on a range of ±10% applied to both the sensitivity and the specificity values. The contour is defined by the calculations assuming point estimates of both parameters, and the vertical bars represent the upper and lower limits of the projected LR uncertainty. It is clear, as expected, that uncertainty in the specificity term has a greater impact on the resulting LR(+) range than uncertainty in sensitivity (the opposite is true for LR(−), data not shown). In fact, uncertainty of ±10% (or even ±20%; data not shown) in only the sensitivity has little impact on the LR(+) uncertainty. Given ±10% uncertainty in both sensitivity and specificity, the range of the calculated LR values remains relatively modest until specificity reaches approximately 85%, with a steep increase in propagated LR(+) uncertainty at ≥90%. This pattern of rapid increase in (particularly the upper bound of) LR uncertainty owes to the presence of the specificity term in the denominator: as specificity approaches 100%, the ratio grows rapidly.
Fig. 3.
Uncertainty in LR owing to uncertainty in sensitivity and specificity. Sensitivity (Y-axis) and specificity (X-axis) contribute to the positive likelihood ratio (LR(+)) value (Z-axis), defined as shown in the inset. The contour surface represents the LR value calculated from the corresponding point estimates for sensitivity and specificity. The vertical gray bars represent the range in LR(+) values obtained when considering ±10% uncertainty in the sensitivity and specificity. The “clipping”seen at the highest ranges of LR uncertainty occur because values were truncated at 99.0%.
The published literature is diverse in its reporting of sensitivity and specificity, with ranges that may be expressed as standard deviation, standard error of the mean, or 95% confidence intervals (CIs). For simplicity, we can consider two common tests: serum D-dimer in the evaluation of possible pulmonary embolism20 and exercise echocardiography in the evaluation of possible ischemic coronary artery disease.21 For the endpoint of pulmonary embolism, D-dimer has a reported sensitivity of 95%, with a 95% CI of 90% to 98%, and a specificity of 45%, with a 95% CI of 38% to 52%. Clearly, the sensitivity is stronger than the specificity, and this contributes to a stronger LR(−) value, which is calculated using the point estimates of sensitivity and specificity as follows: (100 – 95)/45 = 0.11. Considering the CI for sensitivity, we find that the LR(−) could be as weak as 0.22 (using the lower limit of 90% sensitivity) or as strong as 0.044 (using the upper limit of 98% sensitivity); that is, the strength of “rule out” power of the D-dimer could span a nearly 5-fold range. Although one would in theory like to use the D-dimer to rule out pulmonary embolism, one must be prepared to interpret the unexpected positive test result, which is bound to occur in a minority of patients with baseline low pulmonary embolism probability.
If we consider exercise echocardiography for detecting cardiac ischemia, then the sensitivity is 85% (95% CI 83%–87%), and the specificity is 77% (95% CI 74%–80%). The LR(−) based on the point estimates is (100 – 85)/77 = 0.19. The LR(−) could be as strong as 0.17 using the upper limit of sensitivity or as weak as 0.22 using the lower limit. In this case, two features led to less projected uncertainty: the relatively low point estimate (ranges expand dramatically above the approximately 90% range; Fig. 3) and the relatively small CI. If this same range, 4%, spanned from 95% to 99% for sensitivity, the test would be much stronger in terms of LR(−), but the uncertainty in the actual LR(−) would be large compared to the 83% to 87% range: LR(−) could be as strong as 0.13 or as weak as 0.65 (a 5-fold range). Thus, stronger tests may paradoxically be more susceptible to the impact of range uncertainty.
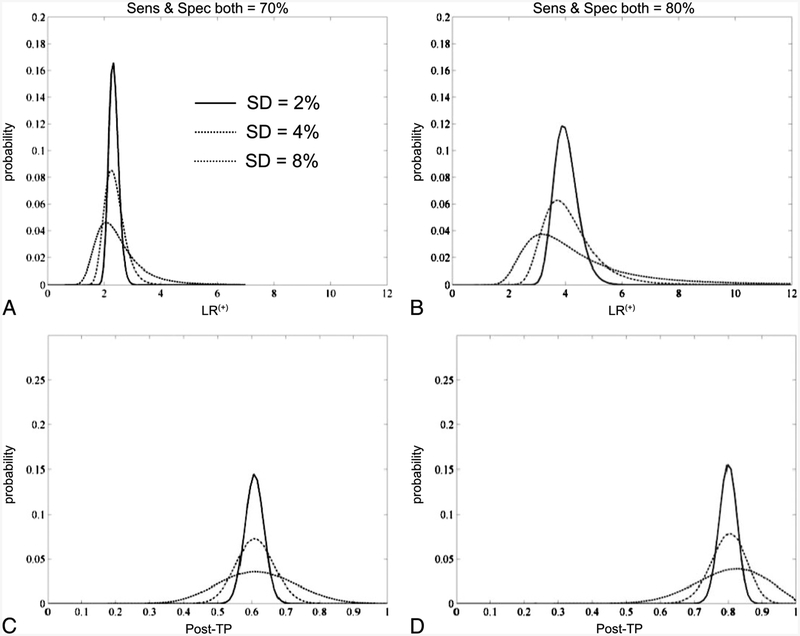
To illustrate the propagation of sensitivity and specificity values into the calculation of LR(+) values, we also performed Monte Carlo simulations (Fig. 4). Two hypothetical tests were considered, with sensitivity and specificity values each of 70% or 80%. Random samples of each test parameter taken from normal distributions spanning 2%, 4%, or 8% standard deviations were then collected to plot the distribution of LR values in each case. Note that the variance around the LR(+) value increases, as expected, with increasing uncertainty surrounding the component sensitivity and specificity values. Next, we used these LR(+) distributions to determine the post-TP distribution given a point estimate of 20% pre-TP, that is, for unexpected positive test results. These results illustrate the plausible intervals associated with uncertainty at the level of component sensitivity and specificity values.
Fig. 4.
Uncertainty modeled with Monte Carlo simulations. Two hypothetical tests with sensitivity and specificity values of 70% each (A) or 80% each (B) are shown with uncertainty around these values expressed as normal distributions with standard deviations of 2%, 4%, or 8%. The X-axis in these panels represents the resulting positive likelihood ratio (LR(+)) values when calculated based on random draws from the sensitivity and specificity distributions. The Y-axis represents the probability of observing any given LR(+) value. The warping of the resulting LR(+) value distribution is attributed to the nonlinear aspect of Bayes’ theorem. C, The resulting posttest probability (post-TP) after applying the LR(+) values of A to a point estimate of pre-TP = 20%. D, The same process, using the test in B.
Uncertainty in Both Pre-TP and in LR: Combined Error Propagation to the Post-TP
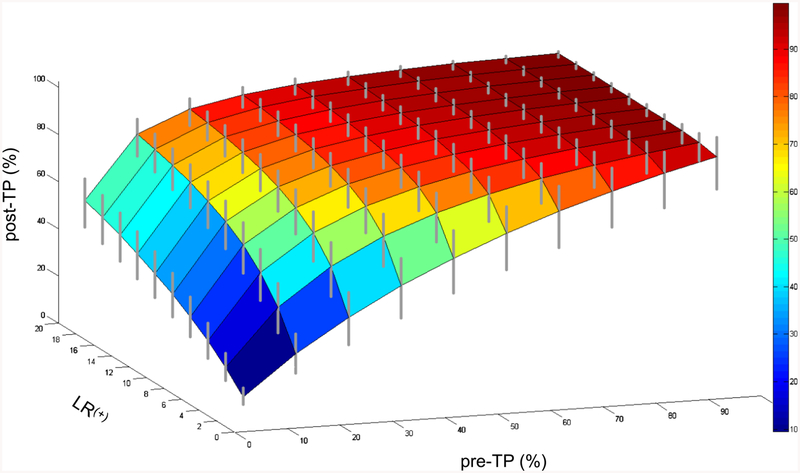
Finally, we investigated the most clinically relevant situation: uncertainty in both the pre-TP and the LR values (Fig. 5). Here, we held the LR uncertainty at the moderate range of ±20% and considered a single range of relative pre-TP uncertainty, ±20%. The contour surface shows the projection of pre-TP point estimates through LR(+) point estimates; the vertical bars show the post-TP range when ±20% uncertainty is included in the pre-TP and in the LR(+). Similar to the plots in Figure 2, the ceiling effect at high pre-TP and the asymmetry of the expanded ranges (vertical bars stretch farther below than above the point estimate contour) are again present, and were even more prominent with 50% uncertainty ranges for pre-TP (data not shown). Analogous observations occur when considering 20% uncertainty in pre-TP and in LR(−) (data not shown). The inclusion of uncertainty in both parameters leads to a modest uncertainty range in the post-TP. Although the relevance of any particular uncertainty range will depend strongly on the clinical scenario and threshold boundaries for further testing and/or treatment, these results provide some framework for incorporating uncertainty into diagnostic reasoning.
Fig. 5.
Uncertainty in posttest probability (post-TP) owing to uncertainty in both the pretest probability (pre-TP) and the likelihood ratio (LR). The pre-TP (X-axis) and LR (Y-axis) contribute to the post-TP (Z-axis). The contour surface is formed by the point estimates of pre-TP and LR values, yielding point estimates of post-TP. The gray vertical bars represent the range of post-TP uncertainty obtained when the LR uncertainty is ±20% and the pre-TP uncertainty is ±20%.
Discussion
This study extends our prior work on uncertainty in Bayesian diagnostic test result interpretation, which considered uncertainty only in the pre-TP estimates, mapped through point estimates of LR. In the present study, we explored uncertainty in additional settings: the impact of uncertainty in sensitivity and specificity on uncertainty in the calculated LR, and the impact of uncertainty in LR—alone and in combination with pre-TP uncertainty—on the uncertainty in the resulting post-TP of disease. The error propagation patterns provide a frame-work for understanding how Bayesian diagnostic interpretation handles uncertainty in its component values, thereby offering practical guidance for use of the Bayes strategy in the realistic settings of clinical uncertainty at each step of the strategy. One of the key points of vulnerability appears to be in the error propagation of uncertainty surrounding high specificity values in the calculation of LR(+) and for high sensitivity values in the calculation of LR(−). In other words, uncertainty in the component sensitivity and specificity values is of greatest concern for high-performance tests.
Different Types of Uncertainty
The concept of uncertainty is simplified in this article to mean a range of possible values. In principle, one could consider any imposed distribution within the range of uncertainty, such as a normal or skewed distribution, depending on the clinical context and particular goal of such modeling. This may be useful for formal decision modeling purposes, for the purpose of a generally accessible framework; and the difficulty in translating subjective uncertainty into probability distributions, we limited the scope here to the uniform distribution assumption. As such, our consideration of the endpoints of the range is computationally convenient and facilitates visualization of how uncertainty propagates through the process of Bayesian reasoning in diagnostic test interpretation. Although one can imagine numerous sources of uncertainty in the estimation of pre-TP (eg, uncertainty in demographics, patient history, physician knowledge, outside records), the current framework provides some perspective on how this uncertainty will propagate, particularly if an unexpected result occurs. Uncertainty at the levels of sensitivity and specificity also has multiple potential sources, including experimental error in assay development, uncertainty in the gold standard against which the assay is developed, and/or variability in disease severity or control group characteristics. Our results imply that this is a potentially vulnerable point in error propagation, especially for calculating the LR(+) uncertainty when specificity is >90% and for LR(−) uncertainty when sensitivity is >90%.
Addressing Unexpected Test Results
When test results agree with our clinical suspicion (eg, a positive test result in the setting of high pre-TP of disease), there is little need for formal probability theory to quantify how much more certain we are of a patient’s disease status; however, it is the circumstance of unexpected test results that presents an important challenge: the negative stress echocardiogram in the high-risk cardiovascular patient or the positive D-dimer in a patient judged to be at low risk for venous thromboembolism. These are the circumstances in which a Bayesian approach to diagnostic interpretation can be helpful: given some estimation of clinical impression (the pre-TP) and some estimation of the test characteristics (sensitivity and specificity), is the test powerful enough for unexpected results to be considered seriously versus dismissed as a false-positive (or a false-negative) result? Our prior work demonstrated, somewhat unexpectedly, that in such circumstances, one cannot simply rely on better tests to compensate for uncertainty in the pre-TP. This is because an unexpected result can cause even greater expansion of the post-TP range of disease for an accurate test compared with a weaker test.19 The present study indicates that the error propagation associated with ranges of pre-TP, sensitivity, specificity, and LR also are most evident in the setting of unexpected test results. The key challenge for the clinician is to decide, ideally guided by sound Bayesian reasoning, whether the unexpected result should be considered a false finding or if the pre-TP was inappropriately judged.
Conclusion
Reducing uncertainty in test characteristics largely depends on assay development, whereas reducing uncertainty in the pre-TP involves a spectrum from personal experience to formal epidemiology studies. Although point estimates of these parameters simplify the implementation of Bayesian reasoning in test result interpretation, it is important to recognize the nonlinear aspects of error propagation. In this fashion, one can critically evaluate not only the reported sensitivity, specificity, and prior probability data from the literature but also the certainty with which these estimates are presented.
Key Points.
Traditional teaching of Bayesian diagnostic test interpretation uses point estimates for sensitivity, specificity and pretest probability, yet these building blocks are rarely known with certainty.
Uncertainty in these parameters is a major challenge to implementation of Bayes’ theorem in clinical practice.
Uncertainty propagates from sensitivity and specificity to the likelihood ratio, resulting in expanded posttest probability ranges.
Uncertainty propagates to a larger extent when the diagnostic test result is unexpected relative to the pretest probability.
The results provide a framework to incorporate ranges or intervals, representing uncertainty, into the building blocks of Bayesian diagnostic reasoning.
Acknowledgment
The authors thank Mr Nathaniel Eiseman for valuable discussions and comments on the manuscript.
M.T.B. received funding from the Department of Neurology, Massachusetts General Hospital, and the Clinical Investigator Training Program: Harvard/Massachusetts Institute of Technology Health Sciences and Technology-Beth Israel Deaconess Medical Center, in collaboration with Pfizer, Inc. and Merck & Co. The other authors have no financial relationships to disclose and no conflicts of interest to report.
References
- 1.Gallagher EJ. Clinical utility of likelihood ratios. Ann Emerg Med 1998;31:391–397. [DOI] [PubMed] [Google Scholar]
- 2.Halkin A, Reichman J, Schwaber M, et al. Likelihood ratios: getting diagnostic testing into perspective. Q J Med 1998;91:247–258. [DOI] [PubMed] [Google Scholar]
- 3.Dolan JG, Bordley DR, Mushlin AI. An evaluation of clinicians’ subjective prior probability estimates. Med Decis Making 1986; 6: 216–223. [DOI] [PubMed] [Google Scholar]
- 4.Lyman GH, Balducci L. Overestimation of test effects in clinical judgment. J Cancer Educ 1993;8:297–307. [DOI] [PubMed] [Google Scholar]
- 5.Lyman GH, Balducci L. The effect of changing disease risk on clinical reasoning. J Gen Intern Med 1994;9:488–495. [DOI] [PubMed] [Google Scholar]
- 6.Noguchi Y, Matsui K, Imura H, et al. Quantitative evaluation of the diagnostic thinking process in medical students. J Gen Intern Med 2002;17:839–844. [DOI] [PMC free article] [PubMed] [Google Scholar]
- 7.Heller RF, Sandars JE, Patterson L, et al. GPs’ and physicians’ interpretation of risks, benefits and diagnostic test results. Fam Pract 2004;21:155Y–159. [DOI] [PubMed] [Google Scholar]
- 8.Elstein AS. Heuristics and biases: selected errors in clinical reasoning. Acad Med 1999;74:791–794. [DOI] [PubMed] [Google Scholar]
- 9.Richardson WS. Five uneasy pieces about pre-test probability. J Gen Intern Med 2002;17:882–883. [DOI] [PMC free article] [PubMed] [Google Scholar]
- 10.Cahan A, Gilon D, Manor O, et al. Probabilistic reasoning and clinical decision-making: do doctors overestimate diagnostic probabilities? Q J Med 2003;96:763–769. [DOI] [PubMed] [Google Scholar]
- 11.Attia JR, Nair BR, Sibbritt DW, et al. Generating pre-test probabilities: a neglected area in clinical decision making. Med J Aust 2004;180: 449–454. [DOI] [PubMed] [Google Scholar]
- 12.Ghosh AK, Ghosh K, Erwin PJ. Do medical students and physicians understand probability? Q J Med 2004;97:53–55. [DOI] [PubMed] [Google Scholar]
- 13.Boyko EJ. Ruling out or ruling in disease with the most sensitive or specific diagnostic test: short cut or wrong turn? Med Decis Making 1994;14:175–179. [DOI] [PubMed] [Google Scholar]
- 14.Pewsner D, Battaglia M, Minder C, et al. Ruling a diagnosis in or out with “SpPIn” and “SnNOut”: a note of caution. BMJ 2004;329: 209–213. [DOI] [PMC free article] [PubMed] [Google Scholar]
- 15.Phelps MA, Levitt MA. Pretest probability estimates: a pitfall to the clinical utility of evidence-based medicine? Acad Emerg Med 2004;11:692–694. [PubMed] [Google Scholar]
- 16.Linn S, Grunau PD. New patient-oriented summary measure of net total gain in certainty for dichotomous diagnostic tests. Epidemiol Perspect Innov 2006;3:11. [DOI] [PMC free article] [PubMed] [Google Scholar]
- 17.Baron JA. Uncertainty in Bayes. Med Decis Making 1994;14:46–51. [DOI] [PubMed] [Google Scholar]
- 18.Bianchi MT, Alexander BM. Evidence based diagnosis: does the language reflect the theory? BMJ 2006;333:442Y445. [DOI] [PMC free article] [PubMed] [Google Scholar]
- 19.Bianchi MT, Alexander BM, Cash SS. Incorporating uncertainty into medical decision making: an approach to unexpected test results. Med Decis Making 2009;29:116–124. [DOI] [PubMed] [Google Scholar]
- 20.Segal JB, Eng J, Tamariz LJ, et al. Review of the evidence on diagnosis of deep venous thrombosis and pulmonary embolism. Ann Fam Med 2007;5:63–73. [DOI] [PMC free article] [PubMed] [Google Scholar]
- 21.Fleischmann KE, Hunink MG, Kuntz KM, et al. Exercise echocardiography or exercise SPECT imaging? A meta-analysis of diagnostic test performance. JAMA 1998;280:913–920. [DOI] [PubMed] [Google Scholar]


