

Abstract
Whole-cell voltage and current recordings were obtained from red and green cone photoreceptors in isolated retina from macaque monkey. It was demonstrated previously that the cone photovoltage is generated from two sources, phototransduction current in the cone outer segment and photocurrent from neighboring rods. Rod signals are likely transmitted to cones across the gap junctions between rods and cones. In this study, the “pure” cone and rod components of the response were extracted with rod-adapting backgrounds or by subtracting the responses to flashes of different wavelength equated in their excitation of either rods or cones. For dim flashes, the pure cone component was similar in waveform to the cone outer segment current, and the rod component was similar to the photovoltage measured directly in rods. With bright flashes, the high frequencies of the rod signal were filtered out by the rod/cone network. The two components of the cone photovoltage adapted separately to background illumination. The amplitude of the rod component was halved by backgrounds eliciting ∼100 photoisomerizations sec−1 per rod; the cone component was halved by backgrounds of 8700 photoisomerizations sec−1 per cone. Coupling between rods and cones was not modulated by either dim backgrounds or dopamine. Voltage noise in dark-adapted cones was dominated by elementary events other than photopigment isomerizations. The dark noise was equivalent in magnitude to a steady light eliciting ∼3800 photoisomerizations sec−1 per cone, a value significantly higher than the psychophysical estimates of cone “dark light.”
Keywords: rod, cone, photoreceptor, primate, adaptation, coupling
Certain aspects of human vision, such as color sensitivity, are determined by the process of light absorption and phototransduction in cone outer segments (Baylor et al., 1987; Schnapf et al., 1987). But other aspects of vision, such as temporal sensitivity and light adaptation, cannot be explained by properties of the outer segment and must therefore be determined principally by processes downstream (Schnapf et al., 1990). The first downstream locus of signal processing in the retina is the photoreceptor inner segment. Here the photocurrent is shaped by voltage-activated conductances (Barnes, 1994) and combined with synaptic inputs from neighboring neurons (Baylor et al., 1971). The purpose of the present work was to understand how the cone inner segment modifies the photocurrent and how these modifications affect vision. To address these questions, we recorded photovoltage from cone inner segments in freshly isolated retina from macaque monkeys.
Psychophysicists describe two distinct retinal mechanisms by which rod signals are processed in parallel. One mechanism is slow and sensitive to dim light, and the second is faster and operates at mesopic light levels (Conner and MacLeod, 1977; Conner, 1982). It has been suggested that the rod-to-bipolar synapse connects rods to the more sensitive mechanism and that gap junctional coupling between rods and cones connects rods to the second mechanism (Raviola and Gilula, 1973; Smith et al., 1986). This role for gap junctions is supported by two recent physiological findings: cones in the macaque retina hyperpolarize in response to light absorption in neighboring rods (Schneeweis and Schnapf, 1995), and H1 horizontal cells in macaque retina receive rod input indirectly through cones (D. Dacey, personal communication). To understand how the physiological and psychophysical properties of the rod/cone pathway are related, we studied the magnitude and time course of the rod contribution to the cone photovoltage, the effect of rod coupling on cone spectral sensitivity, and the extent to which coupling is altered by light adaptation and pharmacological agents.
Under photopic (cone-mediated) conditions, human subjects can reliably detect a flash of light that elicits <50 photoisomerizations per cone (Hood and Finkelstein, 1986; Schnapf et al., 1990). Key properties of the visual system that determine the lower bound of detection are the size and shape of the electrical response to a photon and electrical noise. A further objective of this study therefore was to characterize these properties in cones and to relate them to visual detection in humans.
MATERIALS AND METHODS
Preparation and solutions. Eyes were obtained from 10 cynomologus monkeys (Macaca fascicularis) and 4 rhesus monkeys (Macaca mulatta). No differences were found in the physiology of the cones obtained from the two species. At least 30 min before enucleation, an opaque black occluder was placed over the cornea of a monkey under general anesthesia. Retinal pieces were isolated and stored in L-15 medium (Life Technologies, Gaithersburg, MD) at 4°C for up to 3 d. Details of the surgery and dissection are given inSchneeweis and Schnapf (1995).
A piece of retina ∼3 × 3 mm2 was isolated from the pigment epithelium and placed receptor side up in a recording chamber perfused with bicarbonate-buffered Locke’s solution equilibrated with 95% O2/ 5% CO2 and kept at 37°C. The recording solution contained (in mm): NaCl (120); NaHCO3 (20); KCl (3.6); CaCl2(1.2); MgCl2 (2.4); HEPES buffer (3), pH 7.4;d-glucose (10); EDTA (0.02); and Basal Medium Eagle amino acids and vitamins (Life Technologies).
Photovoltage recordings from red and green cones were obtained by the perforated-patch method (Horn and Marty, 1988). The patch electrode solution contained (in mm): potassium gluconate (130); KCl (10); MgCl2 (3); ATP·Na2 (3); GTP·Na3 (1); HEPES buffer (10), pH 7.25; and amphotericin (0.13).
Light stimuli. Cones were stimulated with unpolarized light incident approximately parallel to the long axis of the outer segments. Wavelength was regulated with interference filters of 10 nm nominal half-bandwidth. Intensity was controlled with calibrated neutral density filters. The flash stimulus was a circular spot 180 μm in diameter. Flash duration was 10 msec. In adaptation experiments, the background diameter was 310–800 μm.
The number of photoisomerizations per flash was calculated from the product of the flash photon density and the photoreceptor collecting area. Except where noted, the collecting area was assumed to have peak values of 0.6 μm2 for cones and 1 μm2 for rods (Schneeweis and Schnapf, 1995), with corresponding values for 500 and 660 nm light of 0.312 and 4.14 × 10⁻² (red cones), 0.542 and 4.02 × 10⁻³ (green cones), and 1.0 and 2.63 × 10⁻⁴ (rods). These values (in μm2) were based on the action spectra measured with suction electrodes (Baylor et al., 1984, 1987; Kraft et al., 1993). The correction for photopigment self-screening that arises with axial illumination of the outer segment was made assuming that the peak axial optical density was 0.35 for rods and 0.17 for cones (Baylor et al., 1984; 1987). For comparison with psychophysical studies, it was assumed that 1 troland (td) at 560 nm corresponds to 14 photoisomerizations sec−1 for red and green cones (Schnapf et al., 1990).
Electrical recording. Signals were recorded with an Axopatch 2D amplifier (Axon Instruments, Foster City, CA), filtered by the Axopatch four- pole Bessel analog filter, and in some cases refiltered by a Gaussian digital filter. Phase delays resulting from filtering were taken into account. Membrane potentials were corrected for the electrode junction potential. Unless otherwise stated, voltage signals were recorded with the amplifier in current-clamp mode. In some cases, photocurrent was recorded with the same electrode configuration and with the amplifier in voltage-clamp mode.
Noise analysis. For characterizing the power spectral density of the membrane voltage fluctuations, voltage recordings were low-pass filtered with the Axopatch Bessel filter and with an additional eight-pole Bessel filter (Frequency Devices, Haverhill, MA). The cutoff frequency of both filters was set at 200 Hz, giving an effective cutoff of ∼140 Hz. Records were digitized at a sampling rate of 1 kHz.
Power spectra were computed using Fourier transform routines from the software package Igor (WaveMetrics, Lake Oswego, OR). Digitized records of ∼12.3 sec were divided into overlapping segments of 2048 points each, and each segment was multiplied by a Hanning window. Power spectra were computed for each segment and then averaged. Spectra from multiple 12.3 sec sweeps were then averaged together to obtain the final spectrum.
Because the noise spectra reported here are not difference spectra, it was important to ascertain whether the electronics of the recording configuration or the experimental conditions introduced artifactual features into the spectra. Voltage noise spectra were obtained under approximate experimental conditions from voltages measured across a 100 MΩ resistor, from high-resistance electrodes (>100 MΩ), and from the model cell accompanying the Axopatch 2D amplifier. In the range of 0.9–200 Hz, there was good agreement between the measured spectra and that expected for Johnson voltage noise:N(f) = 4kTRe{Z}, whereN(f) is the power spectral density of the noise, k is Boltzman’s constant, Tis temperature, and Re{Z} is the real part of the electrical impedance Z.
RESULTS
The cone inner segment shapes the photovoltage
In cones of cold-blooded vertebrates, the photovoltage is shaped by voltage-dependent conductances residing in the inner segment (Barnes, 1994), and a similar role is predicted for conductances identified in primate cones (Yagi and MacLeish, 1994). To test this prediction, we presented brief flashes of light and recorded the photovoltage. The wavelength of the stimulus was chosen to minimize the contribution of rods, and the size of the stimulus was small enough to exclude a contribution from horizontal cells. In a small number of cones tested, neither an increase in the size of the test flash from 180 to 310 μm in diameter (data not shown) nor the application of 0.5 mm CoCl2 (see Fig. 11) altered the waveform of the response, consistent with an absence of a horizontal cell contribution.
Fig. 11.
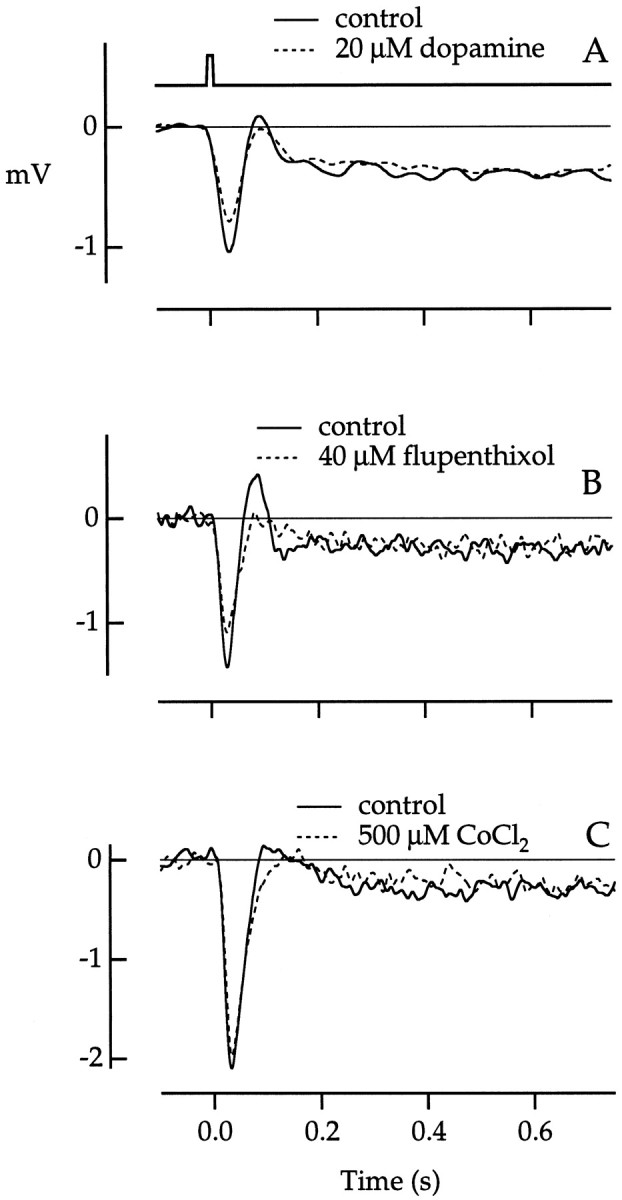
Effect of pharmacological agents on rod/cone coupling. A, Responses in a red cone to 500 nm test flashes in control medium (solid line) or in 20 μm dopamine (dashed line) 4–7 min after the onset of dopamine application. Flash strength was 625 photons μm−2. Traces are averages of 7 or 10 responses. Bandwidth, DC–40 Hz. B, Responses in a green cone to 500 nm test flashes in control medium (solid line) or in 40 μm flupenthixol, a D1/D2 dopamine antagonist (dashed line), 6–8 min after the onset of flupenthixol application. Flash strength was 726 photons μm−2.Traces are averages of 6 or 8 responses. Bandwidth, DC–40 Hz. C, Responses in a green cone to 500 nm test flashes in control medium (solid line) or in 0.5 mm CoCl2 (dashed line) 1–3 min after the onset of CoCl2 application. Flash strength was 1288 photons μm−2. Traces are averages of 8 or 20 responses. Bandwidth, DC–50 Hz. Flash duration was 10 msec. The flash monitor in A applies to all responses.
The photovoltage response to a dim brief flash was diphasic (Fig.1) and could be fitted by the same kinetic equations (see Fig. 16) found to describe the outer segment photocurrent [Schnapf et al. (1990), their Eq. 7]. Responses of red and green cones were indistinguishable. The photovoltage was slightly faster than the photocurrent, rising to a peak in 32 ± 7 msec (mean ± SD; n = 21) compared with an average of 54 msec for the photocurrent (Schnapf et al., 1990). This difference was not likely caused by differences in experimental conditions. For four cones in which both photovoltage and photocurrent were measured with the patch electrode, the peak of the voltage response came 3–14 msec sooner than did the peak current response.
Fig. 1.

Photovoltage and photocurrent responses to 660 nm flashes. A, Photovoltage of a red cone receiving minimal rod input. Traces are averages of 1–11 responses. Flash strength ranged from 3.68 × 10³ to 2.96 × 10⁶ photons μm−2. Voltage was recorded with a patch electrode; the outer segment was illuminated axially with unpolarized light. B, Photocurrent of a different red cone. Traces are averages of 2–11 responses. Flash strength ranged from 3.36 × 10³ to 6.23 × 10⁵photons μm−2. Current was recorded with a suction electrode (Baylor et al., 1987); the outer segment was illuminated transversely with polarized light. The cone collecting area inB was 4.28 × 10⁻²μm2. Flash duration was 10 msec. The stimulus monitor is shown between A and B. Bandwidth, DC–100 Hz.
Fig. 16.

Dark noise and single photon responses in a green cone (A–C) and a red cone (D–F). A,D, Representative voltage records in the dark. Bandwidth, DC–140 Hz. B, E, Average voltage responses to 660 nm flashes, divided by the expected number of photoisomerizations per flash. Bandwidth, DC–100 Hz. The number of responses averaged and the photoisomerizations per flash are 12 and 205 in B and 11 and 153 in E. Smooth curves are least-squares fits of the responses to Equation 7 from Schnapf et al. (1990). Values of fitted parameters in the equation in B and E, respectively, are as follows: τr, 22 and 23 msec; τd, 120 and 71 msec; τp, 171 and 294 msec; and φ, 42 and 38°. Flash duration was 10 msec. Flash monitors are shownabove the responses. C, F, Power spectral density of the dark voltage noise (•), averaged from 11 spectra in C and 8 in F. The noise spectra predicted for spontaneous isomerizations (○) are the magnitude-squared Fourier transforms of the smooth curves in B and E, scaled to match the peak dark noise spectrum. Scaling factors correspond to isomerization rates of 13,000 sec−1 inC and 12,000 sec−1 inF.
The overall durations of the current and voltage responses were similar, as quantified by the “integration time” of the cone (the time integral of the normalized dim-flash response). In a collection of 17 cones, the integration time of the photovoltage response was 25 ± 7 msec (n = 17), similar to the mean of 24 msec found for the photocurrent (Schnapf et al., 1990). The time window over which photons can effectively sum their signals can be predicted from the time integral of the initial hyperpolarizing component of the normalized flash response. This integral is closely related to the “critical duration” of photopic vision characterized in psychophysical experiments. The integration time of the initial component was 40 ± 8 msec (n = 17), similar to the mean of 50 msec for the photocurrent and approximately one-half the value expected from the psychophysics (see Discussion).
With brighter flashes, prominent differences in the photocurrent and photovoltage were observed. In contrast to that of the photocurrent, the time to the peak of the photovoltage shortened dramatically with increasing flash strength. For the brightest flashes, a prominent initial voltage transient was seen that was absent in the photocurrent (see Figs. 1, 4). These differences between photovoltage and photocurrent were expected from the activation of voltage-dependent conductances identified in macaque cones (Yagi and MacLeish, 1994).
Fig. 4.

Rod input visualized in whole-cell voltage clamp.A, B, Photocurrent responses of a red cone to flashes of increasing strength at wavelengths of 500 nm (A) and 660 nm (B). Flash photon densities increased by a factor of approximately two betweentraces and ranged from 160 to 1380 photons μm−2 in A and from 1410 to 12,100 photons μm−2 in B. Flash duration was 10 msec. The flash monitor is shown between A andB. Current traces plot averages of two or three responses. Bandwidth, DC–20 Hz.
Rods influence the response waveform and spectral sensitivity of cones
Another conspicuous difference between the outer segment photocurrent and the photovoltage was wavelength dependence. The waveform of the photocurrent depended on the quantity but not the wavelength of photons absorbed (Baylor et al., 1987), whereas the waveform of the photovoltage varied with wavelength because of the input of rod signals (Schneeweis and Schnapf, 1995). This is evident for the cone illustrated in Figure 2, in which responses of <1 mV peaked in ∼40 msec for 660 nm flashes but in 160 msec for 500 nm flashes. Bright flashes of either wavelength evoked responses that appeared to have both fast and slow components.
Fig. 2.

Dependence of response waveform on wavelength.A, B, Superimposed responses of a red cone to flashes of increasing strength at wavelengths of 500 nm (A) and 660 nm (B).Vertical lines indicate the time points at which response amplitudes were measured for plots shown below (see Fig. 3, 18 and 400 msec). Flash photon densities increased by a factor of approximately four between traces and ranged from 8 to 3.07 × 10⁴ photons μm−2at 500 nm and from 5.55 × 10³ to 1.39 × 10⁶ photons μm−2 at 660 nm. Flash duration was 10 msec. The flash monitor is shownabove the voltage traces inA. Voltage traces plot averages of 1–16 responses. Bandwidth, DC–50 Hz.
If the fast and slow components of the cone photovoltage represent cone and rod contributions, respectively, then the early part of the response should reflect the spectral absorption of cone photopigment, and the late part should reflect the spectral absorption of rod photopigment. Figure 3 plots the amplitude of the responses in Figure 2 measured at the peak and at fixed early and late times. The smooth curves near the points are Michaelis–Menten functions of the form:
| Equation 1 |
where i is the flash photon density, r is the response amplitude, rmax is the maximal response amplitude, and i0 is the flash photon density that gives a response amplitude of 0.5rmax.
Fig. 3.
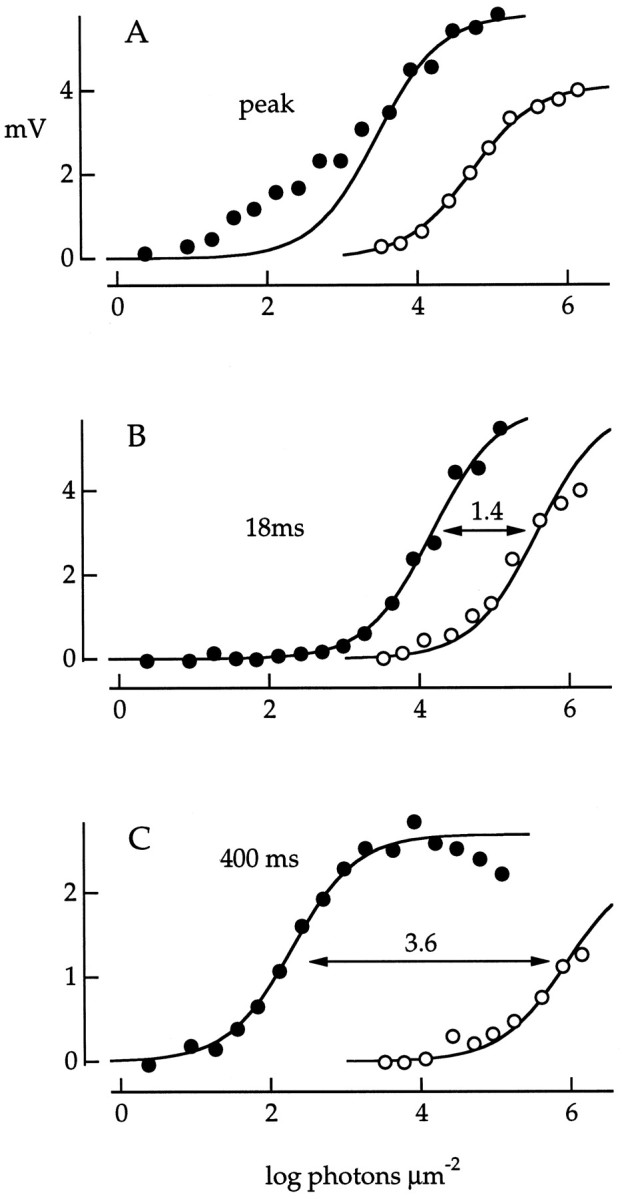
Response amplitude of a red cone plotted as a function of the log of the flash photon density for wavelengths of 500 nm (•) and 660 nm (○). Some of the flash responses are illustrated in Figure 2. A–C, Amplitudes were measured at the peak of the response (A), 18 msec after the midpoint of the flash (B), and 400 msec after the flash (C). The smooth curves are described in the Results with the following values forrmax (in mV) andi0 (in photons μm−2):A, 5.8, 3.00 × 10³ (•); 4.1, 5.28 × 10⁴ (○); B, 6.0, 1.49 × 10⁴ (•); 6.0, 3.73 × 10⁵ (○); and C, 2.7, 1.93 × 10² (•); 2.7, 8.40 × 10⁵(○). Numbers above the arrows inB and C indicate logS500/S660, the log relative sensitivity to 500 and 660 nm light, obtained from the ratio of i0 at the two wavelengths. The 500 nm curve in A was fit to response amplitudes of the six brightest flashes only.
At the late (400 msec) time point (Fig. 3C), the amplitudes at both 500 and 660 nm were reasonably well fitted by Equation 1. The separation of the two curves on the x-axis (3.64 log units) was close to the separation expected (3.58 log units) for light absorption in rods (Baylor et al., 1984). This indicated that at 400 msec, the cone photovoltage was driven solely by the photocurrent generated in neighboring rods. At the earlier (18 msec) time point (Fig. 3B), the separation of the curves (1.40 log units) was closer but not identical to the value of 0.88 log units expected for light absorption in a red cone (Baylor et al., 1987). The difference between the expected and measured values at 18 msec probably reflected a rod contribution to the cone photovoltage even at this early time point. Measurements at the response peak reflected a mixed rod and cone contribution that produced a function that varied in form with wavelength (Fig. 3A). The 500 nm curve had an additional hump at low flash strength, as expected if the response were dominated by rod input that saturated at low light levels.
Rod/cone coupling was also evident in cones recorded under whole-cell voltage clamp, as illustrated for a red cone in Figure4. Flash strengths at 500 and 660 nm were approximately matched for light absorption in the cone, but they differed in their relative effectiveness for light absorption in rods. In response to 500 nm flashes, the photocurrent displayed a long-lasting outward tail that mirrored the after-hyperpolarization of the photovoltage. The presence of this tail current under voltage clamp indicated that the current did not result from the activation of voltage-dependent conductances in the cone. The tail current had not been observed in suction electrode recordings (Baylor et al., 1987) because the high-membrane impedance of the cone outer segment restricts the flow of the rod-generated current across the cone outer segment.
The time-to-peak of the light response under voltage clamp was invariant with increasing light intensity, in contrast to the shortening of the time-to-peak of the photovoltage (Fig.1A). Thus the intensity dependence of the rise time of the photovoltage was attributable to the activation of voltage-dependent conductances as opposed to synaptically activated currents.
Coupling between red and green cones?
Gap junctions have been described between cones in primate retina (Raviola and Gilula, 1973; Tsukamoto et al., 1992). Junctions are formed indiscriminately between all neighboring cone pedicles, suggesting that cones of different spectral type may be electrically coupled to one another (Tsukamoto et al., 1992). We looked for physiological evidence of this coupling by measuring the relative sensitivity of rod and cone photovoltage to 500 and 660 nm light (S500/S660). Response amplitudes were measured at a fixed time after the flash, ∼200 msec for rods and 30 msec for cones. Relative sensitivity was assessed using the method shown in Figure 3.
Cone sensitivities fell into two groups that clustered near the predicted values for red or green cones (Fig.5). (No blue cones were encountered.) For both groups the relative sensitivity to 500 nm light was elevated compared with the value expected for pure red and green photopigment (Fig. 5, dashed lines). Measured values of logS500/S660 were 1.15 ± 0.17 and 2.47 ± 0.20 (mean ± SD), as compared with the expected values of 0.88 and 2.13 for pure red and green cones, respectively. Sensitivities for four rods on the other hand [3.60 ± 0.07 (mean ± SD)] were tightly distributed about the predicted value of 3.58 (Fig. 5, dotted line).
Fig. 5.

Spectral sensitivity of rods and cones to 500 and 660 nm light. Points plot the log of the relative spectral sensitivity to 500 and 660 nm flashes measured from 16 red cones (○), 14 green cones (▵), and 4 rods (•) at fixed times near their response peaks (30 msec for cones; 200 msec for rods). Each point was obtained from a different cell. The horizontal positions ofsymbols within each group of cells were chosen arbitrarily for clarity. The dotted line indicates the expected value for rods (3.58), and the dashed linesindicate the expected values for green cones (2.13) and red cones (0.88) if there were no interactions between photoreceptors of different spectral type (calculations described in Materials and Methods).
If red and green cones were electrically coupled, then their symbols would lie in the interval between the two dashed lines of expected cone sensitivities. Instead, the symbols for each group were displaced toward the rod value, indicating that rods added a measurable contribution to the cone photovoltage even at brief times after a flash of light. These measurements do not rule out some mixing of cone signals, but if cone–cone coupling existed, its effect on spectral sensitivity was overwhelmed by a larger rod contribution.
Estimates of the kinetics of rod and cone inputs
In retinas of cold-blooded vertebrates, rods are extensively coupled to other rods, and to a lesser extent to cones, through gap junctions (Fain, 1975; Gold and Dowling, 1979; Attwell et al., 1984;Krizaj et al., 1998). In networks of rods, signals with high-frequency components are preferentially propagated through the network (Detwiler et al., 1978; Attwell et al., 1984). Signals passing between rod–cone pairs behave similarly (Attwell et al., 1984; Wu and Yang, 1988). The following experiments were undertaken to separate out the rod and cone components of the primate cone photovoltage and to determine whether rod signals undergo any filtering as they spread into neighboring cones.
Stimulus-matching method for decomposing the cone photovoltage
The “pure” cone component of the cone photovoltage was isolated by taking the difference of responses to flashes that were equated for excitation of rods but not of cones. Figure6A shows responses to 500 and 660 nm flashes estimated to produce an equal number of photoisomerizations in rods but an unequal number in the cone. The closeness of the rod match was verified by the near coincidence of the late phase of the responses. Whereas the 660 nm response had clear rod and cone components, the 500 nm response lacked a cone component because the flash was too dim to excite cones effectively (Schnapf et al., 1990). Under these conditions, the difference of these two responses (r660 −r500) yielded an estimate of the cone component of the 660 nm response (Fig. 6B). As expected, it had a diphasic waveform characteristic of the photocurrent (Fig. 1B). Similar results were obtained from five other cones.
Fig. 6.

Average responses in a red cone to flashes of 500 and 660 nm light, with flash strength matched for rod photon capture.A, Responses to flashes of 500 nm (dashed line) and 660 nm (solid line).B, Difference response (r660− r500). Flash photon density (in photons μm−2) and the number of responses per average are 35 and 13 (500 nm) and 1.75 × 10⁵and 4 (660 nm). Flash duration was 10 msec. The flash monitor is shownabove the voltage traces inA. Bandwidth, DC–50 Hz.
In a complimentary experiment, cone-matched responses to 500 and 660 nm flashes were used to isolate the pure rod component of the cone photovoltage (Fig. 7). The response to the 660 nm flash lacked rod input because the intensity was too dim to evoke a sizable rod response at this wavelength; as expected, the slow rod tail was absent (Fig. 7A). The difference response (r500 − r660) yielded an estimate of the rod component of the 500 nm flash (Fig.7B).
Fig. 7.

Average responses in a red cone to flashes of 500 and 660 nm light of flash strength matched for cone photon capture.A, Responses to flashes of 500 nm (dashed line) and 660 nm (solid line). B. Difference response (r500 −r660). Flash photon density (in photons μm−2) and the number of responses per average are 1648 and 2 (500 nm) and 11,400 and 8 (660 nm). Flash duration was 10 msec. The flash monitor is shown abovethe voltage traces in A. Bandwidth, DC–20 Hz. (The size of the transient was verified not to be bandwidth limited.)
Was the rod signal altered by the network? To answer this, we obtained rod signals at several other flash intensities by lowering the intensity of the flash pairs in parallel and by comparing the difference responses to photovoltage responses recorded directly in rods with comparable stimuli (Fig. 8). For the dimmest flashes, the response waveforms were similar, indicating that small rod signals were not altered by network filtering. For brighter flashes, the prominent initial transient of the rod photovoltage was nearly absent in the cone photovoltage, and the flat plateau of the rod photovoltage was replaced in the cone by a slowly developing hyperpolarization that never reached a steady state. Although the variability of response kinetics made a detailed comparison of separate rod and cone recordings impractical, in all 11 cones analyzed in this way, the rod component of the cone response lacked the sharp transient and flat plateau found in all rod photovoltage recordings.
Fig. 8.
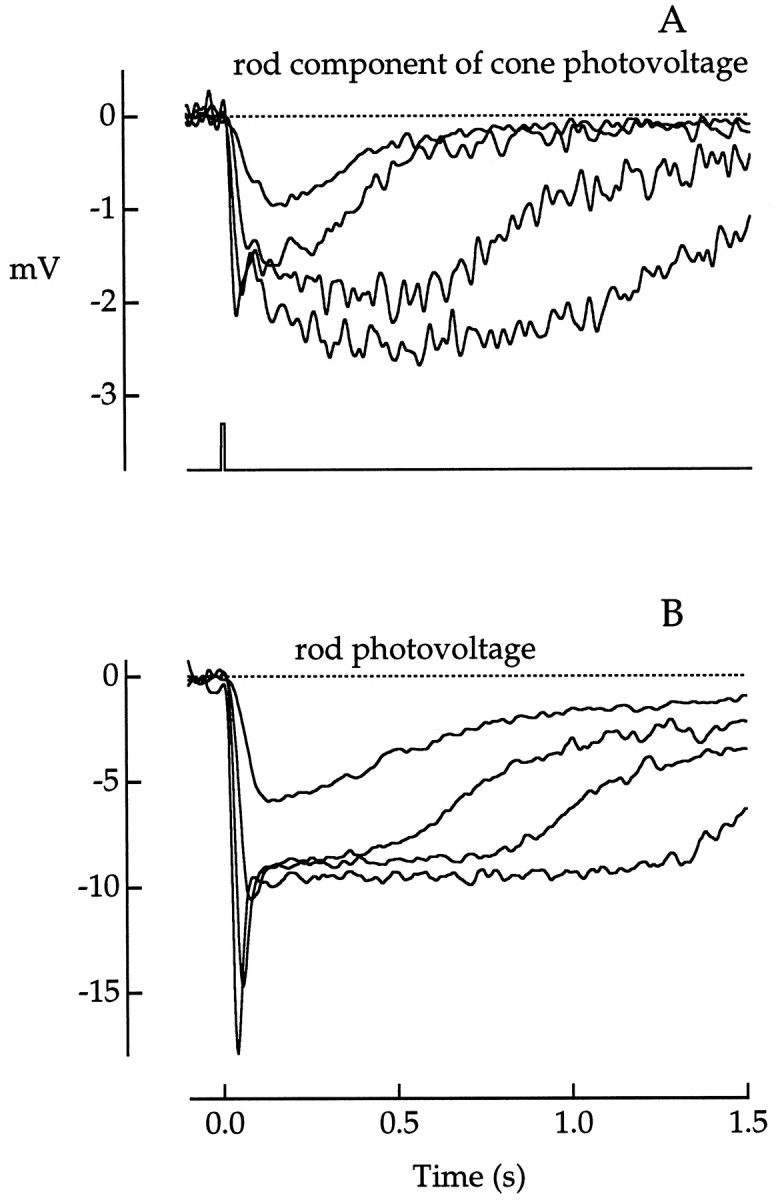
Comparison of the rod component of the cone photovoltage to the rod photovoltage. A, The rod component of the cone photovoltage was estimated from the difference responses (r500 −r660) measured at flash strengths matched for cone photon capture. The largest response is the same as that shown in Figure 7B. The smallest response was to a dim 500 nm flash alone. Flash photon densities (in photons μm−2) from the smallest to the largest responses are (i) 35.4 (500 nm), (ii) 130.1 (500 nm) and 826 (660 nm), (iii) 508.2 (500 nm) and 3327 (660 nm), and (iv) 1868 (500 nm) and 11,400 (660 nm). Bandwidth, DC–20 Hz. Responses were averages of 2–13 flashes. B, Rod photovoltage measured directly in a single rod to flashes of 500 nm and of approximately the same flash strengths as in A. Flash photon densities (in photons μm−2) from the smallest to the largest responses are 38.0, 140.0, 626.6, and 2301. Bandwidth, DC–30 Hz. Responses were averages of 1–18 flashes. Flash duration was 10 msec inA and B. The flash monitor for bothA and B is shown below the voltage traces in A.
Interpretation of the kinetics of the bright flash response is complicated by possible nonlinearities in the summation of the rod and cone components. With large excursions of the cone membrane potential, nonlinearities would result from voltage-activated conductances and alterations in the driving force for the photocurrent. In a few cones, the effect of these nonlinearities was assessed by eliciting cone-matched responses when the cone was voltage-clamped to the resting membrane potential (Fig. 4). The rod components computed from these voltage-clamp responses were similar to those in Figure8A, indicating that nonlinear summation did not significantly distort the rod component estimates. The mechanism of temporal filtering of the rod signals in the rod/cone network is not known. The nature of this filtering observed in primates is unlike the high-pass characteristic of other rod/cone networks (Attwell et al., 1984; Wu and Yang, 1988) and more closely resembles the low-pass filtering properties of an all-cone network in turtle (Detwiler and Hodgkin, 1979).
Adaptation method for decomposing the cone photovoltage
Another method for decomposing the cone photovoltage that was independent of spectral absorption matching took advantage of adaptation differences of rod and cone phototransduction. The twotraces in Figure 9Aare photovoltage responses of a green cone to 500 nm test flashes in the presence or absence of a dim steady background, also of 500 nm. The background was of an intensity expected to saturate rod phototransduction (Baylor et al., 1984; Tamura et al., 1991) but to affect cones negligibly (Schnapf et al., 1990).
Fig. 9.

Background adaptation used to isolate rod and cone components of the photovoltage of a green cone. A, Test flash responses in the presence (light-adapted) and absence (dark-adapted) of a steady background light expected to saturate rod phototransduction. Traces are averages of 28 dark-adapted or 11 light-adapted responses. Test flash, 500 nm, 274 photons μm−2; background light, 500 nm, 1364 photons μm−2 sec−1.B, Difference response obtained by subtraction of the light-adapted from the dark-adapted response in A. Bandwidth, DC–20 Hz. Flash duration was 10 msec. The flash monitor is shown above the voltage traces inA.
Although the background itself evoked only a small change in membrane potential (<0.2 mV), it dramatically altered the response to the test flash. The slow component of the hyperpolarization was eliminated as would be predicted from its rod origin. The peak response was also reduced, reflecting an early rod influence on the cone signal as suggested from the peak spectral sensitivity estimates of Figure 5. The light-adapted response resembled the cone component derived from the spectral difference response (Fig. 6B). Similar results were obtained in five other cones.
If one assumes that the rod but not the cone component was suppressed by the background, subtraction of the light-adapted from the dark-adapted response would give another estimate of the rod component. The adaptation difference response in Figure 9B is noisy but similar to the spectral difference response estimate in Figure8A at a similar flash strength. Comparable adaptation difference responses were obtained in a total of six cones.
Although the analysis from Figure 9 did not rely on precise intensity matching, a critical assumption was that cone phototransduction was not altered directly by the adapting light. A test of this assumption is shown for another green cone in Figure10. The three traces plot responses to an identical test flash recorded in the dark and in the presence of two different adapting backgrounds. A dim 500 nm background reduced the peak and removed the slow rod component from the dark-adapted response. But a cone-matched 660 nm background that was too weak to desensitize rods (Baylor et al., 1984) did not alter the dark-adapted response. This demonstrates that the rod component of the cone photovoltage can be suppressed selectively by dim background light.
Fig. 10.

Dim background light selectively suppressed rod input. Flash responses of a green cone to 500 nm test flashes (274 photons μm−2) were recorded in the following three conditions of adaptation: dark-adapted (solid line), in the presence of a 500 nm background light of 160 photons μm−2 sec−1(dashed line), or in the presence of a cone-matched 660 nm background of 24,070 photons μm−2sec−1 (dotted line).Traces are averages of 8–22 responses. Bandwidth, DC–10 Hz. Flash duration was 10 msec. The flash monitor is shownabove the voltage traces.
Can rod/cone coupling be modulated?
Light modulates gap junctional coupling of several cell types in nonprimate retina (Vaney, 1994, 1997), including coupling between rods and cones (Yang and Wu, 1989; Krizaj et al., 1998). In many cases retinal cell coupling is mediated by dopamine acting on either D1 or D2 dopamine receptors (DeVries and Schwartz, 1989, 1992; Dong and McReynolds, 1991; Hampson et al., 1992;Bloomfield et al., 1997; Krizaj et al., 1998). Because dopamine receptors have been located on primate photoreceptors (Zarbin et al., 1986; Dearry et al., 1991), we tested whether rod/cone coupling in the macaque retina could be modulated by dopamine or flupenthixol, a D1/D2 dopamine receptor blocker.
Neither dopamine nor flupenthixol had any effect on the rod component of the photovoltage (Fig.11A,B). Dopamine was bath applied to a final concentration of 20 μm, a concentration shown to saturate dopamine receptors in other retinal cells (Piccolino et al., 1984; DeVries and Schwartz, 1989). Flupenthixol was used at a concentration of 40 μm, a level found to block dopamine effects fully in other preparations (Gerschenfeld et al., 1982; Witkovsky and Shin, 1990; Cameron and Williams, 1993). The small reduction in the peak amplitude of the responses in the presence of dopamine and flupenthixol in Figure 11 was probably attributable to general rundown of the phototransduction of the cone. A selective reduction in the cone component of the cone photovoltage was often observed with extended recording times, even in the absence of pharmacological agents. Similar effects of dopamine were seen in a total of five cones tested; the flupenthixol result was seen in three cones tested.
Although classical chemical synapses between rods and cones have not been observed anatomically in macaque retina, it remains possible that coupling occurs via chemical transmission at an unidentified site. Light responses were recorded before and after superfusion with 0.5 mm CoCl2, a blocker of conventional synaptic transmission. Application of cobalt had no effect on the rod photovoltage itself (data not shown) or on the magnitude of rod signals recorded in cones (Fig. 11C), ruling out a role for conventional chemical transmission from rods to cones. Similar results were obtained in a total of three cones.
Can light itself modulate rod/cone coupling? On the basis of anatomical measurements in cat retina and theoretical considerations about signal and noise characteristics in a coupled network, it has been suggested that rods and cones should couple at background intensities exceeding approximately one photoisomerization sec−1 per rod and that they should uncouple in the dark (Smith et al., 1986). To look specifically at the effects of weak background illumination on rod and cone coupling, we monitored responses to 500 and 660 nm test flashes in the dark and in the presence of background lights 3–15 min in duration. Test flashes elicited near maximal responses from rods. Backgrounds evoked ∼20–100 photoisomerizations sec−1 per rod, intensities expected to evoke no or modest rod desensitization (Baylor et al., 1984; Tamura et al., 1991). In four cones studied, no evidence of enhanced rod/cone coupling was observed (data not shown). The rod component was reduced at the brighter background levels, but this was presumably caused by a small reduction of the light responses of the rods themselves (see below). These experiments ruled out a sizable modulatory role for dim light on rod/cone coupling. We did not, however, rule out a modulatory role for backgrounds of lower intensity and longer duration.
Response sensitivity and kinetics as a function of background intensity
Are the changes in cone photovoltage with light adaptation comparable with the light adaptive changes of vision in human observers? Do the rod and cone components of the cone photovoltage light-adapt independently, or do adaptive mechanisms act on the combined signals? To address these questions, we measured cone responses to dim flashes in the presence of steady background lights of varying intensity.
Flash sensitivity (the change in membrane potential evoked by a flash divided by flash photon density) diminished with increasing background intensity (Fig. 12A). Background illumination progressively reduced both the rod and cone components but did not substantially alter the kinetics of the cone component. This can be seen clearly by scaling dark- and light-adapted responses to the same peak amplitude (Fig. 12B). Despite a twofold difference in peak sensitivity, the two scaled responses tracked one another closely for >60 msec. At later times the responses diverged because the light-adapted response lacked the rod component. Similar effects were observed in seven other cones. The invariant kinetics of the cone component of the photovoltage with adaptation was reminiscent of the kinetic invariance of the cone outer segment photocurrent (Schnapf et al., 1990). The selective reduction of the rod component suggested that rod and cone components adapted separately over different ranges of background intensity.
Fig. 12.

Changes in sensitivity and kinetics of photon responses with background illumination in a green cone.A, Flash sensitivity (change in membrane potential photon−1 μm2) as a function of time after the flash is shown. Flash sensitivity to a 500 nm test flash was plotted in the dark-adapted state (largest response) and in the presence of steady background lights of 500 nm at five different background intensities. Test flash photon density (in photon μm−2), background intensity (in photon μm−2 sec−1), and the number of flash responses averaged were 549, 0, 101; 549, 162, 12; 549, 566, 18; 1039, 2642, 12; 1039, 9210, 24; and 1039, 41,540, 5. The vertical line passing through the peak of the responses is positioned at 36 msec. Flash duration was 10 msec. The flash monitor is shownabove the responses. B, For comparison of the waveforms, flash sensitivities in the dark-adapted state and in the presence of the second brightest background were normalized to the same peak height. Note the difference in the timescales of Aand B. Bandwidth, DC–30 Hz.
The intensity dependence of flash sensitivity is illustrated in Figure13 (for the same green cone shown in Fig. 12). The points in Figure 13, A and B, plot normalized peak sensitivity. The solid curve inA is a Weber–Fechner function of the form:
| Equation 2 |
where SL is the light-adapted sensitivity, SD is the dark-adapted sensitivity, IB is background light intensity, and I0 is the background that reduced sensitivity to 0.5 SD. The value ofI0 that gave the best (least-squares) fit of the data to the curve was 10,600 photons μm−2sec−1. A curve of this form was found to be a good description of the desensitization of the cone photocurrent (Schnapf et al., 1990). However, it was clearly a poor fit to the photovoltage data. The discrepancy was not unexpected because, as indicated above, rods contribute to the peak of the cone photovoltage and rods and cones desensitize at different background intensities.
Fig. 13.
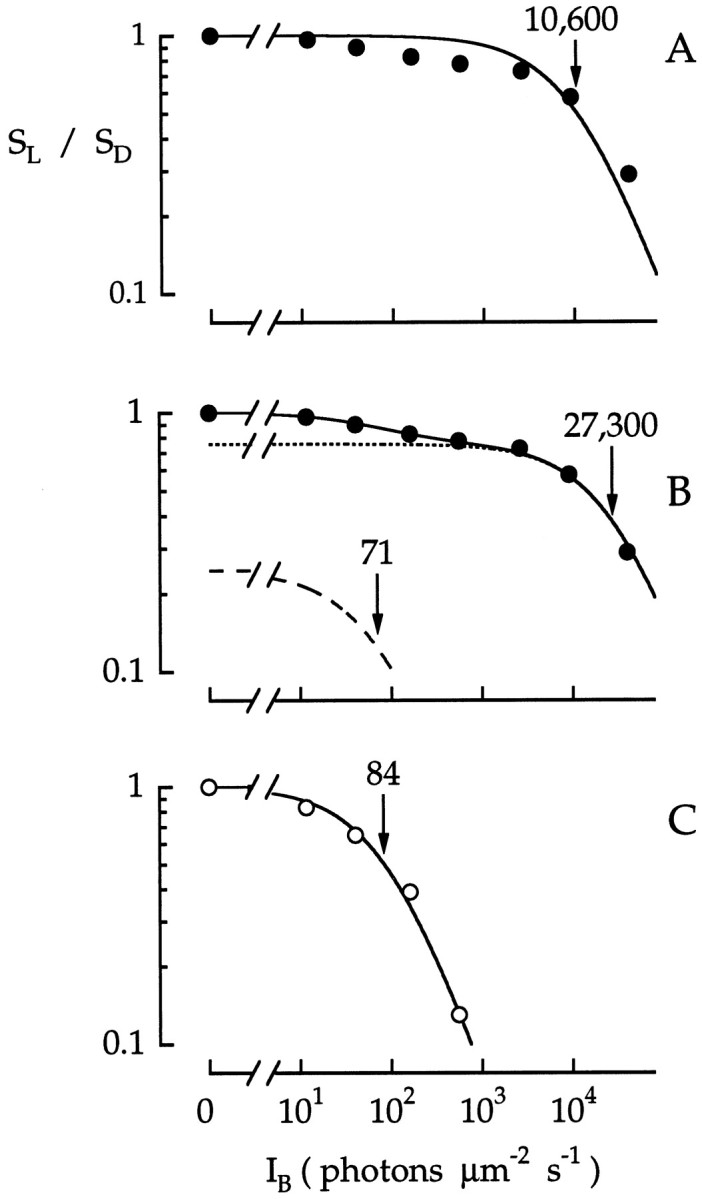
Intensity dependence of background desensitization in a green cone. Points plot peak flash sensitivity to a 500 nm test flash (SL), normalized to the dark-adapted sensitivity (SD) as a function of the intensity of a 500 nm background light (IB). Some of the responses used for these data are shown in Figure 12. SL andSD were compared in interleaved trials; no significant reduction in SD was observed between trials. A, B, Points (•) plot normalized sensitivity at the peak of the response. The solid curve in A is the least-squares fit of the points to a Weber–Fechner function (Eq. 2) withI0 = 10,600 photons μm−2 sec−1. The solid curve in B is the weighted sum of two Weber–Fechner functions given by Equation 3 with α = 0.75,IR0 = 70.8 photons μm−2 sec−1, andIC0 = 27,300 photons μm−2 sec−1. The putative rod and cone contributions that comprise the weighted function are plotted by the dashed and dotted curves, respectively. C, Points (○) plot normalized sensitivity measured at 300 msec. The solid curve is the least-squares fit of the points to a Weber–Fechner function (Eq. 2) withI0 = 84 photons μm−2sec−1.
Peak sensitivity was better described by a function based on the idea that the cone photovoltage was a weighted sum of rod and cone signals and that the amplitudes of both rod and cone inputs were reduced with background illumination according to Weber–Fechner functions with different I0 values (Fig. 13B). Normalized sensitivity would then be given as a weighted sum of Weber–Fechner functions:
| Equation 3 |
where I0R andI0C are the background intensities that reduce the amplitudes of the rod and cone components to one-half their dark values, and α is the weighting factor corresponding to the fraction of the peak of the dark-adapted response attributable to the cone component. The relative weightings of the rod and cone inputs were fixed by the relative peak spectral sensitivity of the cone to 500 and 660 nm lights. For the cone in Figure 13, the sensitivity to 500 nm test flashes relative to the sensitivity at 660 nm was ∼1.33 times larger than that expected for green cone photopigment. The value of α then was taken to be 0.75. The values ofIR0 andIC0 were free parameters chosen to minimize the squared differences between the points and the curve.
The solid curve in Figure 13B is the best-fitting weighted function (Eq. 3), and the dashed anddotted curves plot the putative rod and cone contributions, respectively. Equation 3 provided a good description of the peak sensitivity data. The half-desensitizing intensities for 500 nm background light were 71 photons μm−2sec−1(IR0) and 27,300 photons μm−2 sec−1(IC0), equivalent to photoisomerization rates of ∼71 sec−1 per rod and 14,800 sec−1per green cone. These values were similar to the values obtained from suction electrode recordings in primate rods and cones (Baylor et al., 1984; Schnapf et al., 1990; Tamura et al., 1991; Kraft et al., 1993). Thus, these results were consistent with independent rod and cone adaptation before the summation of their signals. These results do not however rule out some degree of desensitization of the cone signal due to the hyperpolarization induced by rods.
Another way to estimate adaptation of the rod input was to measure the background-induced reduction in amplitude of the cone photovoltage at a late time point in the response. The intensity dependence at 300 msec (Fig. 13C) was well described by a single Weber–Fechner function with I0 = 84 photons μm−2 sec−1, a value similar to that estimated by fitting the weighted function to the peak response (71 photons μm−2 sec−1). The precise form of the rod function and its I0value are only approximate because the test flash intensities fell outside the linear range for rod (but not cone) phototransduction. Nonetheless, the intensity dependence of the reduction resembled that measured in rod outer segments (Baylor et al., 1984; Tamura et al., 1991; Kraft et al., 1993), suggesting that background-induced reductions in the rod signal in cones were attributable to a reduction in quantal amplitude in rods and not reduced coupling efficacy between rods and cones.
Collected results of background desensitization from a total of four cones are plotted in Figure 14. For each cell the points were shifted on the y-axis so that the low intensity cone plateau was set to a normalized sensitivity value of 1. The intensity axis was also normalized by the estimated value of I0C for each cone. Thesolid curve is a Weber–Fechner function fitted to the cone component alone. Values of I0Cranged from 2320 to 14,800 photoisomerizations sec−1. The mean value ofI0C was 8700 photoisomerizations sec−1, corresponding to 2.8 log td.
Fig. 14.

Background desensitization measured in four cones. Peak flash sensitivity as a function of background intensity was plotted on normalized axes. Each symbol type is from a different cone. Data from each cone were normalized on they-axis so that the low-intensity cone plateau was set to a normalized sensitivity value of 1. I0 is the percent background intensity for each cone that halved the sensitivity of the dark-adapted cone component. The values ofI0 (in photons μm−2sec−1) and the cone types were as follows: 14,600, red (▵); 2910, red (○); 14,800, green (•); and 2320, green (■). The smooth curve is from Equation 2.
Further evidence that the reduction in flash sensitivity at the lowest background intensities was caused by rod desensitization came from a comparison of desensitization functions obtained with 500 and 660 nm backgrounds (Fig. 15). The desensitization function for this red cone was nonmonotonic when background strength was plotted in units of photoisomerizations sec−1 per red cone (Fig. 15A). On the other hand, when plotted in photoisomerizations sec−1 per rod, the results were well fitted by a single Weber–Fechner function with an I0 of 152 photoisomerizations sec−1 per rod (Fig.15B). This value is similar to the half-desensitizing intensity for rod photocurrent. Thus both the intensity range and the spectral sensitivity of the desensitization were rod-like. Unfortunately, the cone recording was lost before brighter background lights, the intensity range at which the spec- tral properties of desensitization would be expected to be more cone-like, could be explored.
Fig. 15.
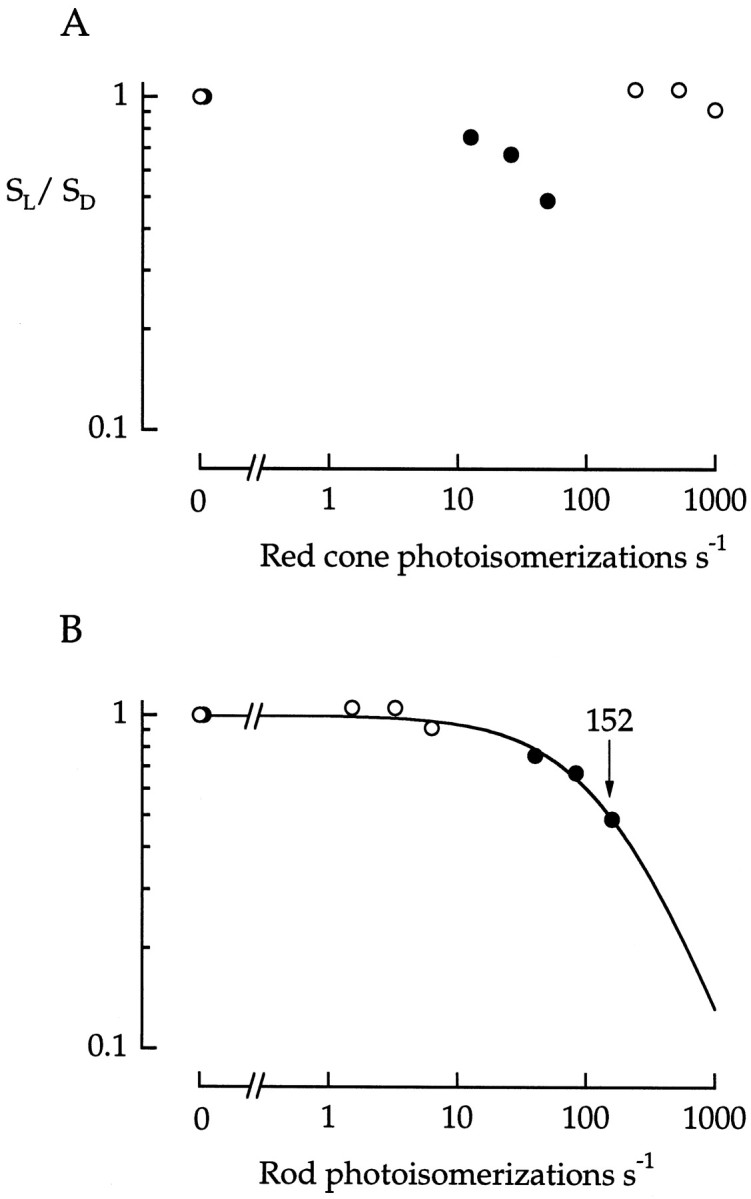
Spectral sensitivity of background desensitization. Peak flash sensitivity was measured as a function of background strength in a red cone. Flash wavelength was 500 nm. Background wavelength was 500 nm (•) or 660 nm (○).A, Background strength is plotted as the rate of photoisomerization in red cones. B, Background strength is plotted as the rate of photoisomerization in rods. The smooth curve in B is the least-squares fit of the points to Equation 2 with I0 = 152 photoisomerizations sec−1.
Membrane voltage fluctuations in the dark
The ability of a dark-adapted human observer to detect dim flashes of light is limited by the rate of spontaneous isomerization of rhodopsin in rods (Baylor et al., 1984). Spontaneous isomerizations are clearly seen as photon response-like events in current and voltage recordings from primate rods (Baylor et al., 1984;Schneeweis and Schnapf, 1995). It has similarly been proposed that random photopigment isomerizations in cones place a lower limit on the light intensities detectable in photopic vision (Barlow, 1958). To test this idea, we evaluated cone voltage noise in absolute darkness (Fig.16).
It was not possible to resolve single photopigment isomerizations in cone voltage noise (Fig. 16A,D) because the expected peak amplitude is only ∼5 μV (Schneeweis and Schnapf, 1995). The power spectral density of the dark noiseND(f) (Fig.16C,F, •) had a bandpass character, peaking at a frequency of 11 ± 3 Hz (mean ± SD;n = 7 cones). This form would be expected if the dark noise consisted of the superposition of random events that each have a diphasic waveform, events such as spontaneous isomerization or spontaneous activation of phosphodiesterase (Rieke and Baylor, 1996).
If dark noise arose mainly from spontaneous isomerizations, then the noise spectrum would be proportional to ‖R(f)‖2, the magnitude squared of the Fourier transform of the single photon response r(t). r(t) was estimated from a smoothed approximation to the average response to dim 660 nm flashes (Fig. 16B,E). Figure 16,C and F, illustrates dark noise spectra from a green and red cone, along with the spectra predicted for noise attributable solely to random isomerizations at rates of 13,000 sec−1 (C) or 12,000 sec−1 (F). The measured dark noise in C agreed closely with ‖R(f)‖2 at low frequencies but deviated at high frequencies. This was consistent with the presence of isomerization-like dark events in addition to some briefer events that introduced additional higher frequency noise. A similar correspondence was found for a second cone. In the remaining five cones, however, as illustrated for one cone in Figure16F, the entire noise spectrum was shifted to higher frequencies compared with ‖R(f)‖2, indicating that nonisomerization-like events dominated throughout the spectrum.
Equivalent dark light
Although the dark noise spectrum implied that isomerization-like events were not the sole source of voltage noise, it is nonetheless the case that noise fluctuations in the dark could limit the detectability of photons in much the same way that random photoisomerizations from a background light reduce the sensitivity of the visual system to light increments. The variance of the dark noise ς2 can be expressed as the intensityID of a steady light that would generate voltage fluctuations of equivalent variance (Barlow, 1958). The intensity of this “dark light,” in isomerizations sec−1, can be calculated from Campbell’s theorem (Papoulis, 1965) as:
| Equation 4 |
Because of temporal filtering by the cone synapse and subsequent neural elements (Baylor and Fettiplace, 1977; Schnapf and Copenhagen, 1982; Bialek and Owen, 1990), the noise will have biological significance over only a limited range of temporal frequencies. In the range of DC–20 Hz, a range that encompasses the frequency band of the photon response, the dark light rate was calculated as 24,500 and 18,700 sec−1 for the cones in Figure 16, C and F, respectively, and 12,500 ± 7900 sec−1 (mean ± SD) in a total of seven cones. Voltage recordings should reflect noise generated in the inner segment and synapse in addition to outer segment noise (see Discussion). This presumably explains why the voltage dark light rate is almost twice the value of 6400 sec−1obtained from outer segment photocurrent recordings of macaque cones (Schnapf et al., 1990). [Note the error in Schnapf et al. (1990), their Equation 13. The equation should read:ID = ς2/a2 τS, yielding a value for ID of 6400 sec−1.]
The above calculation of ID assumed that the visual system discards high frequencies that provide no information about the occurrence of photoisomerizations. This idea can be extended to suppose that the visual system uses an optimal filtering strategy to extract photon signals from noise. If the cone voltage is passed through a linear filter (assuming that a linear systems approach is appropriate for small signals), thenID is given by:
| Equation 5a |
| Equation 5b |
where ς2F is the variance of the noise after filtering,rF(t) is the single-photon response after filtering,ND(f) is the dark-noise spectrum, and ‖H(f)‖ is the magnitude of the Fourier transform of the impulse response of the filter.
One choice of optimal filter is the Wiener filter. This filter is optimal for minimizing the mean squared error between the filter output and some signal that is embedded in noise (Davenport and Root, 1958). In the present instance, the “signal” is the equivalent dark light, and the recorded dark noise is comprised of this signal plus additional noise (from channels, Johnson noise, etc.).H(f) would then have the form:H(f) ∝ ‖R(f)‖2/ND(f). Substituting this expression into Equation 5b yielded a dark light rate estimate of 12,100 and 4190 sec−1 for the cones in Figure 16, C and E, respectively, and 3800 ± 3800 sec−1 (mean ± SD) in a total of seven cones.
DISCUSSION
Magnitude of rod input in cones
The rod signal seen in cones was quite robust, although its magnitude varied from cone to cone. We do not know the true magnitudein vivo, but it is likely that the extent of rod coupling with cones was underestimated by our experiments. Some rod outer segments were damaged during retinal isolation and dissection, and we had greater success patching onto cones in retinal areas that were more sparsely populated by rod outer segments.
Rod input to cones could not be modulated using dopamine or a D1/D2 antagonist. This suggests that, unlike in Xenopus in which dopamine acts via D2receptors to modulate rod/cone coupling (Krizaj et al., 1998), dopamine receptors found on mammalian photoreceptors (Zarbin et al., 1986;Dearry et al., 1991; Cohen et al., 1992) may not be coupled to pathways that modulate gap junctional conductance between rods and cones. Neither did dim light modulate rod input to cones. The modulatory role of light needs to be examined in greater detail, however, using dimmer and especially longer duration backgrounds.
Waveform of the photovoltage
The cone component of the cone photovoltage differed from the outer segment photocurrent in two main ways. For very dim flashes the photovoltage peaked earlier than did the photocurrent, and for bright flashes the photovoltage had a pronounced early transient (or “nose”) that was absent in the photocurrent. Could inner segment voltage-dependent conductances account for these differences? Although voltage-dependent conductances in primate cones have not been studied extensively, it is possible to identify at least two that might be involved in shaping the primate cone photovoltage (Yagi and MacLeish, 1994). A potassium conductance, qualitatively similar to a delayed rectifier conductance found in nonmammalian cones (Beech and Barnes, 1989; Maricq and Korenbrot, 1990a), would be expected to shorten the time-to-peak of the photovoltage. A cation conductance that is activated by hyperpolarization would be expected to generate the nose of the cone photovoltage in primates, much as it does in rods and cones of other species (Attwell and Wilson, 1980; Hestrin, 1987; Barnes and Hille, 1989; Maricq and Korenbrot, 1990b). This cation conductance needs to be analyzed more closely in primates, however, because the voltage activation range reported by Yagi and MacLeish (1994) is considerably more negative than is the range in which the cone photovoltage exhibits a prominent nose.
Changes in kinetics with light adaptation
The temporal sensitivity of human photopic vision is altered by light adaptation. Bright background lights reduce the sensitivity of human observers selectively to stimuli of low temporal frequencies (de Lange, 1958). In contrast, the shape of the Fourier transform of the cone response changed little over the same range of background intensities in which psychophysical functions change. This difference suggests that photopic temporal sensitivity is determined primarily at sites downstream from the cone inner segment.
Light adaptation in cones has also been assessed from ERG recordings in human subjects. Hood and Birch (1993) found, consistent with the results presented here, that adapting backgrounds did not alter the time course of the cone ERG a-wave, at least over the first 10 msec of the response. But focal-ERG recordings (measurements thought to reflect cone behavior) suggested that temporal changes do occur in cones (Seiple et al., 1992). A resolution of this issue awaits ERG studies that unambiguously isolate the full cone signal.
The psychophysical parameter, critical duration, defines the period of time over which the visual system can integrate photons from a stimulus. For foveal stimulation the critical duration of the photopic visual system is ∼100 msec in the dark and declines to ∼25 msec as the background is increased to 1000 td (Watson, 1986). The comparable parameter for cone photovoltage, computed from the time integral of the main (hyperpolarizing) lobe of the flash response, was ∼40 msec in the dark, and this value changed minimally over a similar range of background intensities. If one assumes foveal cones behave similarly to the peripheral cones studied here, this result may indicate that dark-adapted cone signals are low-pass filtered downstream from the cone inner segments.
Changes in sensitivity with light adaptation
The sensitivity of the cone component of the photovoltage was halved by backgrounds that elicited ∼8700 photoisomerizations sec−1 or ∼2.8 log td. This intensity is somewhat lower than the half-desensitizing intensities of the cone photocurrent measured in single cones [3.3 log td (Schnapf et al., 1990)] or estimated from human ERGs [3.6 log td (Hood and Birch, 1993)]. However, the range of values in all three studies overlaps significantly.
In contrast, background intensities of only 1–2 log td are needed to halve psychophysical sensitivity (Hood and Finkelstein, 1986), implying that the cone inner segment is not the major site of sensitivity control and that substantial desensitization occurs proximally. Recent psychophysical experiments (Ahn and MacLeod, 1993) and voltage recordings in macaque horizontal cells (Dacey, personal communication) suggest the cone synapse itself may be an important locus of desensitization.
Dark noise
In most of the cones studied here, the dark noise was dominated by events other than spontaneous photopigment isomerizations. Lamb and Simon (1977) came to a similar conclusion in their study of noise in turtle cones. The origin of these other events is not known, but possible additional sources of noise include fluctuations of components involved in phototransduction, the gating of ion channels, noise arising from synaptic input to the cone, and Johnson noise associated with the electrode and cone input impedance. The electrode noise was calculated to be negligible; the access resistance of the electrode in the whole-cell mode was typically <100 MΩ, resulting in a noise contribution of <2 × 10⁻⁶mV2/Hz. Likewise, negligible Johnson noise would be associated with the typical cone input resistance of ∼250 MΩ; the expected noise contribution would be <5 × 10⁻⁶ mV2/Hz. The cone input resistance was determined from the relative sizes of the dim flash response during current clamp and voltage clamp.
Rieke and Baylor (1996) showed that the spontaneous activation of phosphodiesterase (PDE) molecules is responsible for the continuous noise seen in the photocurrent of toad rods. If the same were true in monkey cones, this may explain why the dark noise spectrum extends to higher frequencies compared with the spectrum of the photon response. Unitary PDE activation would lead to a voltage event that is briefer than the photon response if PDE activation occurred asynchronously over the lifetime of the photoactivated photopigment.
Equivalent dark light
Psychophysical estimates of the cone dark light fall in the range 1.4–140 sec−1 (0.1–10 td) (Barlow, 1958; Shapley and Enroth-Cugell, 1984; Donner, 1992). Assuming the cone voltage noise is optimally filtered, we estimated a much higher dark light rate of ∼3800 sec−1. One possible source of error in our calculation resides in the estimate of the amplitude of the photon response (Eq. 5a). It seems unlikely, however, that this amplitude was underestimated by the factor of three or greater that would be required for the dark light rate estimate to coincide with psychophysical values.
How could the dark light rate in cones be greater than the rate measured psychophysically? One possible resolution to this apparent paradox is that psychophysical dark light is not directly related to noise as is usually assumed. It could be the case, for instance, that psychophysical sensitivity is more closely linked to an adaptation mechanism that is responsive to small changes in the mean of the cone signal rather than to its variance. This idea should be testable by recording from retinal cells proximal to the cones.
Footnotes
This work was funded by National Eye Institute Grants R01-EY07642 and F32-EY06399. Additional support was obtained from That Man May See and Research to Prevent Blindness. We thank Drs. David Copenhagen and Jonathan Horton for helpful comments on this manuscript and Dr. Sean McCarthy for useful discussion on optimal filtering.
Correspondence should be addressed to Dr. Julie Schnapf, Departments of Ophthalmology and Physiology, University of California, San Francisco, CA 94143-0730.
Dr. Schneeweis’s present address: Smith-Kettlewell Eye Research Institute, 2318 Filmore Street, San Francisco, CA 94115.
REFERENCES
- 1.Ahn SJ, MacLeod DI. Link-specific adaptation in the luminance and chromatic channels. Vision Res. 1993;33:2271–2286. doi: 10.1016/0042-6989(93)90105-6. [DOI] [PubMed] [Google Scholar]
- 2.Attwell D, Wilson M. Behaviour of the rod network in the tiger salamander retina mediated by membrane properties of individual rods. J Physiol (Lond) 1980;309:287–315. doi: 10.1113/jphysiol.1980.sp013509. [DOI] [PMC free article] [PubMed] [Google Scholar]
- 3.Attwell D, Wilson M, Wu S. A quantitative analysis of interactions between photoreceptors in the salamander (Ambystoma) retina. J Physiol (Lond) 1984;352:703–737. doi: 10.1113/jphysiol.1984.sp015318. [DOI] [PMC free article] [PubMed] [Google Scholar]
- 4.Barlow HB. Visual problems of colour, Vol II, pp 617–630. Her Majesty’s Stationary Office; London: 1958. Intrinsic noise in cones. [Google Scholar]
- 5.Barnes S. After transduction: response shaping and control of transmission by ion channels of the photoreceptor inner segment. Neuroscience. 1994;58:447–459. doi: 10.1016/0306-4522(94)90072-8. [DOI] [PubMed] [Google Scholar]
- 6.Barnes S, Hille B. Ionic channels of the inner segment of tiger salamander cone photoreceptors. J Gen Physiol. 1989;94:719–744. doi: 10.1085/jgp.94.4.719. [DOI] [PMC free article] [PubMed] [Google Scholar]
- 7.Baylor DA, Fettiplace R. Kinetics of synaptic transfer from receptors to ganglion cells in turtle retina. J Physiol (Lond) 1977;271:425–448. doi: 10.1113/jphysiol.1977.sp012007. [DOI] [PMC free article] [PubMed] [Google Scholar]
- 8.Baylor DA, Fuortes MGF, O’Bryan PM. Receptive fields of cones in the retina of the turtle. J Physiol (Lond) 1971;214:265–294. doi: 10.1113/jphysiol.1971.sp009432. [DOI] [PMC free article] [PubMed] [Google Scholar]
- 9.Baylor DA, Nunn BJ, Schnapf JL. The photocurrent, noise and spectral sensitivity of rods of the monkey Macaca fascicularis. J Physiol (Lond) 1984;357:575–607. doi: 10.1113/jphysiol.1984.sp015518. [DOI] [PMC free article] [PubMed] [Google Scholar]
- 10.Baylor DA, Nunn BJ, Schnapf JL. Spectral sensitivity of cones of the monkey Macaca fascicularis. J Physiol (Lond) 1987;390:145–160. doi: 10.1113/jphysiol.1987.sp016691. [DOI] [PMC free article] [PubMed] [Google Scholar]
- 11.Beech J, Barnes S. Characterization of a voltage-activated K channel that accelerates the rod response to dim light. Neuron. 1989;3:573–581. doi: 10.1016/0896-6273(89)90267-5. [DOI] [PMC free article] [PubMed] [Google Scholar]
- 12.Bialek W, Owen WG. Temporal filtering in retinal bipolar cells. Elements of an optimal computation? Biophys J. 1990;58:1227–1233. doi: 10.1016/S0006-3495(90)82463-2. [DOI] [PMC free article] [PubMed] [Google Scholar]
- 13.Bloomfield SA, Xin D, Osborne T. Light-induced modulation of coupling between AII amacrine cells in the rabbit retina. Vis Neurosci. 1997;14:565–576. doi: 10.1017/s0952523800012220. [DOI] [PubMed] [Google Scholar]
- 14.Cameron DL, Williams JT. Dopamine D1 receptors facilitate transmitter release. Nature. 1993;366:344–347. doi: 10.1038/366344a0. [DOI] [PubMed] [Google Scholar]
- 15.Cohen AI, Todd RD, Harmon S, O’Malley KL. Photoreceptors of mouse retinas possess D4 receptors coupled to adenylate cyclase. Proc Natl Acad Sci USA. 1992;89:12093–12097. doi: 10.1073/pnas.89.24.12093. [DOI] [PMC free article] [PubMed] [Google Scholar]
- 16.Conner JD. The temporal properties of rod vision. J Physiol (Lond) 1982;332:139–155. doi: 10.1113/jphysiol.1982.sp014406. [DOI] [PMC free article] [PubMed] [Google Scholar]
- 17.Conner JD, MacLeod DIA. Rod photoreceptors detect rapid flicker. Science. 1977;195:698–699. doi: 10.1126/science.841308. [DOI] [PubMed] [Google Scholar]
- 18.Davenport WB, Root WL. An introduction to the theory of random signals and noise. MacGraw-Hill; New York: 1958. [Google Scholar]
- 19.Dearry A, Falardeau P, Shores C, Caron MG. D2 dopamine receptors in the human retina: cloning of cDNA and localization of mRNA. Cell Mol Neurobiol. 1991;11:437–453. doi: 10.1007/BF00734808. [DOI] [PubMed] [Google Scholar]
- 20.de Lange H. Research into the dynamic nature of the human foveal-cortex system with intermittent and modulated light. I. Attenuation characteristics of white and colored light. J Opt Soc Am. 1958;48:777–784. doi: 10.1364/josa.48.000777. [DOI] [PubMed] [Google Scholar]
- 21.Detwiler PB, Hodgkin AL. Electrical coupling between cones in turtle retina. J Physiol (Lond) 1979;291:75–100. doi: 10.1113/jphysiol.1979.sp012801. [DOI] [PMC free article] [PubMed] [Google Scholar]
- 22.Detwiler PB, Hodgkin AL, McNaughton PA. A surprising property of electrical spread in the network of rods in the turtle’s retina. Nature. 1978;274:562–565. doi: 10.1038/274562a0. [DOI] [PubMed] [Google Scholar]
- 23.DeVries SH, Schwartz EA. Modulation of an electrical synapse between horizontal cells by dopamine and second messengers. J Physiol (Lond) 1989;414:351–375. doi: 10.1113/jphysiol.1989.sp017692. [DOI] [PMC free article] [PubMed] [Google Scholar]
- 24.DeVries SH, Schwartz EA. Hemi-gap-junction channels in solitary horizontal cells of the catfish retina. J Physiol (Lond) 1992;445:201–230. doi: 10.1113/jphysiol.1992.sp018920. [DOI] [PMC free article] [PubMed] [Google Scholar]
- 25.Dong CJ, McReynolds JS. The relationship between light, dopamine release and horizontal cell coupling in the mudpuppy retina. J Physiol (Lond) 1991;440:291–309. doi: 10.1113/jphysiol.1991.sp018709. [DOI] [PMC free article] [PubMed] [Google Scholar]
- 26.Donner K. Noise and absolute thresholds of cone and rod vision. Vision Res. 1992;32:853–866. doi: 10.1016/0042-6989(92)90028-h. [DOI] [PubMed] [Google Scholar]
- 27.Fain GL. Quantum sensitivity of rods in the toad retina. Science. 1975;187:838–841. doi: 10.1126/science.1114328. [DOI] [PubMed] [Google Scholar]
- 28.Gerschenfeld HM, Neyton J, Piccolino M, Witkovsky P. L-horizontal cells of the turtle: network organization and coupling modulation. Biomed Res. 1982;3:21–34. [Google Scholar]
- 29.Gold GH, Dowling JE. Photoreceptor coupling in the retina of the toad. I. Anatomy. J Neurophysiol. 1979;42:292–310. doi: 10.1152/jn.1979.42.1.292. [DOI] [PubMed] [Google Scholar]
- 30.Hampson ECGM, Vaney DI, Weiler R. Dopaminergic modulation of gap junction permeability between amacrine cells in mammalian retina. J Neurosci. 1992;12:4911–4922. doi: 10.1523/JNEUROSCI.12-12-04911.1992. [DOI] [PMC free article] [PubMed] [Google Scholar]
- 31.Hestrin S. The properties and function of inward rectification in rod photoreceptors of the tiger salamander. J Physiol (Lond) 1987;390:319–333. doi: 10.1113/jphysiol.1987.sp016703. [DOI] [PMC free article] [PubMed] [Google Scholar]
- 32.Hood DC, Birch DG. Human cone receptor activity: the leading edge of the a-wave and models of receptor activity. Vis Neurosci. 1993;10:857–871. doi: 10.1017/s0952523800006076. [DOI] [PubMed] [Google Scholar]
- 33.Hood DC, Finkelstein MA. Sensitivity to light. In: Boff KR, Kaufman L, Thomas JP, editors. Handbook of perception and human performance, Vol 1, Sensory processes and perception. Wiley; New York: 1986. pp. 5/1–5/66. [Google Scholar]
- 34.Horn R, Marty A. Muscarinic activation of ionic currents measured by a new whole-cell recording method. J Gen Physiol. 1988;92:145–159. doi: 10.1085/jgp.92.2.145. [DOI] [PMC free article] [PubMed] [Google Scholar]
- 35.Kraft TW, Schneeweis DM, Schnapf JL. Visual transduction in human rod photoreceptors. J Physiol (Lond) 1993;464:747–765. doi: 10.1113/jphysiol.1993.sp019661. [DOI] [PMC free article] [PubMed] [Google Scholar]
- 36.Krizaj D, Gabriel R, Owen WG, Witkovsky P. Dopamine D2 receptor-mediated modulation of rod-cone coupling in the Xenopus retina. J Comp Neurol. 1998;398:529–538. [PMC free article] [PubMed] [Google Scholar]
- 37.Lamb TD, Simon EJ. Analysis of electrical noise in turtle cones. J Physiol (Lond) 1977;272:435–468. doi: 10.1113/jphysiol.1977.sp012053. [DOI] [PMC free article] [PubMed] [Google Scholar]
- 38.Maricq AV, Korenbrot JI. Inward rectification in the inner segment of single retinal cone photoreceptors. J Neurophysiol. 1990a;64:1917–1928. doi: 10.1152/jn.1990.64.6.1917. [DOI] [PubMed] [Google Scholar]
- 39.Maricq AV, Korenbrot JI. Potassium currents in the inner segment of single retinal cone photoreceptors. J Neurophysiol. 1990b;64:1929–1940. doi: 10.1152/jn.1990.64.6.1929. [DOI] [PubMed] [Google Scholar]
- 40.Papoulis A. Probability, random variables, and stochastic processes. MacGraw-Hill; New York: 1965. [Google Scholar]
- 41.Piccolino M, Neyton J, Gerschenfeld HM. Decrease of gap junction permeability induced by dopamine and cyclic adenosine 3′5′-monophosphate in horizontal cells of turtle retina. J Neurosci. 1984;4:2477–2488. doi: 10.1523/JNEUROSCI.04-10-02477.1984. [DOI] [PMC free article] [PubMed] [Google Scholar]
- 42.Raviola E, Gilula NB. Gap junctions between photoreceptor cells in the vertebrate retina. Proc Natl Acad Sci USA. 1973;70:1677–1681. doi: 10.1073/pnas.70.6.1677. [DOI] [PMC free article] [PubMed] [Google Scholar]
- 43.Rieke F, Baylor DA. Molecular origin of continuous dark noise in rod photoreceptors. Biophys J. 1996;71:2553–2572. doi: 10.1016/S0006-3495(96)79448-1. [DOI] [PMC free article] [PubMed] [Google Scholar]
- 44.Schnapf JL, Copenhagen DR. Differences in the kinetics of rod and cone synaptic transmission. Nature. 1982;296:862–864. doi: 10.1038/296862a0. [DOI] [PubMed] [Google Scholar]
- 45.Schnapf JL, Kraft TW, Baylor DA. Spectral sensitivity of human cones. Nature. 1987;325:439–441. doi: 10.1038/325439a0. [DOI] [PubMed] [Google Scholar]
- 46.Schnapf JL, Nunn BJ, Meister M, Baylor DA. Visual transduction in cones of the monkey Macaca fascicularis. J Physiol (Lond) 1990;427:681–713. doi: 10.1113/jphysiol.1990.sp018193. [DOI] [PMC free article] [PubMed] [Google Scholar]
- 47.Schneeweis DM, Schnapf JL. Photovoltage of rods and cones in the macaque retina. Science. 1995;268:1053–1056. doi: 10.1126/science.7754386. [DOI] [PubMed] [Google Scholar]
- 48.Seiple W, Holopigian K, Greenstein V, Hood DC. Temporal frequency dependent adaptation at the level of the outer retina in humans. Vision Res. 1992;32:2043–2048. doi: 10.1016/0042-6989(92)90065-q. [DOI] [PubMed] [Google Scholar]
- 49.Shapley R, Enroth-Cugell C. Visual adaptation and retinal gain controls. Prog Retinal Res. 1984;3:263–346. [Google Scholar]
- 50.Smith RG, Freed MA, Sterling P. Microcircuitry of the dark-adapted cat retina: functional architecture of the rod-cone network. J Neurosci. 1986;6:3505–3517. doi: 10.1523/JNEUROSCI.06-12-03505.1986. [DOI] [PMC free article] [PubMed] [Google Scholar]
- 51.Tamura T, Nakatani K, Yau KW. Calcium feedback and sensitivity regulation in primate rods. J Gen Physiol. 1991;98:95–130. doi: 10.1085/jgp.98.1.95. [DOI] [PMC free article] [PubMed] [Google Scholar]
- 52.Tsukamoto Y, Masarachia P, Schein SJ, Sterling P. Gap junctions between the pedicles of macaque foveal cones. Vision Res. 1992;32:1809–1815. doi: 10.1016/0042-6989(92)90042-h. [DOI] [PubMed] [Google Scholar]
- 53.Vaney DI. Patterns of neuronal coupling in the retina. Prog Retinal Eye Res. 1994;13:301–355. [Google Scholar]
- 54.Vaney DI. Neuronal coupling in rod-signal pathways of the retina. Invest Ophthalmol Vis Sci. 1997;38:267–273. [PubMed] [Google Scholar]
- 55.Watson AB. Temporal sensitivity. In: Boff KR, Kaufman L, Thomas JP, editors. Handbook of perception and human performance, Vol 1, Sensory processes and perception. Wiley; New York: 1986. pp. 6/1–6/43. [Google Scholar]
- 56.Witkovsky P, Shin XP. Slow light and dark adaptation of horizontal cells in the Xenopus retina: a role of endogenous dopamine. Vis Neurosci. 1990;5:405–413. doi: 10.1017/s0952523800000493. [DOI] [PubMed] [Google Scholar]
- 57.Wu S, Yang X-L. Electrical coupling between rods and cones in the tiger salamander retina. Proc Natl Acad Sci USA. 1988;85:275–278. doi: 10.1073/pnas.85.1.275. [DOI] [PMC free article] [PubMed] [Google Scholar]
- 58.Yagi T, MacLeish PR. Ionic conductances of monkey solitary cone inner segments. J Neurophysiol. 1994;71:656–665. doi: 10.1152/jn.1994.71.2.656. [DOI] [PubMed] [Google Scholar]
- 59.Yang X-L, Wu S. Modulation of rod-cone coupling by light. Science. 1989;244:352–354. doi: 10.1126/science.2711185. [DOI] [PubMed] [Google Scholar]
- 60.Zarbin M, Wamsley J, Palacios J, Kuhar M. Autoradiographic localization of high affinity GABA, benzodiazepine, dopaminergic, adrenergic, and muscarinic cholinergic receptors in the rat, monkey, and human retina. Brain Res. 1986;374:75–92. doi: 10.1016/0006-8993(86)90396-3. [DOI] [PubMed] [Google Scholar]