

Abstract
During repetitive action potential firing the maintenance of synaptic transmission relies on a continued supply of synaptic vesicles for fusion with the presynaptic plasma membrane. The mechanism of transport by which vesicles are delivered to the site of fusion from a reserve pool is unknown, as are the biochemical pathways linking intracellular Ca2+ elevation with vesicle mobilization. Here, using the fluorescent tracer FM1-43 in hippocampal synaptic terminals, I show that inhibitors of myosin light chain kinase can block mobilization of the reserve pool and not the immediately releasable pool.
Keywords: exocytosis, vesicle recycling, synaptic vesicles, myosin light chain kinase, hippocampus, presynaptic terminal, FM1-43
Although there has been tremendous progress in understanding the molecular basis of membrane fusion and vesicle docking (Schiavo et al., 1995; Sudhof, 1995; Hay and Scheller, 1997), much less is known about the mechanisms that underlie the transport of vesicles to their target membranes. In synaptic terminals neurotransmitter-containing vesicles are maintained in large clusters in apposition to the site of membrane fusion and must be mobilized in synchrony with vesicle fusion to sustain synaptic transmission during repetitive stimulation. It has long been hypothesized that the elevation of intracellular Ca2+, which promotes membrane fusion, also might serve as a trigger for vesicle mobilization and transport (Berl et al., 1973). Recent studies at different types of central synapses (Stevens and Wesseling, 1998; Wang and Kaczmarek, 1998) indicate that the resupply of vesicles after stimulation is accelerated by elevations of intracellular Ca2+. The molecular basis of the movement of vesicles that would be required to refill the readily releasable pool remains unknown. Previous studies have established that myosin and the Ca2+/calmodulin-dependent regulatory enzyme of actin–myosin interactions, myosin light chain kinase (MLCK), are required for presynaptic function (Mochida et al., 1994), but their precise role in the synaptic vesicle life cycle has not been established. Thus an actin–myosin interaction likely drives vesicle movements within the terminal in at least one phase of the synaptic vesicle life cycle.
To pinpoint the possible functional role of MLCK in synaptic vesicle recycling, I have investigated the impact of known membrane-permeant organic inhibitors of MLCK on presynaptic function in combination with optical assays of membrane trafficking at individual synaptic boutons of hippocampal neurons in culture. Optical assays of membrane traffic that use the fluorescent tracer FM1-43 provide a means of isolating several different steps in the synaptic vesicle life cycle (Betz and Bewick, 1993; Ryan and Smith, 1995). In addition, they allow one to estimate the size of the recycling vesicle pool on a bouton by bouton basis (Ryan et al., 1996b; Murthy et al., 1997). My results indicate that inhibition of MLCK reduces the size of the recycling vesicle pool but does not change the kinetics of vesicle pool turnover significantly. Finally, I show that the reduction in pool size by the inhibition of MLCK results from the block of a distal recycling pool that normally is released with >20 AP and that the turnover of a readily releasable pool is unaffected.
MATERIALS AND METHODS
Cell culture. Hippocampal CA1–CA3 regions were dissected from 4-d-old Sprague Dawley rats, dissociated, and plated onto Matrigel (Collaborative Biochemical, Franklin Lakes, NJ) or polyornithine-coated coverslips inside a 5-mm-diameter cloning cylinder (100 μl vol; Bellco Glass, Vineland, NJ). Animals used in this study were cared for in accordance with institutional guidelines. Cells were maintained in culture media consisting of MEM (Life Technologies, Gaithersburg, MD), 0.6% glucose, 0.1 gm/l bovine transferrin (Calbiochem, La Jolla, CA), 0.25 gm/l insulin, 0.3 gm/l glutamine, 5–10% fetal calf serum (HyClone, Logan, UT), 2% B-27 (Life Technologies), and 8 μm cytosine β-d-arabinofuranoside. Cultures were maintained at 37°C in a 95% air/5% CO2 humidified incubator for 14–50 d before use. Unless otherwise indicated, all chemicals were obtained from Sigma (St. Louis, MO).
Experimental conditions. Coverslips were mounted in a rapid-switching, laminar-flow perfusion and stimulation chamber on the stage of a laser-scanning confocal microscope. The total volume of the chamber was ∼75 μl and was perfused at a rate of 1–1.5 ml/min. Action potentials were evoked by passing 1 msec current pulses yielding fields of ∼10 V/cm through the chamber via platinum–iridium electrodes. Except as otherwise noted, cells were superfused continuously at room temperature (∼24°C) in a saline solution consisting of (in mm) 119 NaCl, 2.5 KCl, 2 CaCl2, 2 MgCl2, 25 HEPES (buffered to pH 7.4), and 30 glucose plus 10 μm6-cyano-7-nitroquinoxaline-2,3-dione (CNQX; Research Biochemicals, Natick, MA) and 50 μm μmd,l-2-amino-5-phosphonovaleric acid (AP-5; Research Biochemicals). FM1-43 (Molecular Probes, Eugene, OR) was used at a concentration of 15 μm. ML-9 and ML-7 were obtained from Calbiochem and Alexis Pharmaceuticals (San Diego, CA) and prepared as 100 mm stock solutions in DMSO. The final concentration of DMSO never exceeded 0.05%. Butane-2,3-dione-monoxine (BDM) was obtained from Sigma and prepared fresh with each use in the perfusion saline.
Optical measurements, microscopy, and analysis.Laser-scanning fluorescence and differential interference contrast images were acquired simultaneously at a spatial sampling of 125 nm/pixel and a dwell time of 2 μsec/pixel through a 40× 1.3 numerical aperture Zeiss Fluar objective (Oberkochen, Germany), using a custom-built laser-scanning microscope. Specimens were illuminated with ∼1.5 μW of the 488 nm line of an argon ion laser that was shuttered rapidly during all nondata-acquiring periods by the use of acousto-optic modulation. Under these conditions, photobleaching of FM1-43 fluorescence was <0.25% per image. Quantitative measurements of fluorescence intensity at individual synapses were obtained by averaging a 4 × 4 area of pixel intensities centered on the optical center of mass of a given fluorescent punctum. Individual puncta were selected by hand, and the optical center of mass used to center the measurement box was computed over a slightly larger area (typically 6 × 6 pixels). Large puncta, typically representative of clusters of smaller synapses, were rejected during the selection procedure as were any puncta that were not clearly discernible in all test episodes. Errors shown are SEM.
RESULTS
Inhibitors of MLCK partially block release of FM1-43 during continuous action potential stimulation
The strategy used for these studies is depicted in Figure1. To measure the impact of various inhibitors of MLCK or myosin on vesicle pool turnover during defined action potential trains, I used the fluorescent probe FM1-43 in combination with superfusion, imaging, and stimulation methods. All measurements proceed in two phases. The loading phase consisted of a period of vesicle exocytosis stimulated by a defined action potential train in the presence of FM1-43. FM1-43 was left in the superfusate 1 min beyond the firing of action potentials. The extra 1 min exposure to dye ensured the labeling of all of the vesicles retrieved during endocytosis (Ryan and Smith, 1995; Ryan et al., 1996a). The unloading phase, performed after 10 min of rinsing in dye-free solution, consisted of at least two episodes of acquiring fluorescence images before and after a prolonged train of action potentials (900 at 10 Hz). Each unloading episode was separated by a brief rest period (150 sec). For some experiments a series of images was acquired during the unloading phase to measure the kinetics of dye release and vesicle pool turnover. A measure of the vesicle turnover that occurred during the loading phase was obtained by calculating the sum of the differences in fluorescence intensity, ΔF, at individual boutons between images before and after each unloading episode. The impact of MLCK inhibitors was assessed in one of two ways: inhibitors were perfused in during the loading phase, in the presence of the dye, and unloading was performed in drug-free conditions, or inhibitors were perfused onto preloaded boutons during one of the unloading episodes. In either case the drug application condition was interspersed between two bracketing control runs during which no drug was applied. The average response of the control runs was used as normalization for the drug-containing episodes.
Fig. 1.

Protocols for FM1-43 labeling of vesicle recycling in the presence of MLCK or myosin inhibitors. Recycling vesicles were labeled by exposure to 15 μm extracellular FM1-43 (Load) during AP stimulus. The 90 sec of 10 Hz stimulation in a dye-free solution then released ∼90% of the vesicular dye in control conditions (Unload; ΔF0). A second round of 900 AP released the remaining 10% vesicular fluorescence (Unload; ΔF1). The impact of inhibitors of MLCK or myosin on vesicle recycling was determined by application during either the loading or the unloading phase. In either case, inhibitors were perfused in 150 sec before the stimulus and washed out after the stimulus.
Figure 2a is a Nomarski image illustrating a typical axodendritic network of hippocampal neurons in culture. Figure 2b shows a pseudocolored fluorescence image of the same field acquired after FM1-43 loading with a 900 action potential (AP) stimulus (image A in the schematic). The image shows the characteristic distribution of fluorescent puncta corresponding to clusters of labeled synaptic vesicles in individual presynaptic boutons (Betz and Bewick, 1992; Ryan et al., 1993; Henkel et al., 1996). Previous studies have shown that the labeling of the total recycling pool is saturated under these conditions (Ryan and Smith, 1995). Figure 2c shows a large reduction in fluorescence produced by a long unloading train of APs (900) in control conditions (image B). Approximately 90–95% of the total labeled pool is turned over in a single long stimulus train, whereas a subsequent long unloading train releases the remaining labeled vesicles (images C, D; data not shown). The fluorescence signal ΔF is defined as the difference in bouton fluorescence measured before and after unloading (that is, imagesA–B and C–D in the schematic). The total ΔF (ΔFT=ΔF0 + ΔF1) signal represents the amount of dye taken up into a releasable vesicular pool during the specified load. To examine the role of MLCK on the release of FM1-43 from the total recycling pool, I reloaded the boutons as in Figure 1 and then perfused in 30 μm ML-9, a potent and relatively specific inhibitor of MLCK (Saitoh et al., 1987) (Fig. 2d). Then the boutons were stimulated with a long unloading train of action potentials. Figure2e shows that a large fraction of fluorescence remains in the terminal after a long unloading stimulus train; further stimulation with an additional 900 AP in the presence of ML-9 fails to release all but 10% of the remaining fluorescence. Reperfusion of the boutons in control saline, followed by additional unloading stimuli, returns the fluorescence to baseline (Fig. 2f). Finally, a third round of dye loading and unloading in the absence of ML-9 reveals that the boutons recover completely from the drug exposure, indicating that the effects of ML-9 are completely reversible. Thus ML-9 causes a reversible, partial block of vesicle pool turnover during action potential stimulation. The degree of block obtained varies across a population of boutons. I define the efficacy of inhibition as the ratio of the fraction of the total pool released during a long stimulus train in the presence of ML-9 (ΔF0/ΔFT)ML-9with that in control conditions (ΔF0/ΔFT)control. The distribution of inhibition values measured on a bouton by bouton basis from a single experiment, like that shown in Figure 2, is displayed in Figure 3 and indicates that the mean efficacy of inhibition is 68 ± 2.4%. Higher-frequency stimulation (20 Hz) for the same unloading period gives identical values of inhibition (data not shown), suggesting that the blockade cannot be overcome with stronger stimuli.
Fig. 2.
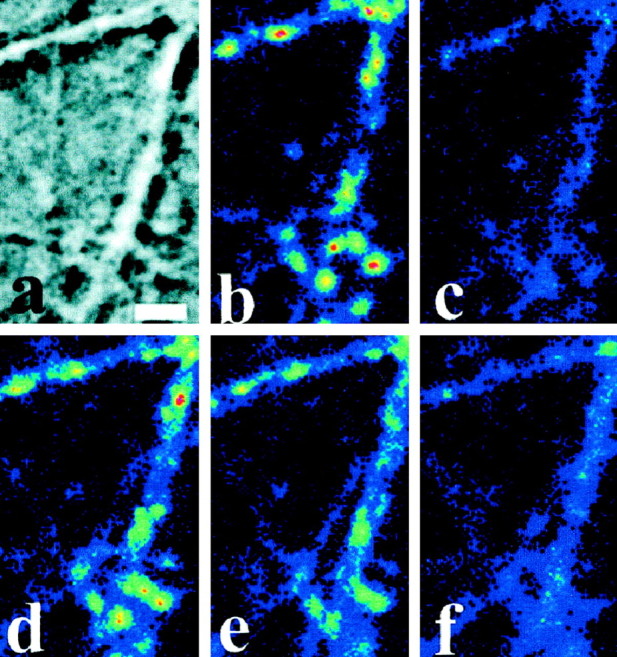
FM1-43 visualization of vesicle turnover block by MLCK or myosin inhibition. a, A Nomarski image of hippocampal culture showing a typical axodendritic network. Scale bar, 3 μm. b, Fluorescence of same field after a 900 AP dye load. c, Same as in b, after a 900 AP unload. d, Same as in b after a second 900 AP load. e, Same as in c after unloading with 900 AP in the presence of 30 μm ML-9. A large fraction of the fluorescence remains in the boutons.f, The fluorescence retained in e is now released with 900 additional AP applied after ML-9 washout.
Fig. 3.

Inhibition of vesicle pool mobilization by MLCK or myosin inhibitors. The degree of inhibition from a typical experiment as in Figure 1 was measured over a population of 44 synaptic boutons. To control for possible rundown, I performed an additional control run of loading and unloading. Boutons were selected for measurement on the basis of their appearance in both control runs. A, Histogram of ML-9 inhibition in a single experiment. Inhibition is defined as (1 − ΔFML-90/ΔFcontrol0), where ΔFcontrol0 is the average fluorescence signal of the two control runs. B, Percentage of vesicle pool remaining after 900 AP in 30 μm ML-9, 15 μm ML-7, 25 mm BDM, or control saline. All three inhibitory conditions reduce the number of vesicles turned over during prolonged AP stimuli. Slightly longer wash-in and washout times (4 min) were used for experiments with ML-7, a more hydrophobic compound than ML-9. Each concentration was measured in at least two experiments over 40–120 boutons. C, Dose–response relationship of ML-9 inhibition shown as the fraction of the recycling vesicle pool remaining after 900 AP unloading stimuli. The maximal block by ML-9 saturates for [ML-9] >25 μmand shows a half-maximal inhibition of ∼12.5 μm. The inhibition at each concentration was measured in at least three separate experiments over a total of 75–95 boutons.
Similar results were obtained with a higher-affinity inhibitor of MLCK, ML-7, as well as butanedione-monoxine (BDM), a known inhibitor of both myosin II and myosin V ATPases (Cramer and Mitchison, 1995) (Fig.3B). The inhibition of vesicle pool turnover by ML-9 is dose-dependent (Fig. 3C), exhibits an IC50 value (the concentration that produced 50% of maximal inhibition) of ∼12.5 μm, and saturates for concentrations >30 μm. This is identical to the IC50 value of ML-9 inhibition of myosin-dependent smooth muscle contraction (Saitoh et al., 1987) as well as of Ca2+-dependent phosphorylation of myosin light chain in human platelets (Saitoh et al., 1986). The IC50 value for ML-7 inhibition in this assay is ∼5 μm (data not shown). Together, these data imply that MLCK and myosin act to control vesicle pool mobilization at synaptic terminals.
The t½ for endocytosis is unchanged by ML-9
The potential role of MLCK and myosin in controlling endocytosis was investigated by measuring the time course of FM1-43 uptake after action potential stimuli in the presence or absence of ML-9 or BDM. The protocol used for these studies is depicted in the schematic of Figure4 and is similar to previously published protocols (Reuter and Porzig, 1995; Ryan and Smith, 1995; Wu and Betz, 1996; Isaacson and Hille, 1997). As in Figures 1and 2, the measurement proceeds in two phases: a loading phase, followed by an unloading phase, in which maximal stimulation was used to quantify ΔF, the amount of dye taken up during the loading. Dye loading was performed by stimulating with a train of 100 AP (10 sec at 10 Hz) and presenting FM1-43 after a delay Δt with respect to the start of the stimulus. Sequential measurements were performed, interspersing runs with Δt = 25 sec between bracketing runs with Δt = 0 sec, correcting for possible fluctuations in the response. The relative amount of loading with Δt= 25 sec was normalized with the mean values of the bracketing runs, which measured the total amount of vesicular turnover for the given stimulus at a single bouton. Measurements on different coverslips then were repeated in the presence of ML-9 or BDM. I chose to compare the time that corresponds with the approximatet½ for completion of endocytosis in control conditions for cultured hippocampal neurons (Reuter and Porzig, 1995; Ryan et al., 1996a; Isaacson and Hille, 1997). The results, displayed in Figure 3, show that neither ML-9 nor BDM significantly alters the time course of endocytosis. These results imply that neither MLCK nor myosin activity regulates the endocytic branch of synaptic vesicle recycling and indicate that inhibition of vesicle cycling likely acts upstream of endocytosis in the synaptic vesicle cycle. The time scale of endocytosis after longer loading stimuli (300 AP) gave identical results in the same three conditions (data not shown).
Fig. 4.

ML-9 and BDM do not block endocytosis.Schematic, The protocol used to measure the time course of endocytosis is shown. FM1-43 uptake at Δt = 25 sec after the beginning of a 100 AP stimulus train (10 Hz) normalized to uptake at Δt = 0 sec is shown for three conditions: 30 μm ML-9 (n = 38; two experiments), 25 mm BDM (n = 66; two experiments), and control saline (n = 44; two experiments). FM1-43 was applied for 1 min and rinsed for 10 min before the uptake was measured by using a long unloading train of AP as in Figure 1.
The size of the recycling vesicle pool is reduced significantly but the kinetics of release of the pool is unchanged in ML-9
Two types of experiments were performed to characterize further the impact of MLCK inhibition on vesicle pool turnover. Previous measurements of the release of FM1-43 from labeled vesicle pools during action potential trains at 10 Hz indicate that kinetics of dye loss exhibits single exponential behavior with a relaxation constant of ∼200 AP (Ryan and Smith, 1995; Isaacson and Hille, 1997). Figure 5 shows the kinetics of release of FM1-43 from previously loaded synaptic terminals during 10 Hz of action potential stimulation in varying concentrations of ML-9. The data are normalized to the total fluorescence released in this run and a subsequent run after dye washout, as in Figures 2 and 3. The time course of turnover of the pool is very similar for the four conditions shown (see figure legend); however, the total fraction of dye released during a single 900 AP train is reduced gradually by increasing MLCK inhibition. At the highest concentration of ML-9 (30 μm), a significant fraction of the fluorescence signal is retained, which lowers the signal-to-noise ratio of this measurement of release kinetics. However, in all conditions the primary impact of MLCK inhibition appears to be in reducing the size of the total releasable pool and not the kinetics of release of this pool. The reduction in pool size, without significant change in kinetics of release, implies that the amount of dye released on a per-action-potential basis must be proportional to the pool size. This is expected for any process obeying first-order kinetics, as is the case here.
Fig. 5.

Kinetics of vesicle pool turnover during MLCK inhibition. Synaptic boutons were loaded with FM1-43, using long AP stimuli, before measuring the kinetics of release of the dye in the presence or absence of varying concentrations of ML-9 (amplitude, ΔF0 in schematic of Fig. 1). A second round of stimulation released the remaining fluorescence after inhibitor washout (amplitude, ΔF1 in schematic of Fig. 1). For each bouton the fluorescence was normalized to ΔFT, the total releasable fluorescence signal from both rounds of unloading. Shown here are population averages of dye release kinetics from populations of boutons of individual experiments in control saline, 10 μm ML-9, 15 μm ML-9, and 30 μm ML-9. The 15 μm and control experiments were performed sequentially on the same boutons, whereas the data for each of the other concentrations were obtained from different experiments. The accompanying control runs for [ML-9] = 10 μm and [ML-9] = 30 μmwere identical to that for the 15 μm run (data not shown). Fluorescence intensity kinetics for each boutoni were fit by using the equationFi(t) = ΔF0e−(t−t0)/αi+ ΔF1, wheret0 marks the start of the stimulus and ΔF0 and ΔF1were fixed as the total fluorescence loss during each run. The following values were obtained for the decay constants: control saline, <α> = 17.7 ± 0.4 sec (n = 39); [ML-9] = 10 μm, <α> = 21.3 ± 1.2 sec (n = 39); [ML-9] = 15 μm, <α> = 20.1 ± 1.3 sec (n = 40); [ML-9] = 30 μm, <α> = 22.8 ± 1.6 sec (n= 25), where the brackets indicate the average value obtained over all αi, and n is the number of boutons measured for each experiment. At [ML-9] = 30 μm, certain boutons release too little fluorescence to extract kinetic parameters (some boutons are near complete inhibition at this concentration; see Fig. 3A). These were excluded from the kinetic analysis performed here. The average inhibition in these data is 22 ± 1.8% ([ML-9] = 10 μm), 35 ± 1.2% ([ML-9]= 15 μm), and 58 ± 2.4% ([ML-9] = 30 μm). The solid line showsF(t), using the average values of α obtained in each case.
The data in Figure 3C indicate that under conditions of maximal inhibition 30–35% of the total pool is still released. This partial block can be explained by a limited efficacy of ML-9 inhibition on MLCK, by the existence of a pathway for vesicle fusion that is independent of MLCK, or by a combination of the two.
ML-9 inhibits release only after 20 AP
The data in Figure 5 indicate that MLCK inhibition reduces the amount of FM1-43 released over a wide range of stimulus numbers (60–900 AP). I designed experiments to measure the impact of MLCK inhibition on vesicle pool turnover for lower numbers of AP. Two factors contribute to limiting the sensitivity of dye release measurements. First, the dissociation rate of FM1-43 from membranes is too slow (∼3 sec; Ryan et al., 1996a; Klingauf et al., 1998) to measure accurately the release kinetics for times less than several seconds. Second, fluctuations arising from photon-counting statistics from fully loaded terminals limit the size of the detectable decreases in fluorescence intensity. To maximize the detection sensitivity of vesicle pool turnover for brief stimuli, I performed dye uptake measurements (Ryan et al., 1997) to characterize the impact of MLCK inhibition in this stimulus range. In this case a varied number of APs,n, is used to load the dye into the vesicle pool, and a long unloading train (900 AP) is used to measure the total uptake, ΔFn (see top, Fig. 1), for a particular load. As in Figure 1, the dye is left in the perfusate for 60 sec beyond the stimulus period to ensure that all vesicles that undergo recycling in response to the action potential train become labeled. Thus, although this method more directly measures dye uptake, it should faithfully track the number, but not the timing, of successful exocytotic events. A second round of loading and release with 900 AP is used to normalize the uptake obtained for nAP as a fraction of the total pool turned over, expressed as ΔFn/ΔF900. Previous measurements have shown that dye uptake and release measurements agree quantitatively (Ryan and Smith, 1995), even at the level of single vesicle turnover (Murthy and Stevens, 1998). Figure6A shows the kinetics of vesicle pool turnover derived from dye uptake measurements in the 0–75 AP range in control conditions. These data show two distinct kinetic regimes for vesicle pool turnover as a function of action potential number. In the range 0–20 AP vesicle pool turnover proceeds at a rate of 0.75%/AP (± 0.08%/AP), whereas in the range of 20–75 AP the rate slows to 0.33%/AP (± 0.007%/AP).
Fig. 6.

MLCK inhibition increases with the number of stimuli. Dye loading assays were used to measure the impact of ML-9 inhibition for low numbers of APs. Synaptic boutons were loaded with varying numbers of AP, n, and unloaded with 900 AP to determine ΔFn. A second run that used 900 AP loading and unloading was used to determine the fraction of the vesicle pool turned over by n AP as ΔFn/ΔF900.A, Fractional vesicle pool turnover in control conditions measured over many experiments at various ndisplays two kinetic regimes. Each regimen, 0–20 AP and 20–75 AP, was fit with a linear dependence on n (dashed lines). The total number of boutons for each nvaried between 26 and 148 obtained from at least two experiments for each n. B, Inhibition produced by 30 μm ML-9 for different n. The degree of inhibition was determined by measuring the amount of dye taken up byn AP in the absence (ΔFncontrol) or presence (ΔFnML-9) of ML-9 sequentially in the same boutons. Inhibition is calculated as (1 − ΔFnML-9/ΔFncontrol). Shown here is the average over a population that varied between 30 and 61 boutons measured in at least two experiments at eachn. Inhibition is near zero for n ≤ 20 AP and gradually increases with the increasing number of AP. A simple model to explain the use dependence of inhibition whereby vesicle pool turnover is 85% inhibited for n > 20 AP, and not inhibited for n ≤ 20 AP, is shown (thick dashed line).
To determine the impact of MLCK inhibition on vesicle turnover in these two kinetic regimes, I measured dye uptake sequentially in control saline and in 30 μm ML-9 for varying numbers of action potentials, n. The uptake obtained in ML-9, ΔFnML-9, was normalized to measurements of uptake obtained in the absence of ML-9, ΔFncontrol, at the same boutons. The degree of inhibition for a given number of action potentials is given by (1 − ΔFnML-9/ΔFncontrol). The amount of inhibition obtained for long action potential trains (≥ 200 AP) is identical to that obtained in direct release experiments, as in Figures 2 and 3. These data show that, for stimulus trains <20 AP, ML-9 does not inhibit vesicle pool turnover. The block caused by ML-9 gradually increases for stimulus trains >20 AP. As in the case with the overall inhibition of dye release, BDM has a qualitatively similar effect. Lower numbers of stimuli are less inhibited by BDM (33% inhibition for 40 AP) than longer action potential trains (48% inhibition for 600 AP) in triggering vesicle pool turnover (Fig.7).
Fig. 7.

Inhibition by BDM is use-dependent. Dye uptake measurements in control saline or 25 mm BDM for 40 and 600 AP were measured sequentially at 46 individual boutons. The total amount of releasable dye taken up during the dye exposure period, ΔF, is shown. As in Figure 6, the inhibition is greater for longer stimuli. The inhibition for 40 AP is 33 ± 7%. The inhibition for 600 AP is 48 ± 7%. Similar results were obtained in three of three experiments.
DISCUSSION
I have shown measurements of the impact of inhibitors of MLCK, primarily the organic inhibitor ML-9, on vesicle pool mobilization during action potential trains. A major concern with such pharmacological studies is the specificity of action of the drug of use. ML-9 and ML-7 are naphthalene sulfonamide derivatives that inhibit MLCK by competing with ATP binding (Saitoh et al., 1987). Although both compounds also will inhibit protein kinase C (PKC) and protein kinase A (PKA), the IC50 values determined here for MLCK inhibition are well below the in vitro values of theKi of inhibition for these kinases (Saitoh et al., 1986). The Ki for inhibition of MLCKin vitro by ML-9 (∼4 μm) is eightfold lower than that for inhibition of PKA and 14-fold lower than that for inhibition of PKC. Similarly ML-7 discriminates against PKA by a factor of 70 over MLCK and by a factor of 140 over PKC. In the experiments shown here, the effects of ML-9 and ML-7 have reached saturation below the concentration at which it is expected to block PKC or PKA (see Fig.3C). ML-9 also has been shown to inhibit L-type Ca2+ channels with an IC50 value of ∼50 μm (Reig et al., 1993); however, vesicle pool turnover is not mediated by this channel subtype in hippocampal neurons (Reuter, 1995). Furthermore, the finding that ML-9 does not alter release kinetics, but instead blocks the size of the releasable pool (see Fig. 5), is not explained easily by the simple block of Ca2+ entry. The concentration range for which ML-9 is effective is most consistent with inhibitory action on MLCK. I cannot rule out the possibility that ML-9 and ML-7 are inhibiting as yet unknown kinases. However, the fact that very specific autoinhibitory peptides of MLCK block a step in vesicle recycling (Mochida et al., 1994), taken together with the effect of ML-9 in an appropriate concentration range, strongly suggests that the predominant substrate for ML-9 action in these experiments is MLCK. I also have shown that the myosin ATPase inhibitor BDM behaves in a qualitatively similar manner, albeit at much higher concentrations. At present there are no high-potency inhibitors of myosin, and the specificity of action of BDM in these assays is much less certain. Nonetheless, the general agreement with the MLCK inhibitor data is consistent with a role of both actin–myosin interactions and MLCK in the mobilization of synaptic vesicles. Higher concentrations of ML-9 (≥ 50 μm) cause a modest increase in spontaneous vesicle recycling in addition to the block of vesicle pool mobilization (data not shown). In this concentration range, however, both PKA and PKC are expected to be inhibited.
Previous studies have indicated that kinase inhibition by staurosporine also blocks the efficiency of fluorescence destaining in nerve terminals labeled with endocytic tracers (Henkel and Betz, 1995;Klingauf et al., 1998). In that case, however, staurosporine failed to block significantly either the dye uptake or the neurotransmitter release. These data led to the hypothesis that staurosporine inhibition resulted in a drastic reduction in the time scale of endocytosis and not simply in the amount exocytosis. In this scenario, the unbinding time of FM dyes would exceed the time frame of endocytosis, but the time of dye binding would not. In the experiments shown here, the degree of inhibition obtained with ML-9 in dye uptake is identical to that achieved with dye release for prolonged trains (see Fig.5B). Furthermore, the t½ for labeling vesicles after a stimulus was unaltered by ML-9 exposure (see Fig. 4). Thus ML-9 does not appear to act on the endocytic branch of vesicle recycling but, rather, upstream of these events. Recently,Kuromi and Kidokoro (1998) demonstrated that during endocytosis a distal reserve pool could be replenished in a cytochalasin D-dependent manner. The equivalent of this pool in the hippocampal synaptic terminals studied here is still unclear, because it is accessed only in the Drosophila neuromuscular junction by first blocking endocytosis and then depleting the total pool by stimulation of the presynaptic terminal. Here I find no evidence for myosin dependence during endocytosis; however, this does not rule out the possibility that such a pathway can be engaged under some yet-to-be-uncovered conditions.
I present data indicating that vesicle pool turnover for 20 or fewer AP is more efficient on a per-action-potential basis than for longer stimulus trains (see Fig. 6A). This is consistent with recent findings (Dobrunz and Stevens, 1997) that the vesicles recruited for exocytosis by the first 10–20 AP represent a readily releasable pool and correspond closely to the total number of docked vesicles (Stevens and Tsujimoto, 1995). In the data presented here, the vesicles recruited for exocytosis by the first 20 AP correspond to 17% of the total recycling pool. This exceeds the estimated number of docked vesicles in cultured hippocampal neurons by a factor of two (Schikorski and Stevens, 1997); however, differences in culture age and preparation might cause this number to vary. My findings that ML-9 inhibition begins only after the first 20 AP suggest that MLCK is involved directly in replacing docked vesicles after their depletion. Further experiments, however, correlating the vesicles consumed during this period of stimulation with the ultrastructurally docked vesicles will be required to determine whether these two pools of vesicles are identical. The initial pool released during the first 20 AP represents 17 ± 1.2% of the total recycling pool, yet during maximal inhibition with long action potential trains ∼30–35% of the labeled pool is turned over. Thus, during the slower phase of vesicle pool turnover, an additional 13–18% of the pool appears to be mobilized by an MLCK-independent pathway or escapes blockade by ML-9. At present, my experiments cannot distinguish between these two possibilities. The dashed line in Figure 6B is derived from a simple model in which vesicle fusion proceeds for the first 20 AP via an MLCK-independent pathway and thereafter via a pathway that can be 85% inhibited by block of MLCK.
These data are consistent with several previous findings. In sympathetic neurons (Mochida et al., 1994) the injection of an inhibitory MLCK peptide-pseudosubstrate resulted in an activity-dependent block of neurotransmitter release. In chromaffin cells MLCK inhibitors appear to block a step before the priming of exocytotic vesicles (Kumakura et al., 1994). The experiments presented here suggest that MLCK activity is required specifically to deliver vesicles to a readily releasable pool in synaptic terminals. The pharmacologically induced phenotype described here is reminiscent of the effects of ablation of the synapsin I gene. In synapsin I-deficient synaptic terminals the size of the recycling pool is reduced as compared with wild type, but the kinetics of release of the pool is not (Ryan et al., 1996b). Thus, MLCK and synapsin may be involved in closely related steps in the synaptic vesicle cycle; alternatively, ML-9 directly might block the action of a different unknown kinase important for synapsin function.
Because MLCK is regulated tightly by Ca2+/calmodulin, this enzyme potentially provides a critical link between the elevation of intracellular Ca2+ leading both to membrane fusion and consumption of synaptic vesicles with replacement of those vesicles from a reserve pool. The specific myosin substrate for MLCK in synaptic terminals currently is unknown, although both myosin II and myosin V have been localized to this cellular region (Espreafico et al., 1992; Mochida et al., 1994; Prekeris and Terrian, 1997).
Although these data are most consistent with a role of MLCK in the movement of vesicles through the cluster during sustained stimulation, my experiments do not rule out a possible additional role of MLCK in the postendocytotic movement of newly formed vesicles back to the synaptic vesicle cluster (repriming).
Myosin-based transport of synaptic vesicles thus likely appears to be required for the mobilization of a large fraction of the recycling vesicle pool during repetitive action potential firing in synaptic terminals. The data presented here indicate that engagement of this pool is regulated by MLCK, the activity for which has been shown to be modulated by a number of signal transduction pathways (Gallagher et al., 1997). This MLCK pathway thus is poised to serve as a sensitive substrate for the modulation of presynaptic function.
Footnotes
This work was supported by National Institutes of Health Grant NS 36942. I thank F. Maxfield, T. McGraw, P. Greengard, and H. Reuter for useful discussions during the course of this work and M. Delemos for excellent technical assistance.
Correspondence should be addressed to Dr. Timothy A. Ryan, Department of Biochemistry, Room E-107, The Weill Medical College of Cornell University, 1300 York Avenue, New York, NY 10021.
REFERENCES
- 1.Berl S, Puszkin S, Nicklas WJ. Actomyosin-like protein in brain. Science. 1973;179:441–446. doi: 10.1126/science.179.4072.441. [DOI] [PubMed] [Google Scholar]
- 2.Betz WJ, Bewick GS. Optical analysis of synaptic vesicle recycling at the frog neuromuscular junction. Science. 1992;255:200–203. doi: 10.1126/science.1553547. [DOI] [PubMed] [Google Scholar]
- 3.Betz WJ, Bewick GS. Optical monitoring of transmitter release and synaptic vesicle recycling at the frog neuromuscular junction. J Physiol (Lond) 1993;460:287–309. doi: 10.1113/jphysiol.1993.sp019472. [DOI] [PMC free article] [PubMed] [Google Scholar]
- 4.Cramer LP, Mitchison TJ. Myosin is involved in postmitotic cell spreading. J Cell Biol. 1995;131:179–189. doi: 10.1083/jcb.131.1.179. [DOI] [PMC free article] [PubMed] [Google Scholar]
- 5.Dobrunz L, Stevens CF. Heterogeneity of release probability, facilitation, and depletion at central synapses. Neuron. 1997;18:995–1008. doi: 10.1016/s0896-6273(00)80338-4. [DOI] [PubMed] [Google Scholar]
- 6.Espreafico EM, Cheney RE, Matteoli M, Nascimento AA, De Camilli PV, Larson RE, Mooseker MS. Primary structure and cellular localization of chicken brain myosin-V (p190), an unconventional myosin with calmodulin light chains. J Cell Biol. 1992;119:1541–1557. doi: 10.1083/jcb.119.6.1541. [DOI] [PMC free article] [PubMed] [Google Scholar]
- 7.Gallagher P, Herring BP, Stull JT. Myosin light chain kinases. J Muscle Res Cell Motil. 1997;18:1–16. doi: 10.1023/a:1018616814417. [DOI] [PubMed] [Google Scholar]
- 8.Hay JC, Scheller RH. SNAREs and NSF in targeted membrane fusion. Curr Opin Cell Biol. 1997;9:505–512. doi: 10.1016/s0955-0674(97)80026-9. [DOI] [PubMed] [Google Scholar]
- 9.Henkel AW, Betz WJ. Staurosporine blocks evoked release of FM1-43 but not acetylcholine from frog motor nerve terminals. J Neurosci. 1995;15:8246–8258. doi: 10.1523/JNEUROSCI.15-12-08246.1995. [DOI] [PMC free article] [PubMed] [Google Scholar]
- 10.Henkel AW, Lübke J, Betz WJ. FM1-43 dye ultrastructural localization in and release from frog motor nerve terminals. Proc Natl Acad Sci USA. 1996;93:1918–1923. doi: 10.1073/pnas.93.5.1918. [DOI] [PMC free article] [PubMed] [Google Scholar]
- 11.Isaacson JS, Hille B. GABAB-mediated presynaptic inhibition of excitatory transmission and synaptic vesicle dynamics in cultured hippocampal neurons. Neuron. 1997;18:143–152. doi: 10.1016/s0896-6273(01)80053-2. [DOI] [PubMed] [Google Scholar]
- 12.Klingauf J, Kavali ET, Tsien RW. Kinetics and regulation of fast endocytosis at hippocampal synapses. Nature. 1998;394:581–585. doi: 10.1038/29079. [DOI] [PubMed] [Google Scholar]
- 13.Kumakura K, Sasaki K, Sakurai T, Ohara-Imaizumi M, Misonou H, Nakamura S, Matsuda Y, Nonomura Y. Essential role of myosin light chain kinase in the mechanism for Mg-ATP-dependent priming of exocytosis in adrenal chromaffin cells. J Neurosci. 1994;14:7695–7703. doi: 10.1523/JNEUROSCI.14-12-07695.1994. [DOI] [PMC free article] [PubMed] [Google Scholar]
- 14.Kuromi H, Kidokoro Y. Two distinct pools of synaptic vesicles in single presynaptic boutons in a temperature-sensitive Drosophila mutant shibire. Neuron. 1998;20:917–925. doi: 10.1016/s0896-6273(00)80473-0. [DOI] [PubMed] [Google Scholar]
- 15.Mochida S, Kobayashi H, Matsuda Y, Yuda Y, Muramoto K, Nonomura Y. Myosin II is involved in transmitter release at synapses formed between rat sympathetic neurons in culture. Neuron. 1994;13:1131–1142. doi: 10.1016/0896-6273(94)90051-5. [DOI] [PubMed] [Google Scholar]
- 16.Murthy VN, Stevens CF. Synaptic vesicles retain their identity through the synaptic vesicle cycle. Nature. 1998;392:497–501. doi: 10.1038/33152. [DOI] [PubMed] [Google Scholar]
- 17.Murthy VN, Sejnowski TJ, Stevens CF. Heterogeneous release properties of visualized individual hippocampal synapses. Neuron. 1997;18:599–612. doi: 10.1016/s0896-6273(00)80301-3. [DOI] [PubMed] [Google Scholar]
- 18.Prekeris R, Terrian D. Brain myosin V is a synaptic vesicle-associated motor protein: evidence for a Ca2+-dependent interaction with the synaptobrevin–synaptophysin complex. J Cell Biol. 1997;137:1589–1601. doi: 10.1083/jcb.137.7.1589. [DOI] [PMC free article] [PubMed] [Google Scholar]
- 19.Reig JA, Viniegra S, Ballesta JJ, Palmero M, Guitierrez LM. Naphthalene sulfonamide derivatives ML-9 and W7 inhibit catecholamine secretion in intact and permeabilized chromaffin cells. Neurochem Res. 1993;18:317–323. doi: 10.1007/BF00969089. [DOI] [PubMed] [Google Scholar]
- 20.Reuter H. Measurements of exocytosis from single presynaptic nerve terminals reveal heterogeneous inhibition by Ca2+-channel blockers. Neuron. 1995;14:773–779. doi: 10.1016/0896-6273(95)90221-x. [DOI] [PubMed] [Google Scholar]
- 21.Reuter H, Porzig H. Localization and functional significance of the Na+/Ca2+ exchanger in presynaptic boutons of hippocampal cells in culture. Neuron. 1995;15:1077–1084. doi: 10.1016/0896-6273(95)90096-9. [DOI] [PubMed] [Google Scholar]
- 22.Ryan TA, Smith SJ. Vesicle pool mobilization during action potential firing. Neuron. 1995;14:983–989. doi: 10.1016/0896-6273(95)90336-4. [DOI] [PubMed] [Google Scholar]
- 23.Ryan TA, Reuter H, Wendland B, Schweizer FE, Tsien RW, Smith SJ. The kinetics of synaptic vesicle recycling measured at single presynaptic boutons. Neuron. 1993;11:713–724. doi: 10.1016/0896-6273(93)90081-2. [DOI] [PubMed] [Google Scholar]
- 24.Ryan TA, Smith SJ, Reuter H. The timing of synaptic vesicle endocytosis. Proc Natl Acad Sci USA. 1996a;93:5567–5571. doi: 10.1073/pnas.93.11.5567. [DOI] [PMC free article] [PubMed] [Google Scholar]
- 25.Ryan TA, Li L, Chin L-S, Greengard P, Smith SJ. Synaptic vesicle recycling in synapsin I knock-out mice. J Cell Biol. 1996b;5:1219–1227. doi: 10.1083/jcb.134.5.1219. [DOI] [PMC free article] [PubMed] [Google Scholar]
- 26.Ryan TA, Reuter H, Smith SJ. Optical detection of presynaptic quantal membrane turnover. Nature. 1997;388:478–482. doi: 10.1038/41335. [DOI] [PubMed] [Google Scholar]
- 27.Saitoh M, Naka M, Hidaka H. The modulatory role of myosin light chain kinase phosphorylation in human platelet activation. Biochem Biophys Res Commun. 1986;140:280–287. doi: 10.1016/0006-291x(86)91087-9. [DOI] [PubMed] [Google Scholar]
- 28.Saitoh M, Ishikawa T, Matsushima S, Naka M, Hidaka H. Selective inhibition of catalytic activity of smooth muscle myosin light chain kinase. J Biol Chem. 1987;262:7796–7801. [PubMed] [Google Scholar]
- 29.Schiavo G, Gmachl MJ, Stenbeck G, Sollner TH, Rothman JE. A possible docking and fusion particle for synaptic transmission. Nature. 1995;378:733–776. doi: 10.1038/378733a0. [DOI] [PubMed] [Google Scholar]
- 30.Schikorski T, Stevens CF. Quantitative ultrastructural analysis of hippocampal excitatory synapses. J Neurosci. 1997;17:5858–5867. doi: 10.1523/JNEUROSCI.17-15-05858.1997. [DOI] [PMC free article] [PubMed] [Google Scholar]
- 31.Stevens CF, Tsujimoto T. Estimates of the pool size of releasable quanta at a single central synapse and for the time required to refill the pool. Proc Natl Acad Sci USA. 1995;92:846–849. doi: 10.1073/pnas.92.3.846. [DOI] [PMC free article] [PubMed] [Google Scholar]
- 32.Stevens CF, Wesseling JF. Activity-dependent modulation of the rate at which synaptic vesicles become available to undergo exocytosis. Neuron. 1998;21:415–424. doi: 10.1016/s0896-6273(00)80550-4. [DOI] [PubMed] [Google Scholar]
- 33.Sudhof TC. The synaptic vesicle cycle: a cascade of protein–protein interactions. Nature. 1995;375:645–653. doi: 10.1038/375645a0. [DOI] [PubMed] [Google Scholar]
- 34.Wang L-Y, Kaczmarek LK. High-frequency firing helps replenish the readily releasable pool of synaptic vesicles. Nature. 1998;394:384–388. doi: 10.1038/28645. [DOI] [PubMed] [Google Scholar]
- 35.Wu LG, Betz WJ. Nerve activity but not intracellular calcium determines the time course of endocytosis at the frog neuromuscular junction. Neuron. 1996;17:769–779. doi: 10.1016/s0896-6273(00)80208-1. [DOI] [PubMed] [Google Scholar]