

Abstract
We have investigated whether rat motor nerve terminals with different in vivo activity patterns also have different vesicle trafficking characteristics. To do this, we monitored, using combined optical and electrical techniques, the rate of exocytosis (during different frequencies and patterns of activity), the releasable pool size, and the recycle time of synaptic vesicles in terminals on soleus (slow-twitch) and extensor digitorum longus [(EDL); fast-twitch] muscle fibers. EDL terminals had a higher initial quantal content (QC) than soleus, but during tonic or phasic stimulation at 20–80 Hz, EDL QC ran down to a greater extent than soleus QC. By recording loss of fluorescence from exocytosing vesicles labeled with the dye FM1–43, EDL terminals were found to destain faster than those in soleus. Simultaneous intracellular recording of end plate potentials, to count the number of vesicles released, permitted estimation of the total vesicle pool (VP) size and the recycle time by combining the optical and electrophysiological data. Soleus vesicle pool was larger than EDL, but recycle time was not significantly different. These terminals, therefore, are adapted to their in vivo activity patterns by alterations in QC and VP size but not recycle time.
Keywords: synaptic vesicles, vesicle recycling, FM1–43, exocytosis, quantal content, neuromuscular junction
The adaptation of neurotransmitter release to a pattern of activity of a neuron in vivois essential for normal functioning throughout the nervous system. For motoneurons, this suggests that the terminals innervating tonically active postural muscles might be better adapted for sustained transmitter release than those innervating less frequently used phasic muscles (Henneman et al., 1965; Henneman and Olson, 1965) and that this might be reflected in differences in nerve terminal structure and synaptic vesicle trafficking. We have addressed this issue by comparing vesicular release from motor nerve terminals in two rat skeletal muscles with very different patterns of activity: the extensor digitorum longus (EDL) and the soleus.
The EDL is a fast-twitch muscle that is easily fatigued. Terminals in EDL are active in short bursts (∼1% of animal’s activity time) at a high frequency (80 Hz) (Hennig and Lømo, 1985). In contrast, the slow-twitch soleus is fatigue-resistant, with terminals that are active for prolonged periods (∼30% of activity time) at a low frequency (20 Hz). Although the properties of neurotransmitter release from terminals in muscles with differing contractile characteristics have been investigated previously (Tonge, 1974; Gertler and Robbins, 1978;Coniglio et al., 1993; Connor et al., 1997), stimulation paradigms were not based on known in vivo activity patterns. Furthermore, recording methods now known to be inaccurate (McLachlan, 1978; Slater et al., 1992) were used in some of those studies.
Our initial investigations showed that soleus nerve terminals sustained release better than those in EDL during tonic stimulation at 20 Hz. We therefore went on to analyze the cellular processes that might account for these differences. In particular, we wanted to know whether the kinetics of vesicle recycling were different in nerve terminals adapted to such different in vivo activity patterns. We therefore monitored the kinetics of recycling synaptic vesicles by labeling them with the fluorescent styryl pyridinium dye FM1–43 (Betz and Bewick, 1992; Betz et al., 1992). Stimulation of labeled terminals resulted in decreased fluorescence because exocytosis of vesicular neurotransmitter also produced dye release. Monitoring vesicle exocytosis by simultaneous time lapse imaging of dye loss and standard intracellular recording of postsynaptic potentials (Betz and Bewick, 1993), we compared synaptic vesicle trafficking parameters in EDL and soleus motor nerve terminals at 20 Hz. To obtain a more detailed picture of how terminals adapted to different activity patterns differ in vesicle recycling characteristics, we then investigated the effect of changing the patterns and frequency of stimulation.
Some of this data has appeared in preliminary form (Reid and Bewick, 1996, 1997).
MATERIALS AND METHODS
Many of the techniques used here have been described in detail elsewhere (Betz and Bewick, 1992, 1993; Betz et al., 1993; Ribchester et al., 1994) and will only be reviewed briefly.
Dissection and terminal labeling. Large (>350 gm) male Sprague Dawley rats were used because their EDL and soleus muscles contain an almost homogeneous fiber type. We have confirmed, by myofibrillar ATPase assay (Brooke and Kaiser, 1969) on frozen sections, that EDL and soleus muscles from male rats of this size contain at least 95% fast fibers (96.56%) and slow fibers (97.15%), respectively. Rats were stunned and then killed by cervical dislocation, and EDL and soleus nerve–muscle preparations were dissected. Preparations were mounted in silicon rubber (Sylgard; Dow Corning, Stade, Germany)-lined dishes and soaked for 20 min in 1 μm FM1–43 (Molecular Probes, Leiden, The Netherlands) dissolved in gassed (95% O2–5% CO2) saline (Liley, 1956). The saline was of the following composition (in mm): NaCl 138.8, KCl 4, NaHCO3 12, KH2PO4 1, MgCl2 1, CaCl2 2, and glucose 11. The nerve was taken up into a suction electrode, and synaptic vesicles were labeled by nerve stimulation in the FM1–43 solution. Dye was taken up into the vesicles during activity-induced vesicle turnover. The stimulation regimen for labeling was alternating short trains of 10 (10 sec) and 1 (5 sec) Hz for 15 min. This regimen was designed to stimulate cycling of as many vesicles as possible without stressing the terminal. Longer stimulation times did not result in brighter terminal labeling, suggesting that this regimen fully loaded the terminals. The stimulation pulses were applied via an AMPI Master-8 pulse generator and an AMPI Iso-flex amplifier/stimulus isolator (Intracel Ltd., Issaquah, WA). Before imaging, preparations were washed in gassed dye-free saline for 30 min to remove dye that had partitioned into external membranes.
Muscle fiber diameter. Fiber diameters were determined from mature (16–18 weeks) and 6-week-old rats. The midsection of the muscle was cut out with a scalpel blade and wrapped in a strip of ox liver to provide support during freezing. This was done in isopentane cooled to −176°C with liquid nitrogen. Sections 10-μm-thick were made using a Reichert-Jung Cryocut E cryostat and labeled for ATPase activity (Brooke and Kaiser, 1969). Images were acquired using the system described below. Analysis was performed using Openlab software (ImproVision Ltd., Coventry, UK). Freehand lines were drawn around each fiber, and the diameter was derived from the perimeter.
Imaging. Stimulation of labeled terminals led to destaining as dye-filled vesicles released neurotransmitter and dye simultaneously during exocytosis. To monitor exocytosis optically, images were acquired at 10 sec intervals from individual terminals during 10 min of activity-dependent destaining. To prevent contraction, muscles were paralyzed by exposure to either 5 μmd-tubocurarine (Sigma, Poole, UK) for 20–30 min to block the binding of acetylcholine to its receptor or 2 μmμ-conotoxin GIIIB (Sigma) for 30–40 min to selectively block muscle voltage-gated sodium channels (Plomp et al., 1992). Images were acquired using a cooled charge-coupled device camera (Mono Coolview; Photonic Science, East Sussex, UK) attached to an M2B microscope (Micro Instruments Ltd.). Terminals were viewed through a Zeiss (Oberkochen, Germany) 40× water immersion objective (0.75 NA) and illuminated with a Prior Scientific (Cambridge, UK) HB100 mercury arc light source through a standard FITC filter set (B2A; Nikon, Surrey, UK). To reduce photobleaching and phototoxicity, a suitable en facesuperficial terminal was quickly located using light attenuated by neutral density filters to, at most, 3.13% of full lamp intensity. Thereafter, fluorescent illumination occurred only during image capture. Illumination times were controlled via a Uniblitz D122 shutter driver (Vincent Associates, Rochester, NY) in the light path. During image acquisition, light intensity was further attenuated by neutral density filters to 1.56 or 0.78% of maximum intensity. Biovision or Openlab software (ImproVision Ltd.) controlled the shutter opening times and camera (exposures were 8–8.4 sec), and images were saved onto an Apple PowerMac computer.
Intracellular recording. Standard electrophysiological techniques were used to record miniature end plate potentials (MEPPs) and evoked EPPs during destaining using glass microelectrodes filled with 3 m KCl. Muscle fibers were impaled ∼50–100 μm from the terminal to be imaged, thus minimizing decay of the synaptic signal (Auerbach and Betz, 1971) but avoiding mechanical distortion of the terminal. Initial resting membrane potentials were more negative than −75 mV and, after an initial fall, were stable during the experiment and greater than −50 mV. Potentials were recorded via an Axoclamp 2B amplifier (Axon Instruments, Foster City, CA) and stored simultaneously on a digital tape recorder (Bio Logic DTR-1204; Intracel Ltd.) and the hard drive of a Walters 286 personal computer running Strathclyde Electrophysiology Software Whole-Cell Program (WCP V1.2; John Dempster, Department of Physiology and Pharmacology, University of Strathclyde, Glasgow, UK).
Data analysis. Analysis of terminal destaining was performed using NIH Image software (http://rsb.info.nih.gov/nih-image/). Briefly, all fluorescently labeled regions of a terminal that were in focus were selected for measurement of pixel intensity. A background region was also selected, and the data were background-subtracted to give a value of “net intensity” and to account for variability between preparations. The data for all the images of a time series were compiled and analyzed using Excel (Microsoft, Bellevue, WA). To allow comparison of the rates of destain between different terminal types, the net intensity data in pixel intensity units (PIU) were converted into percentage of units of dye loss, such that the dye lost by a terminal at the start of the experiment was 0% and at the end of 10 min stimulation (60 images) was 100%. For example, the percentage of dye lost after n number of images is:
where 0 and 60 are the first and last images, respectively.
Initial quantal contents (QC) were determined using the direct method, i.e., the mean amplitude of the first EPP of the stimulus train was divided by the mean MEPP amplitude and then corrected for nonlinear summation (Martin, 1955). Reversal potential was assumed to be zero. Vesicle recycle time (RT) was determined by superimposing dye loss and summed QC data from the same terminal at time 0 and then scaling the dye loss curve to fit the summed QC data for as long as possible during the early stages of stimulation (Betz and Bewick, 1993) (see Figs. 6, 7). Using this method, the dye loss curve invariably fell below the summed QC after ∼2 min. This deviation was interpreted (Betz and Bewick, 1992) as being attributable to vesicles that have previously lost their dye being released a second time, producing an electrical event but no dye loss. RT was determined by eye as the minimum time at which divergence of the two signals was apparent (see Fig. 7, inset). This time has been shown to be equivalent in accuracy to the time determined by mathematical best fit prediction (Betz and Bewick, 1993).
Fig. 6.

Correlation of cumulative transmitter release (summed QC) and dye loss during the first 100 sec of destaining. Transmitter release is proportional to dye loss during this time because in fully loaded terminals, every vesicle that releases transmitter also loses dye (n = 10 terminals). These data were aligned manually by adjusting the dye loss scale so that the lines correspond for as long as possible during stimulation.
Fig. 7.

During prolonged continuous stimulation, dye loss begins to lag behind transmitter release (summed QC) after a period of ∼110 sec (n = 10 terminals). Dye loss falls below transmitter release when vesicles that have previously lost their dye reenter the vesicle pool and again undergo exocytosis but this time release transmitter but not dye. The time of first deviation between the two lines was determined by eye. This “vesicle recycle time” shows no significant difference between EDL and soleus (Table 1). Theinset shows the trace from a single terminal; the point of deviation is indicated with an arrow.
Percentage dye lost per EPP was calculated as: % dye lost before RT ÷ number of EPPs recorded by same time.
Releasable vesicle pool (VP) size was determined as: (100 ÷ % dye lost before RT) × summed QC at same time.
In turn, the percentage of the vesicle pool released per initial EPP is: (QC ÷ VP) × 100.
Statistics. Average data are shown as mean ± SE. The statistical significance of differences between means was tested using Student’s t test for samples of equal or unequal variances, as appropriate, and curve fitting was performed via MacCurveFit 1.1.1 (Kevin Raner Software, Mt. Waverley, Victoria, Australia) using the Marquardt–Levenberg algorithm.
RESULTS
Quantal release in EDL versus soleus
Rat EDL terminals release more vesicles per impulse (QC) than soleus terminals for isolated stimuli or low-frequency stimulation trains (Gertler and Robbins, 1978; Wood and Slater, 1997). However, such conditions do not reflect the in vivo activity patterns experienced by terminals in either muscle. EDL terminals are active at high frequency for a few seconds, whereas soleus terminals are active for many minutes at a constant 20 Hz (Hennig and Lømo, 1985). Thus, very different vesicle trafficking parameters may be involved in vivo. We therefore began by examining quantal release in the two muscles during tonic 20 Hz stimulation.
Neither MEPP amplitude (EDL, 0.28 ± 0.01 mV; soleus, 0.28 ± 0.02 mV; n = 10) nor initial MEPP frequency (EDL, 2.7 ± 0.4/sec; soleus, 3.0 ± 0.7/sec; n = 10) were significantly different between the two muscles. These MEPP amplitudes were lower, and their frequencies were higher than those measured previously in 6- to 8-week-old rats (Wood and Slater, 1997). However, this is in line with age-dependent changes in MEPP size and frequency described previously in mouse EDL and soleus (Schofield and Marshall, 1980). For example, mean MEPP amplitude in young mice (4–6 weeks) was 1.3 mV, decreasing to 0.5 mV in mature mice (6–10 weeks), whereas MEPP frequency increased from 2/sec to 9.5/sec. These changes were attributed to an increase in muscle fiber diameter and a decrease in membrane resistance. Fiber diameters in the rats used here (at least 350 gm; 16- to 18-week-old) are significantly larger than those in 6-week-old rats. EDL fast-fiber diameters were 64.98 ± 0.82 μm in mature rats compared with 42.12 ± 0.56 μm in young rats (p < 0.001; n = 50).
Immediately after 10 min stimulation at 20 Hz, although MEPP frequency was significantly increased (EDL, 8.1 ± 1.3/sec; soleus, 9.9 ± 2.1/sec; n = 10; p < 0.01 for both muscles), the amplitude was unchanged (EDL, 0.26 ± 0.01 mV; soleus, 0.27 ± 0.02 mV; n = 10; p> 0.1 for both), indicating that postsynaptic sensitivity to ACh had not changed and vesicle filling with neurotransmitter was complete, even after prolonged stimulation.
The initial QC of EPPs was significantly higher for EDL than for soleus (101.50 ± 4.43 vs 86.91 ± 4.48; n = 35 and 29, respectively; p < 0.03), confirming previous findings (Table 1) (Gertler and Robbins, 1978; Wood and Slater, 1997). However, by monitoring the EPP amplitude throughout the experiment, it was clear that the EPP amplitude ran down continuously during the stimulation period for both muscles (Fig.1). EPP rundown was much more marked in EDL than in soleus terminals and especially during the second half of the stimulation period (Fig. 1A). Figure1B shows the results from 10 muscles of each type; EDL QC on average dropped by 90.16%, whereas soleus QC dropped by only 65.74% between the beginning and end of the 10 min stimulation period. Because MEPP amplitude was unchanged at the end of stimulation, the rundown in EPP amplitude was entirely caused by a fall in the number of vesicles released per impulse (QC). This decline had at least three components. The fastest had a duration of <1 sec and has been interpreted by others as reflecting the depletion of a pool of “readily releasable” vesicles (Kamenskaya et al., 1975; Glavinovic 1979a). This component was too short-lived to be detectable in Figure1B. The two components evident in Figure1B could be well described as the sum of two exponential curves (R2 > 0.99 for both muscles). The fast component of decline had a time constant (τ) of 7.2 sec in EDL and 9.7 sec in soleus. The slowest component of EPP depression had a τ of 139 sec in EDL as opposed to 176 sec in soleus. Although the anatomical basis of any of these components is unknown, functionally it results in soleus terminals being better adapted to continuous activity than EDL terminals, as expected from their activity patterns in vivo.
Table 1.
Synaptic vesicle recycling parameters from terminals stimulated continuously at 20 Hz
| EDL | Soleus | t test | |
|---|---|---|---|
| Mean initial QC* | 101.50 ± 4.43 | 86.91 ± 4.48 | p < 0.03 |
| % dye per EPP | 0.029 ± 0.002 | 0.021 ± 0.001 | p < 0.01 |
| Vesicle pool size | 178,081 ± 13,587 | 252,750 ± 21,467 | p < 0.01 |
| % vesicle pool lost per initial EPP | 0.059 ± 0.004 | 0.036 ± 0.003 | p < 0.001 |
| % vesicle pool lost in 2 min | 55.8 ± 3.71 | 45.44 ± 0.96 | p < 0.02 |
| Recycle time (sec) | 109.6 ± 11.2 | 119.0 ± 10.2 | NS |
Synaptic vesicle recycling parameters from terminals stimulated continuously at 20 Hz [n = 10 except where indicated (*) in which n = 35 for EDL and 29 for soleus]. Exocytosis of FM1-43 labeled vesicles was monitored in individual terminals by simultaneously measuring dye loss and quantal transmitter release. Initially, dye loss and summed quantal release rates are equivalent because all vesicles contain dye and therefore both lose dye and release transmitter during exocytosis. Later, a sustained deviation between dye loss and summed transmitter release occurs as recycled vesicles, which have already lost their dye, reenter the vesicle pool and undergo exocytosis again, but this time releasing transmitter but no dye. These events allow the calculation of various parameters: % dye per EPP = percentage of dye lost at recycle time ÷ number of stimuli by same time. Vesicle pool size (VP) = (100 ÷ percentage of dye loss at recycle time) × total number of vesicles released by that time; for example, if the release of 50,000 vesicles results in 40% dye loss, then VP = 50,000 × (100/40) = 125,000. % vesicle pool lost per initial EPP = (initial QC/VP). % vesicle pool lost in 2 min = (number of quanta released in 2 min/VP) × 100. Recycle time, Time in seconds after which a sustained deviation between dye loss and summed transmitter release occurs. All the parameters, except vesicle recycle time, show highly significant differences between EDL and soleus terminals.
Fig. 1.

A, Electrophysiological recordings from muscle fibers innervated by motor nerve terminals stimulated at a constant 20 Hz. Spontaneous MEPPs (top) were recorded for 2–3 min before and after stimulation. Evoked EPPs (bottom) were recorded throughout the 10 min stimulation period. There were no significant differences in MEPP amplitude or frequency between EDL and soleus terminals before stimulation.B, Mean QC against time during stimulation at 20 Hz for EDL and soleus terminals (n = 10). Upon stimulation, QC ran down rapidly; EDL QC ran down faster and to a greater extent than soleus. The greater ability of soleus terminals to maintain adequate quantal release during prolonged 20 Hz stimulation is consistent with their in vivo activity pattern.
The apparent adaptation of soleus terminals to tonic stimulation, indicated by these studies, could be caused by several factors: (1) larger vesicle pools and therefore lower fractional release per impulse; (2) faster vesicle recycling; or (3) a combination of 1 and 2.
We therefore went on to use FM1–43 labeling (Betz and Bewick, 1992,1993) to compare vesicle recycling times in these terminals. We also developed an elaboration of the original technique so that we could make estimates of the total VP size.
Morphology of nerve terminals in EDL and soleus and their destaining
Figure 2 shows various nerve terminals on EDL (above) and soleus (below) muscle fibers after labeling with FM1–43 and washing. The staining highlights apparent morphological differences between these terminal types in adult rat muscle. EDL terminals are approximately circular, with an absence of dye in the very center and the dye distributed in an almost continuous ribbon. In contrast, soleus terminals are significantly elongated along the muscle fiber long axis. Labeling of soleus terminals is usually in a greater number of separate regions, and there is frequently an area free from dye on one side of the terminal, near the point of nerve entry. There is, however, no difference in terminal area (measured as FM1–43 fluorescence) between adult EDL and soleus (370 ± 105.8 vs 388.2 ± 129.8 μm2; n = 100; p > 0.2). These morphological data are the subject of further study and will be reported in detail elsewhere.
Fig. 2.

Examples of EDL (top) and soleus (bottom) motor nerve terminals after activity-dependent labeling with the fluorescent dye FM1–43 and washing. Thelongitudinal axes of the muscle fibers are aligned approximately vertically in these pictures. Bright regions indicate clusters of thousands of labeled vesicles. Morphological differences are apparent; soleus terminals are elongated along the muscle fiber, and their labeling is in smaller but more numerous spots. There is, however, no difference in terminal area or initial labeling intensity between EDL and soleus. Scale bar, 10 μm.
Stimulation of labeled terminals caused dye loss as vesicle exocytosis took place. Figure 3 shows an EDL terminal (above) and a soleus terminal (below) after 0, 5, and 10 min stimulation at 20 Hz. From these images, it appears that, although there is variability in initial intensities, the different terminal regions all destain at similar rates, as shown previously in the frog (Betz and Bewick, 1992). To test the validity of this impression, the brightness of various areas of the terminal was determined before and during destaining. The image of the terminal in Figure 4A was acquired at the start of the experiment, and the results of the analysis are shown in Figure 4B. Regions of interest are marked to show how analysis was performed on all in-focus regions of a terminal. Background intensity was subtracted to yield the net intensity of all the labeled regions. Analysis of the initial pixel intensity revealed considerable variation between the different regions of this terminal (from 51 to 100 PIU; mean, 78 ± 3.58; n = 14). The average initial brightness of whole terminals, however, did not differ between EDL and soleus (EDL, 41.05 ± 3.14 PIU; soleus, 48.53 ± 4.27 PIU; n = 23 and 25, respectively;p > 0.05).
Fig. 3.

Nerve stimulation causes labeled terminals to destain as vesicles undergo exocytosis and lose their dye. An EDL (top) and a soleus (bottom) terminal are shown at three different time points during continuous stimulation at 20 Hz. Terminals lose most dye during the first 2–3 min of the experiment. The activity-dependent destaining of terminals is rapid and is independent of the very slow activity-independent dye loss displayed in axonal regions (arrows) (see Fig. 4). Scale bar, 10 μm.
Fig. 4.
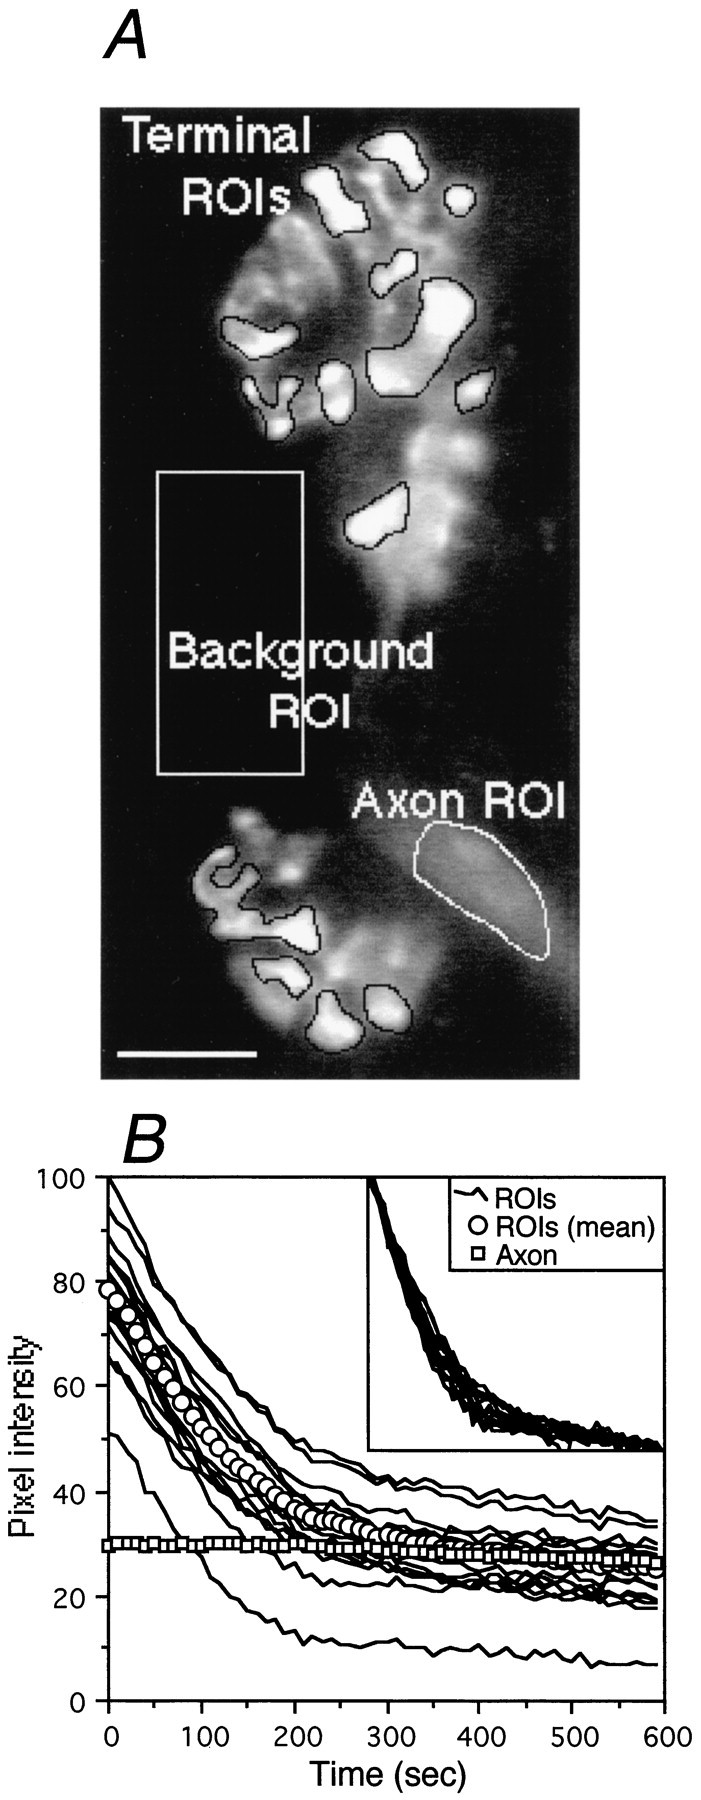
Analysis of terminal destaining. A, Stained in-focus areas of the terminal were outlined manually, and these regions of interest (terminal ROIs) were analyzed for brightness (pixel intensity). This analysis was repeated for corresponding regions of interest in each image of a time series. The regions of interest are shown here, and a background and axon region of interest have also been drawn. Scale bar, 10 μm. B, Pixel intensity of the regions of interest in A plotted against time over the 10 min stimulation period. The data have been background-subtracted. Thecircles show the average pixel intensity over the whole terminal, and the squares show the brightness of the axon. Initially, all vesicles in the terminal are labeled with dye, and therefore the terminal fluoresces brightly. Upon stimulation (time 0), large-scale vesicle exocytosis commences, and vesicles release their dye. Initial brightness did not affect the rate of destaining of different parts of the terminal (inset), because the percentage of dye loss for all regions followed very similar time courses. The initial fast rate of destaining slows as the number of labeled vesicles diminish and are replaced by recycled (unlabeled) vesicles, which begin to compete with labeled vesicles for release. The axon myelin sheath is labeled in an activity-independent manner and loses very little dye during the experiment, showing photobleaching does not contribute significantly to the destaining.
Activity-dependent nerve terminal destaining appeared to consist of two components. The first, most evident over the initial 3–4 min, was characterized by a high rate of dye loss. This gave way to a second component of slower dye loss as unlabeled vesicles reentered the vesicle pool and competed with labeled vesicles for release (Betz and Bewick, 1993). There was no evidence of more rapid components of destaining that might correspond to the two most rapid components of EPP depression (see above). It is likely that this is because the number of quanta in these components and the associated changes in intensity are both too small and too rapid to be resolved by our methods (see below).
During the initial component, all regions of the nerve terminal appeared to destain at the same rate. In the soleus terminal in Figure4, the mean destaining rate of all boutons was 0.23 ± 0.01 PIU/sec (n = 14) over the first 3 min, regardless of their initial intensity. Thus, for all subsequent experiments, the rate of destaining of a terminal was expressed as the average over all in-focus regions. Toward the end of the period of stimulation, the rate of dye loss from terminals was very low and not different between EDL and soleus (EDL, 0.013 ± 0.001 PIU/sec; soleus, 0.017 ± 0.002 PIU/sec; n = 20; p > 0.5).
The activity-dependent destaining appeared to be superimposed on a level of activity-independent labeling that varied considerably between the different regions of the terminal. Subtraction of this component from each of the individual regional destaining curves revealed that destaining was essentially identical across the entire terminal (Fig.4B, inset). The similarity in the intensity data after subtraction of the slow component also shows that vesicle densities are probably very similar throughout the terminal. Thus, variations in initial intensities are probably caused by differences in the underlying background level of staining. It is not clear what this variation in background between different regions of the same terminal is attributable to, but dye accumulation in membrane of terminal Schwann cells or postsynaptic folds are obvious candidates.
In contrast to terminals, axons (in EDL and soleus), which take up FM1–43 in an activity-independent manner because of the large amount of membrane in the myelin sheath (Betz et al., 1992), lost very little dye (0.008 ± 0.002 PIU/sec; n = 20 axons) over the course of the 10 min experiment. This indicates that photobleaching, which can occur when FM1–43-labeled cells are exposed to high levels of excitatory illumination (Henkel et al., 1996b), is not a significant factor in our experiments because of the low levels of illumination used during image acquisition (see Materials and Methods).
The rate of terminal destaining, even at the end of the period of stimulation, was significantly higher (p < 0.01) than that in axonal regions (Figs. 3, 4B). This is probably because of a small number of labeled vesicles still being lost from the terminals. In addition, the highly lipophilic myelin sheath may be slower than terminals to lose its dye to washout and/or photobleaching.
Kinetics of destaining in EDL versus soleus
Ribchester et al. (1994) observed that terminal destaining in mouse triangularis sterni muscle could be well fitted by the sum of two exponentials. The data for the soleus terminal in Figure 4 (20 Hz tonic stimulation) was also better fit by the sum of two exponentials (R2 = 0.98) than by a single exponential (R2 = 0.89). The fast τ was, on average, more rapid in EDL terminals (2.74 ± 0.71 min;n = 10) than soleus (7.12 ± 0.16 min;n = 10; p < 0.01) and was primarily complete within 3 min. The slower component (τ >30 min in each case) contributed little to the early destaining and was not significantly different between EDL and soleus. In the subsequent data analysis, therefore, the contribution of the slow component to the fast destaining was not subtracted.
The first 5 min of destaining of EDL and soleus terminals, expressed as percentage of dye lost over the full 10 min experiment, is compared in Figure 5A. During the first minute of stimulation, EDL terminals lost on average 0.70 ± 0.05% of dye per second compared with 0.43 ± 0.03 in soleus (n = 10; p < 0.0005). Consequently, EDL terminals took only 75 sec to lose 50% of their initial fluorescence compared with 140 sec for soleus (Fig. 5A). These data were acquired from muscles that had been paralyzed withd-tubocurarine, which blocks the postsynaptic acetylcholine receptors. This compound, however, reportedly increases the rate of rundown of QC in rat terminals during high-frequency stimulation (Glavinovic 1979b; Ferry and Kelly, 1988). The different destaining rates may therefore reflect a differential sensitivity of the two terminals to the presynaptic effects of d-tubocurarine. We therefore repeated these experiments using μ-conotoxin GIIIB, which, at 2 μm, selectively blocks voltage-gated Na+ channels on rat muscle fibers, leaving those on the nerve unaffected (Braga et al., 1992; Plomp et al., 1992). To compare the effect of these two treatments on terminal destaining, the percentage of dye lost during the first 2 min of stimulation was determined for terminals of each type in d-tubocurarine (n = 10) and μ-conotoxin GIIIB (n = 5). These data are shown in Figure 5B. Clearly, there is no significant difference in dye loss between the two treatments (EDL,p > 0.9; soleus, p > 0.5). In each case, EDL terminals lose ∼18% more dye during the first 2 min than soleus terminals (d-tubocurarine, p < 0.001; μ-conotoxin GIIIB, p < 0.003).
Fig. 5.

Comparison of dye release from EDL and soleus terminals. A, Destaining of EDL and soleus terminals during the first 5 min of stimulation at 20 Hz expressed as cumulative percentage of dye lost. The EDL terminals have a higher initial rate of dye release: 0.70 versus 0.43 PIU/sec in soleus (n= 10). B, Comparison of the percentage of dye lost by EDL and soleus terminals during the first 2 min of stimulation at 20 Hz in the presence of 5 μmd-tubocurarine (n = 10) or 2 μm μ-conotoxin GIIIB (n = 5) to block muscle contraction. EDL terminals show a higher rate of dye loss in both treatments (EDL vs soleus;d-tubocurarine, p < 0.001; μ-conotoxin GIIIB, p < 0.003). There is no significant difference in the rate of dye loss between the two treatments (d-tubocurarine versus μ-conotoxin GIIIB; EDL, p > 0.9; soleus, p > 0.5).
Basis for different rates of destaining
The higher initial rate of dye release per unit time, and hence per nerve impulse, in EDL nerve terminals means a greater fraction of their pool of labeled vesicles (VP) undergo exocytosis during prolonged continuous stimulation than in soleus terminals. Although the number of vesicles lost per impulse (QC) from the terminals is initially higher in EDL than in soleus, this changes with prolonged stimulation. The higher rate of destain with prolonged stimulation could be because of either of two options: (1) the mean QC is higher in EDL, but the VP is the same in the two terminal types, or (2) both the mean number of vesicles lost per impulse and VP differ.
To determine which scenario is correct, we therefore estimated VP in EDL and soleus nerve terminals and then compared it with the electrophysiological data on QC.
We estimated VP size by correlating the fraction of dye lost (measured optically) with the actual number of vesicles lost (measured electrophysiologically). This is a novel extension of the correlation of styryl dye and transmitter release first used by Betz and Bewick (1992, 1993). The crucial difference with respect to the original study is that we measured QC, i.e., the actual number of vesicles released and not simply EPP amplitude. As in frog terminals, dye loss and transmitter correlate well over the first minute (Fig.6) (Betz and Bewick, 1992, 1993).
From the dye loss and electrophysiological data, the estimation of the initial VP size was as follows, illustrated using the data in Figure 6. In this case, for EDL, 30% of dye loss corresponds to a loss of 5 × 10⁴ vesicles. Thus, the total number of vesicles in the terminal initially (VP) would be:
The results of this procedure for all 10 terminals of each type are shown in Table 1. Our results correlate well with many other estimates from similar preparations using different techniques.Elmqvist and Quastel (1965), using hemicholinium to inhibit synthesis of acetylcholine, estimated a VP size of 366,000 ± 92,000 in rat diaphragm terminals. Schofield and Marshall (1980) used the same drug on mouse diaphragm and estimated a VP size of 174,000 ± 36,000.Searl et al. (1990) used (−)-vesamicol to inhibit acetylcholine transport into vesicles and estimated a VP size of 292,000 ± 58,000 in snake cutaneous muscle terminals. Although it is higher than the 69,000 estimated by Searl et al. (1991) in cut rat hemidiaphragm preparations using (−)-vesamicol, this is possibly because they used smaller, younger rats (200 gm) than we used here (>350 gm).
It is clear from the data in Table 1 that the VP in EDL terminals is only ∼70% of that in soleus terminals. Thus, EDL terminals destain faster not only because they have a larger quantal vesicle release per impulse but also because of a smaller pool of vesicles from which to lose those vesicles. These data also allow us to compare the fraction of VP released over 2 min with the fraction of dye lost over the same time frame (Table 1). EDL terminals release a greater proportion of their vesicle pool in 2 min than soleus terminals under these conditions, there being no significant difference between the percentage of dye lost and percentage of VP lost in 2 min in EDL (p > 0.7) or soleus (p> 0.3).
As mentioned above, our studies of quantal release suggest that part of the VP appears to be more readily releasable than the rest. We estimate that the sum of vesicles contained in the two fastest components of release (τ <1 sec and τ 5–10 sec) in EDL, is 6979 vesicles, or 3.9% of the total VP, and in soleus, is 8548 vesicles, or 3.4% of the total VP. Thus, in EDL, although the total VP is smaller than in soleus, a somewhat larger fraction of the VP is available for immediate release during periods of high-frequency activity lasting up to 10 sec. This correlates well with the differences in in vivoactivity patterns between these two muscles in which EDL terminals are active for 1–2 sec at 60–80 Hz (Hennig and Lømo, 1985).
Vesicle recycling
Given the higher QC and the smaller VP size in the EDL terminals, it was of great interest to know whether the rate at which vesicles are recycled after exocytosis differs between the two muscles. It might be expected that EDL terminals, losing a higher proportion of their vesicles per impulse, would require the vesicles to be returned to the pool more rapidly to maintain transmitter release. We therefore went on to estimate the vesicle recycle time for the two different types of terminal.
During prolonged stimulation of frog motor nerve terminals, dye loss and summed QC curves deviate at later times, the rate of dye loss eventually falling below the rate of quantal release (Betz and Bewick, 1992, 1993). The deviation was interpreted as being caused by the recycling of unlabeled vesicles back into the terminal, diluting the labeled pool and competing with labeled vesicles for release. This slows down the rate of dye loss relative to transmitter release. The minimum period when the deviation first becomes apparent was termed the recycle time, i.e., the time taken from docking and fusion of a vesicle, through membrane retrieval, refilling with neurotransmitter, and priming ready for release again (Bennett and Scheller, 1994). In frog motor nerve terminals, the recycle time was found to be ∼90 sec (Betz and Bewick, 1993). In the current study, a similar deviation was observed (Fig. 7). Interestingly, the recycle times in the EDL and soleus were not significantly different, at ∼110 sec (p > 0.5) (Fig. 7, Table 1). Thus, although the rate of vesicle exocytosis differs in terms of the initial QC and the fraction of the VP in the two terminal types, there is no apparent difference in the total vesicle recycle time.
Effect of stimulation frequency on vesicle recycling
Studies investigating the effect of changing activity on the total recycle time and the rate of endocytosis (the first step in the recycling of exocytosed vesicles) in frog motor nerve terminals (Betz and Bewick, 1993; Wu and Betz, 1996) report that recycle time is unchanged, but the endocytic rate becomes slower with increased frequency or duration of stimulation. The experiments we have described so far show that there is no difference in recycle times between terminals on the different muscle fiber types when they are both stimulated at the same frequency. However, EDL and soleus terminals are active at different frequencies in vivo. Thus, it was important to see whether recycle time could be modulated by changes in frequency. The frequency used in our initial experiments (20 Hz continuous) corresponded to that for the soleus motoneuron in vivo. We therefore examined the effect of changing first the stimulation frequency and then the activity pattern on total recycle time. We chose these parameters to approximate the pattern experienced by the EDL in vivo.
Initially, to obtain as direct a comparison as possible, experiments were performed at continuous 80 Hz stimulation, the same rate as thein vivo EDL firing pattern but much longer duration (medianin vivo burst duration, 1.6 sec). Our measurements of VP size and QC above would predict that most preparations would be depleted of vesicles before any vesicles were completely recycled ready for release again. In good agreement with this prediction, very few preparations were able to maintain transmitter release long enough for deviations between dye loss and transmitter release to be seen (∼3 min). Further, again as predicted, soleus terminals consistently lasted longer than those in EDL. Unsuccessful experiments were terminated when EPPs had run down to undetectable levels or when evidence of axonal block (Krnjevic and Miledi, 1958) was seen (sequences of EPPs disappearing and reappearing). In preparations that did not show signs of axonal block, the terminals ceased releasing dye and transmitter at approximately the time when we calculated that the terminals should have been depleted of vesicles, i.e., after ∼150,000 (EDL) or 250,000 (soleus) vesicles had been released. These data all support our calculations of the VP size and QC from experiments at 20 Hz. To reduce axonal block and prolong the duration of vesicle release, we repeated experiments at the slightly lower frequency of 60 Hz, with similar results. Although we were unable to obtain a complete set of data (i.e., long enough to assess recycle time) from any EDLs, we were successful with two soleus muscles, one at each frequency tested. The data from these muscles (Table 2) showed no obvious effect of stimulation rate on vesicle recycle time, despite the increase in stimulation rate by three or four times. Similarly, the calculated VP size in these muscles was in good agreement with our earlier calculations, again as predicted by our model. The much smaller percentage of dye per EPP at higher frequencies reflects the much enhanced rundown under these conditions.
Table 2.
Synaptic vesicle recycling parameters in soleus terminals stimulated at continuous 60 and 80 Hz
| 60 Hz | 80 Hz | |
|---|---|---|
| % dye per EPP | 0.009 | 0.009 |
| Vesicle pool size | 259,359 | 272,126 |
| % vesicle pool lost per initial EPP | 0.034 | 0.032 |
| % vesicle pool lost in 2 min | 41.79 | 50.23 |
| Recycle time (sec) | 120 | 130 |
Synaptic vesicle recycling parameters in soleus terminals stimulated at continuous 60 and 80 Hz (n = 1 in each case). Under these demanding conditions, no EDL terminals were able to maintain quantal release for long enough to measure recycle time. This supports the notion that soleus (but not EDL) terminals are adapted for long-term continuous vesicle exocytosis caused by a low initial QC and large VP.
Effect of activity pattern on vesicle recycling
To approximate more closely the pattern of activity of the EDLin vivo, we next investigated the effect of different stimulation patterns on recycle time. The same number of stimuli were applied as in the 20 Hz continuous stimulation experiments but in a pattern approximating that in the EDL in vivo. Thus, we stimulated with short bursts at 80 Hz (2.5 sec) interspersed with 7.5 sec of rest, repeated each 10 sec for 10 min. The data for three EDLs and two soleus terminals are shown in Table3. As can be seen, there was again no detectable effect of changes in activity frequency or pattern on total recycle time or fraction of dye lost per EPP. Further, the destaining kinetics of soleus terminals stimulated intermittently at 80 Hz were not significantly different from those stimulated continuously at 20 Hz (e.g., R2 = 0.97; fast τ, 3.53 min; slow τ, 35.28 min). This is as would be predicted, because the mean rate of activity in the two situations is the same.
Table 3.
Synaptic vesicle recycling parameters from terminals stimulated phasically at 80 Hz.
| EDL | Soleus | t test | |
|---|---|---|---|
| % dye per EPP | 0.034 ± 0.001 | 0.025 ± 0.002 | p < 0.05 |
| Vesicle pool size | 127,697 ± 3732 | 190,019 ± 52,144 | NS |
| % vesicle pool lost per initial EPP | 0.077 ± 0.009 | 0.053 ± 0.009 | p < 0.02 |
| % vesicle pool lost in 2 min | 67.29 ± 2.04 | 53.91 ± 6.54 | p < 0.05 |
| Recycle time (sec) | 93.3 ± 14.7 | 85.0 ± 7.1 | NS |
Synaptic vesicle recycling parameters from terminals stimulated phasically at 80 Hz (EDL, n = 3; soleus,n = 2). Both terminal types were better able to maintain quantal release during phasic, rather than tonic, high-frequency stimulation. Neither recycle time (EDL,p > 0.4; soleus, p > 0.1) nor % dye per EPP (EDL, p > 0.2; soleus, p > 0.1) differed significantly between tonic 20 Hz and phasic 80 Hz stimulation regimens.
DISCUSSION
This study reveals significant differences in synaptic vesicle trafficking in motor nerve terminals, which apparently adapt them to their distinctive in vivo patterns of impulse activity. In particular, soleus terminals, which fire in vivo for long periods of time at ∼20 Hz, support sustained quantal transmitter release much better than the terminals in EDL, which fire in short bursts at 60–80 Hz.
Soleus terminals have a lower QC but maintain release better
As in previous studies of these rodent muscles (mouse, Tonge, 1974; Bewick and Tonge, 1991; rat, Gertler and Robbins, 1978;Wood and Slater, 1997), we find the initial QC of terminals in the slow-twitch soleus muscle is significantly lower than those in the fast-twitch EDL. Our estimates of QC (∼87 for soleus and ∼102 for EDL) are slightly higher than those of Wood and Slater (1997) (∼62 and ∼80, respectively) but are in a similar ratio. Our use of older rats here, with subsequently larger muscle fibers and nerve terminals, probably account for this difference. Although Gertler and Robbins (1978) report qualitatively similar results, their much higher QCs overall probably reflects their use of the variance method, which substantially overestimates QC (McLachlan, 1978; Slater et al., 1992).
Another marked difference in vesicle release characteristics between EDL and soleus terminals was revealed during tonic 20 Hz stimulation. Although triphasic in both muscles, QC rundown was much greater in EDL at all frequencies (Fig. 1), suggesting soleus terminals are much better adapted to tonic transmitter release. There are few relevant previous studies available for direct comparison. In the garter snake, terminals on tonic muscle fibers maintained spontaneous transmitter release much better than terminals on twitch fibers when depolarized with high-potassium solutions for several hours (Morgan and Proske, 1984; Coniglio et al., 1993; Connor et al., 1997), although the response to evoked events was not measured. Gertler and Robbins (1978)measured “steady state” QC in rat soleus and EDL terminals after 200 stimuli. This is equivalent to only the first 10 sec of our experiments at 20 Hz. Nevertheless, our observation of a lower QC in EDL terminals during tonic 20 Hz stimulation is qualitatively different from their findings. The reason for this is not obvious but may relate either to their indirect measurement of QC or because they also examined younger animals (200 gm, ∼6 weeks vs >350 gm, ∼17 weeks). Muscles in younger animals have differentiated less completely into fast-twitch and slow-twitch types, a difference almost certainly reflected in their nerve terminal properties, too.
Thus, one or more aspects of synaptic vesicle trafficking properties appears better adapted to maintaining transmitter output during tonic activity in soleus terminals. We therefore went on to use the FM 1–43 technique to investigate which aspects of vesicle trafficking might underlie this adaptation, beginning with the synaptic vesicle distribution and terminal destaining characteristics.
Are all vesicles labeled by the labeling regimen?
An important consideration for these data are whether the loading regimen labels all releasable vesicles in the terminals. Three lines of evidence suggest that this is so. First, our labeling stimulation regimen recycled ∼378,000 vesicles per terminal (15 min, alternating trains of 5 sec at 1 Hz and 10 sec at 10 Hz = 6300 stimuli × estimated mean QC of 60; probably an underestimate under these conditions), which comfortably exceeds the largest VP measured (∼280,000), although some vesicles undoubtedly recycle more than once. Second, increasing the stimulation time did not produce brighter labeling (20 min; data not shown). Finally, a similar regimen labeled all vesicles within frog motor nerve terminals (Henkel et al., 1996a), with no evidence of a reserve pool refractory to recycling. Thus, our stimulation regimen probably labeled the entire releasable VP.
Terminal morphology, QC per unit area, and regional terminal destaining properties
FM1–43 labeling revealed morphological differences between terminals in EDL and soleus. A detailed quantification of these differences is the subject of another study in this laboratory. We report here, however, that terminals in the two muscles have similar areas. Thus, at least initially, the QC per unit area is higher in EDL than soleus terminals: 0.27 ± 0.01 versus 0.22 ± 0.01 vesicles/μm2 (n = 10;p < 0.03), consistent with previous findings in these muscles by Wood and Slater (1997). The basis for the differences in QC per unit area is unknown. One possibility is that there are differences in the number (Walrond and Reese, 1985) and type (Ireland et al., 1999) of calcium channels in the active zones. Another is that the density of active zones differs. We know of no data on either of these topics for rat soleus and EDL terminals.
We found considerable variability in fluorescence intensities between different regions of the same terminal, as reported previously for terminals in mouse triangularis sterni muscles (Ribchester et al., 1994). However, as in mouse (Ribchester et al., 1994) and frog (Betz and Bewick, 1992) terminals, all regions destained with a very similar time course. This uniformity of destaining rates and vesicle density (see Results) mean QC per unit area per impulse is similar across each terminal. We saw no evidence of the “hot spots” of higher vesicular release found in goldfish retinal bipolar cells (Lagnado et al., 1996), which are associated with dense bodies specialized for rapid exocytosis. Thus, terminals displayed little regional variability apart from differences in underlying background.
Although all terminals destained after stimulation, the rate of dye loss was consistently greater in EDL terminals at each frequency and activity pattern tested, irrespective of neuromuscular blocking agent. Both the optical and electrophysiological data, therefore, indicate real differences in the vesicle trafficking characteristics between terminals in the two muscles.
Quantification of vesicle trafficking characteristics in EDL and soleus
Correlation of dye loss with cumulative quantal release allowed us to determine several vesicle trafficking parameters, including total vesicle recycle time (Betz and Bewick, 1992, 1993), VP size, and the fraction of the pool lost per stimulus. Calculation of the VP size used an extension of the original technique, because we measured QC rather than simply EPP amplitude. The derived VP size estimates agreed well both with results from our vesicle depletion experiments and those from previous studies (see Results).
The VP size estimates revealed significant differences between EDL and soleus terminals. The ratio of vesicle density (VP/area) in soleus and EDL terminals (651 ± 55 vs 481 ± 37 vesicles/μm2, respectively; n = 10; ratio, 1.4:1) is very similar to the ratio of their intensities per unit area (0.14 ± 0.02 vs 0.11 ± 0.01 PIU/μm2, soleus and EDL, respectively;n = 25 and 23, respectively; ratio, 1.3:1). Thus, the larger VP in soleus terminals is primarily attributable to a significantly (p < 0.02) higher vesicle density, although what determines terminal vesicle density is not known.
The ratio between VP size and initial QC is therefore quite different in EDL and soleus terminals (Table 1). The smaller VP and higher initial QC in EDL is entirely consistent with the observations that EDL terminals destained faster, exhibited faster and more extensive EPP rundown, and failed earlier during prolonged high-frequency stimulation. Thus, VP size is not proportional to the QC of a terminal. So what determines VP size in a terminal? The demands of the in vivo activity pattern are presumably an important determinant, although not necessarily in the way some studies have predicted (Brodin et al., 1997). The short high-frequency bursts of activity in EDL terminals probably require a high initial QC to ensure effective transmission. The interspersed long quiescent periods (several tens of minutes; Hennig and Lømo, 1985) allow sufficient time for the replenishment of the depleted VP. The VP in EDL, therefore, may simply consist of sufficient vesicles for a few short bursts of activity. In contrast, soleus terminals, active for extended periods (30% of animal’s activity time), has a low QC and large VP to ensure a constant supply of vesicles.
The balance of VP size and QC seem crucial for maintaining transmitter release, particularly because vesicle recycle time is similar in the two muscles and is constant. Interestingly, the vesicle recycle times reported here are similar to previous estimates from other methods and neuronal preparations [frog motor nerve terminals, ∼94 sec, Betz and Bewick, 1993; rat diaphragm, 1–2 min, Betz and Bewick, 1993 (derived from Searl et al., 1991); cultured rat hippocampal neurons, ∼90 sec,Ryan et al., 1993]. This strong agreement between data from different species, neurotransmitter systems, and techniques suggests that most chemically transmitting neurons recycle vesicles at the same rate after evoked exocytosis, a rate that cannot be modulated easily.
In conclusion, motor nerve terminals appear to be adapted to their particular functional demands, maintaining vesicular output by adapting VP size and QC but not vesicle recycle time. If this is a general principle, it might place important constraints on the plasticity of terminal function, e.g., in learning and memory. How the consistent vesicle recycle times reported to date relate to recent data showing activity-dependent modulation of endocytosis (von Gersdorff and Matthews, 1994a,b; Wu and Betz, 1996) and very rapid “kiss and run” recycling in some terminals in culture (Klingauf et al., 1998) will be fascinating to discover.
Footnotes
This work was supported by The Wellcome Trust, The Physiological Society, and The Royal Society. We thank Dr. Sarah J. Wood and Dr. John Pulham for helpful comments and discussion about this work.
Correspondence should be addressed to Dr. Guy S. Bewick, Department of Biomedical Sciences, Institute of Medical Sciences, University of Aberdeen, Aberdeen, AB25 2ZD, United Kingdom.
REFERENCES
- 1.Auerbach A, Betz W. Does curare affect transmitter release? J Physiol (Lond) 1971;213:681–705. doi: 10.1113/jphysiol.1971.sp009409. [DOI] [PMC free article] [PubMed] [Google Scholar]
- 2.Bennett MK, Scheller RH. A molecular description of synaptic vesicle membrane trafficking. Annu Rev Biochem. 1994;63:63–100. doi: 10.1146/annurev.bi.63.070194.000431. [DOI] [PubMed] [Google Scholar]
- 3.Betz WJ, Bewick GS. Optical analysis of synaptic vesicle recycling at the frog neuromuscular junction. Science. 1992;255:200–203. doi: 10.1126/science.1553547. [DOI] [PubMed] [Google Scholar]
- 4.Betz WJ, Bewick GS. Optical monitoring of transmitter release and synaptic vesicle recycling at the frog neuromuscular junction. J Physiol (Lond) 1993;460:287–309. doi: 10.1113/jphysiol.1993.sp019472. [DOI] [PMC free article] [PubMed] [Google Scholar]
- 5.Betz WJ, Mao F, Bewick GS. Activity-dependent fluorescent staining and destaining of living vertebrate motor nerve terminals. J Neurosci. 1992;12:363–375. doi: 10.1523/JNEUROSCI.12-02-00363.1992. [DOI] [PMC free article] [PubMed] [Google Scholar]
- 6.Betz WJ, Ridge RMAP, Bewick GS. Comparison of FM1–43 staining patterns and electrophysiological measures of transmitter release at the frog neuromuscular junction. J Physiol (Paris) 1993;87:193–202. doi: 10.1016/0928-4257(93)90030-w. [DOI] [PubMed] [Google Scholar]
- 7.Bewick GS, Tonge DA. Characteristics of endplates formed in mouse skeletal muscles reinnervated by their own or by foreign nerves. Anat Rec. 1991;230:273–282. doi: 10.1002/ar.1092300216. [DOI] [PubMed] [Google Scholar]
- 8.Braga MF, Anderson AJ, Harvey AL, Rowan EG. Apparent block of K+ currents in mouse motor nerve terminals by tetrodotoxin, μ-conotoxin and reduced external sodium. Br J Pharmacol. 1992;106:91–94. doi: 10.1111/j.1476-5381.1992.tb14298.x. [DOI] [PMC free article] [PubMed] [Google Scholar]
- 9.Brodin L, Low P, Gad H, Gustafsson J, Pieribone VA, Shupliakov O. Sustained neurotransmitter release: new molecular clues. Eur J Neurosci. 1997;7:2503–2511. doi: 10.1111/j.1460-9568.1997.tb01679.x. [DOI] [PubMed] [Google Scholar]
- 10.Brooke MH, Kaiser KK. Some comments on the histochemical characterization of muscle adenosine triphosphatase. J Histochem Cytochem. 1969;17:431–432. doi: 10.1177/17.6.431. [DOI] [PubMed] [Google Scholar]
- 11.Coniglio LM, Hardwick JC, Parsons RL. Quantal transmitter release at snake twitch and tonic muscle fibres during prolonged nerve terminal depolarization. J Physiol (Lond) 1993;466:383–403. [PMC free article] [PubMed] [Google Scholar]
- 12.Connor EA, Dunaevsky A, Griffiths DJG, Hardwick JC, Parsons RL. Transmitter release differs at snake twitch and tonic endplates during potassium-induced deploarization. J Neurophysiol. 1997;77:749–760. doi: 10.1152/jn.1997.77.2.749. [DOI] [PubMed] [Google Scholar]
- 13.Elmqvist D, Quastel DMJ. Presynaptic action of hemicholinium at the neuromuscular junction. J Physiol (Lond) 1965;177:463–482. doi: 10.1113/jphysiol.1965.sp007605. [DOI] [PMC free article] [PubMed] [Google Scholar]
- 14.Ferry CB, Kelly SS. The nature of the presynaptic effects of (+)-tubocurarine at the mouse neuromuscular junction. J Physiol (Lond) 1988;403:425–437. doi: 10.1113/jphysiol.1988.sp017257. [DOI] [PMC free article] [PubMed] [Google Scholar]
- 15.Gertler RA, Robbins N. Differences in neuromuscular transmission in red and white muscles. Brain Res. 1978;142:160–164. doi: 10.1016/0006-8993(78)90186-5. [DOI] [PubMed] [Google Scholar]
- 16.Glavinovic MI. Change of statistical parameters of transmitter release during various kinetic tests in unparalysed voltage-clamped rat diaphragm. J Physiol (Lond) 1979a;290:481–497. doi: 10.1113/jphysiol.1979.sp012785. [DOI] [PMC free article] [PubMed] [Google Scholar]
- 17.Glavinovic MI. Presynaptic action of curare. J Physiol (Lond) 1979b;290:499–506. doi: 10.1113/jphysiol.1979.sp012786. [DOI] [PMC free article] [PubMed] [Google Scholar]
- 18.Henkel AW, Lübke J, Betz WJ. FM1–43 dye ultrastructural localization in and release from frog motor nerve terminals. Proc Nat Acad Sci USA. 1996a;93:1918–1923. doi: 10.1073/pnas.93.5.1918. [DOI] [PMC free article] [PubMed] [Google Scholar]
- 19.Henkel AW, Simpson LL, Ridge RMAP, Betz WJ. Synaptic vesicle movements monitored by fluorescent recovery after photobleaching in nerve terminals stained with FM1–43. J Neurosci. 1996b;16:3960–3967. doi: 10.1523/JNEUROSCI.16-12-03960.1996. [DOI] [PMC free article] [PubMed] [Google Scholar]
- 20.Henneman E, Olson CB. Relations between structure and function in the design of skeletal muscles. J Neurophysiol. 1965;28:581–598. doi: 10.1152/jn.1965.28.3.581. [DOI] [PubMed] [Google Scholar]
- 21.Henneman E, Somjen G, Carpenter DO. Functional significance of cell size in spinal motoneurons. J Neurophysiol. 1965;28:560–580. doi: 10.1152/jn.1965.28.3.560. [DOI] [PubMed] [Google Scholar]
- 22.Hennig R, Lømo T. Firing patterns of motor units in normal rats. Nature. 1985;314:164–166. doi: 10.1038/314164a0. [DOI] [PubMed] [Google Scholar]
- 23.Ireland DR, Davies PJ, McLachlan EM. Calcium channel subtypes differ at two types of cholinergic synapse in lumbar sympathetic neurones of guinea pigs. J Physiol (Lond) 1999;514:59–69. doi: 10.1111/j.1469-7793.1999.059af.x. [DOI] [PMC free article] [PubMed] [Google Scholar]
- 24.Kamenskaya MA, Elmqvist D, Thesleff S. Guanidine and neuromuscular transmission. II. Effect on transmitter release in response to repetitive nerve stimulation. Arch Neurol. 1975;32:510–518. doi: 10.1001/archneur.1975.00490500030002. [DOI] [PubMed] [Google Scholar]
- 25.Klingauf J, Kavalali ET, Tsien RW. Kinetics and regulation of fast endocytosis at hippocampal synapses. Nature. 1998;394:581–585. doi: 10.1038/29079. [DOI] [PubMed] [Google Scholar]
- 26.Krnjevic K, Miledi R. Some effects produced by adrenaline upon neuromuscular propagation in rats. J Physiol (Lond) 1958;141:291–304. doi: 10.1113/jphysiol.1958.sp005974. [DOI] [PMC free article] [PubMed] [Google Scholar]
- 27.Lagnado LL, Gomis A, Job C. Continuous vesicle cycling in the synaptic terminal of retinal bipolar cells. Neuron. 1996;17:957–967. doi: 10.1016/s0896-6273(00)80226-3. [DOI] [PubMed] [Google Scholar]
- 28.Liley AW. An investigation of spontaneous activity at the neuromuscular junction of the rat. J Physiol (Lond) 1956;132:650–666. doi: 10.1113/jphysiol.1956.sp005555. [DOI] [PMC free article] [PubMed] [Google Scholar]
- 29.Martin AR. A further study of the statistical composition of the endplate potential. J Physiol (Lond) 1955;130:114–122. doi: 10.1113/jphysiol.1955.sp005397. [DOI] [PMC free article] [PubMed] [Google Scholar]
- 30.McLachlan EM. The statistics of transmitter release at chemical synapses. Int Rev Physiol. 1978;17:49–117. [PubMed] [Google Scholar]
- 31.Morgan DL, Proske U. Vertebrate slow muscle: its structure, pattern of innervation, and mechanical properties. Physiol Rev. 1984;64:103–169. doi: 10.1152/physrev.1984.64.1.103. [DOI] [PubMed] [Google Scholar]
- 32.Plomp JJ, van Kempen GTH, Molenaar PC. Adaptation of quantal content to decreased postsynaptic sensitivity at single endplates in α-bungarotoxin-treated rats. J Physiol (Lond) 1992;458:487–499. doi: 10.1113/jphysiol.1992.sp019429. [DOI] [PMC free article] [PubMed] [Google Scholar]
- 33.Reid B, Bewick GS. Synaptic vesicle trafficking in motor nerve terminals of rat fast- and slow-twitch muscles. J Physiol (Lond) 1996;495:59P. [Google Scholar]
- 34.Reid B, Bewick GS. Synaptic vesicle recycle time and releasable pool size in motor nerve terminals of rat fast- and slow-twitch muscles. J Physiol (Lond) 1997;499:28P. [Google Scholar]
- 35.Ribchester RR, Mao F, Betz WJ. Optical measurements of activity-dependent membrane recycling in motor nerve terminals of mammalian skeletal muscle. Proc R Soc Lond B Biol Sci. 1994;255:61–66. doi: 10.1098/rspb.1994.0009. [DOI] [PubMed] [Google Scholar]
- 36.Ryan TA, Reuter H, Wendland B, Schweizer FE, Tsien RW, Smith SJ. The kinetics of synaptic vesicle recycling measured at single presynaptic boutons. Neuron. 1993;11:713–724. doi: 10.1016/0896-6273(93)90081-2. [DOI] [PubMed] [Google Scholar]
- 37.Schofield GG, Marshall IG. Neuromuscular transmission in the athymic nude mouse. J Neurol Sci. 1980;48:21–34. doi: 10.1016/0022-510x(80)90147-1. [DOI] [PubMed] [Google Scholar]
- 38.Searl T, Prior C, Marshall IG. The effects of l-vesamicol, an inhibitor of vesicular acetylcholine uptake, on two populations of miniature endplate currents at the snake neuromuscular junction. Neuroscience. 1990;35:145–156. doi: 10.1016/0306-4522(90)90129-r. [DOI] [PubMed] [Google Scholar]
- 39.Searl T, Prior C, Marshall IG. Acetylcholine recycling and release at rat motor nerve terminals studied using (−)-vesamicol and troxypyrrolium. J Physiol (Lond) 1991;444:99–116. doi: 10.1113/jphysiol.1991.sp018868. [DOI] [PMC free article] [PubMed] [Google Scholar]
- 40.Slater CR, Lyons PR, Wallis TJ, Fawcett PRW, Young C. Structure and function of neuromuscular junctions in the vastus lateralis of man: a motor point biopsy study of two groups of patients. Brain. 1992;11:451–478. [PubMed] [Google Scholar]
- 41.Tonge DA. Physiological characteristics of re-innervation of skeletal muscle in the mouse. J Physiol (Lond) 1974;241:141–153. doi: 10.1113/jphysiol.1974.sp010645. [DOI] [PMC free article] [PubMed] [Google Scholar]
- 42.von Gersdorff H, Matthews G. Dynamics of synaptic vesicle fusion and membrane retrieval in synaptic terminals. Nature. 1994a;367:735–773. doi: 10.1038/367735a0. [DOI] [PubMed] [Google Scholar]
- 43.von Gersdorff H, Matthews G. Inhibition of endocytosis by elevated internal calcium in a synaptic terminal. Nature. 1994b;370:652–655. doi: 10.1038/370652a0. [DOI] [PubMed] [Google Scholar]
- 44.Walrond JP, Reese TS. Structure of axon terminals and active zones at synapses on lizard twitch and tonic muscle fibers. J Neurosci. 1985;5:1118–1131. doi: 10.1523/JNEUROSCI.05-05-01118.1985. [DOI] [PMC free article] [PubMed] [Google Scholar]
- 45.Wood S, Slater C. The contribution of postsynaptic folds to the safety factor for neuromuscular transmission in rat fast- and slow-twitch muscles. J Physiol (Lond) 1997;500:165–176. doi: 10.1113/jphysiol.1997.sp022007. [DOI] [PMC free article] [PubMed] [Google Scholar]
- 46.Wu LG, Betz WJ. Nerve activity but not intracellular calcium determines the time course of endocytosis at the frog neuromuscular junction. Neuron. 1996;17:769–779. doi: 10.1016/s0896-6273(00)80208-1. [DOI] [PubMed] [Google Scholar]