

Abstract
Purpose:
To evaluate the biophysical processes that generate specific T2 values and their relationship to specific cerebrospinal fluid (CSF) content.
Materials and methods:
CSF T2s were measured ex vivo (14.1 T) from isolated CSF collected from human, rat and non-human primate. CSF T2s were also measured in vivo at different field strength in human (3 and 7 T) and rodent (1, 4.7, 9,4 and 11.7 T) using different pulse sequences. Then, relaxivities of CSF constituents were measured, in vitro, to determine the major molecule responsible for shortening CSF T2 (2 s) compared to saline T2 (3 s). The impact of this major molecule on CSF T2 was then validated in rodent, in vivo, by the simultaneous measurement of the major molecule concentration and CSF T2.
Results:
Ex vivo CSF T2 was about 2.0 s at 14.1 T for all species. In vivo human CSF T2 approached ex vivo values at 3 T (2.0 s) but was significantly shorter at 7 T (0.9 s). In vivo rodent CSF T2 decreased with increasing magnetic field and T2 values similar to the in vitro ones were reached at 1 T (1.6 s). Glucose had the largest contribution of shortening CSF T2 in vitro. This result was validated in rodent in vivo, showing that an acute change in CSF glucose by infusion of glucose into the blood, can be monitored via changes in CSF T2 values.
Conclusion:
This study opens the possibility of monitoring glucose regulation of CSF at the resolution of MRI by quantitating T2.
Keywords: MRI, Relaxation time, CSF, Human, Monkey, Rodent
1. Introduction
Quantification of both longitudinal (T1) and transverse relaxation times (T2) has been widely used to help diagnosis and monitor the treatment of multiple diseases. Recently, there has been an increase in interest in quantitating relaxation times to provide more information. Examples include using relaxation time measurements to quantitate myelination in white matter to distinguish stages of multiple sclerosis [1], estimating iron levels during the progression of Alzheimer’s disease [2], to segment brain throughout neurodevelopment [3,4], and to monitor hippocampal damage due to epilepsy [5,6]. Although quantitating relaxation times is a powerful tool, the underlying biophysical processes that ultimately generate T1 and T2 values and their relationships to tissue and CSF biochemistry, remain poorly understood.
The literature reports a range of values for brain relaxation times. In healthy brain tissue, there are relatively consistent results for T1 measured at 1.5 T and above (0.9 s − 1.4 s) depending on tissue type and magnetic field. There are also relatively consistent results for T2 of brain tissue ranging from 0.05–0.1 s also depending on field strength and specific sequences used [7–9]. Remarkably, CSF T2 values in the literature are very wide, ranging from 0.2 to 2.2 s (11-fold variation). Like tissue T1 and T2, CSF T1 values are relatively more consistent ranging from 2.8 to 4.6 s (2-fold variation). Table 1 gives a few examples of CSF T2 reported in the literature. In all cases, T2 is shorter than T1 indicating that constituents of the CSF are having a significant effect on relaxation times. There is no report that indicates which constituents of CSF explain the shorter T2 vs T1. The literature describes CSF composition as a dilute mix of proteins (14–40 mg/dL [10]), lipids (1.03 mg/dL; [11]), glucose (50–79 mg/dL; [12]) and metals (3 mg/dL counting all 22 metals reported in the literature [13]). There are over 2630 proteins in healthy patient CSF [10] and the three most abundant ones are albumin (20 mg/dL), IgG (2 mg/dL; [14,15]) and transferrin (2 mg/dL; [16]). Other abundant CSF proteins such as IgA, IgM, haptoglobin and α2-macroglobulin have a concentration lower than 1 mg/dL [17]. Lipids are mostly represented by phospholipids (0.4–0.6 mg/dL), cholesterol (0.3–0.5 mg/dL), glycolipids (0.07–0.09 mg/dL) and lipoproteins (ApoE =0.5 mg/dL). The most concentrated metals in CSF are Mg (3 mg/dL), Fe (0.007 mg/dL) and Zn (0.005 mg/dL) [13].
Table 1.
CSF relaxation times T1 and T2 from different reports in the literature. Relaxation times were measured in vivo in healthy human at different field strengths.
| Magnetic field (T) | Human CSF in vivo | Literature | |
|---|---|---|---|
| T1 (s) | T 2 (s) | ||
| 0.15 | 4.36 | 1.76 | Hopkins et al., 1986 [32] |
| 0.35 | 2.72 | 0.17 | Kjos et al., 1985 [40] |
| 0.6 | 4.22 | 2.19 | Hopkins et al., 1986 [32] |
| 1.4 | 4.31 | - | Hopkins et al., 1986 [32] |
| 1.5 | - | 0.15 | Larsson et al., 1989 [33] |
| 3 | - | 0.50 | Piechnik et al., 2009 [29] |
| 4 | 4.55 | 0.70 | Jezzard et al., 1996 [30] |
The purpose of the present work was to determine the T2 of CSF ex vivo and in vivo and explore the possible reasons for such a large discrepancy of T2 values in the literature. Furthermore, it was determined which constituents of CSF are involved in generating these specific T2 values.
2. Materials and methods
The Institutional Review Board approved all human study protocols, and informed consent was received from all participants. MRI and CSF studies were performed on human subjects recruited for natural history studies of multiple sclerosis and HTLV-1 Associated Myelopathy/tropical spastic paraparesis (HAM/TSP). All animal experiments were performed in accordance with NIH guidelines and were approved by the Animal Care and Use Committee of the National Institute of Neurological Disorder and Stroke, National Institutes of Health (Bethesda, MD USA).
2.1. Ex vivo and in vitro MRI experiments
2.1.1. Ex vivo CSF samples
CSF samples were collected from 3 different species: 3 healthy human subjects (all males, age of 36.7 ± 10 years), 3 rhesus macaques (2 males, 1 female, mean age 9 ± 4 years), and 4 CD rats with a permanent intracisternal cannulation (all males, 3 months old; Charles River, USA). CSF was collected by lumbar puncture in humans in the context of ongoing clinical studies at the NINDS, NIH. CSF was obtained from non-human primates by transcutaneous cisterna magna puncture (one-time collection, 1–2 mL of CSF) and CSF from rats was obtained via a daily CSF collection (a maximum of 100 μL of CSF/collection was allowed) using the permanent intracisternal cannulation until reaching a final volume of 500 μL. Sampling periods was 24 h apart to allow for CSF production.
2.1.2. Standard in vitro solutions for T2 comparisons
To correlate T2 values with metal, protein and glucose concentration, the following solutions were prepared in 0.9% NaCl: bovine serum albumin (1.5–30 μM; BSA, Bio Rad, USA), ZnCl2 (0–1 mM; Sigma-Aldrich, USA), FeCl2 (0–1 mM; Sigma-Aldrich, USA), MnCl2 (0–80 μM; Sigma-Aldrich, USA), CuCl2 (0–1 mM, Sigma-Aldrich, USA) and glucose (0– 1 mM; Sigma-Aldrich, USA). BSA was used to mimic protein content of CSF. The pH range of these solutions was between 6.2 and 7.4.
To evaluate whether chemical exchange due to pH explains T2 differences at different field strength, glucose and BSA solutions were prepared in 0.9% NaCl at a physiological concentration of 4 mM and 0.01 mM, respectively (see Fig. 4). The pH was adjusted to 2 by adding few drops of HCl 50 mM and to 10 by adding few drops of NaOH 50 mM.
Fig. 4.
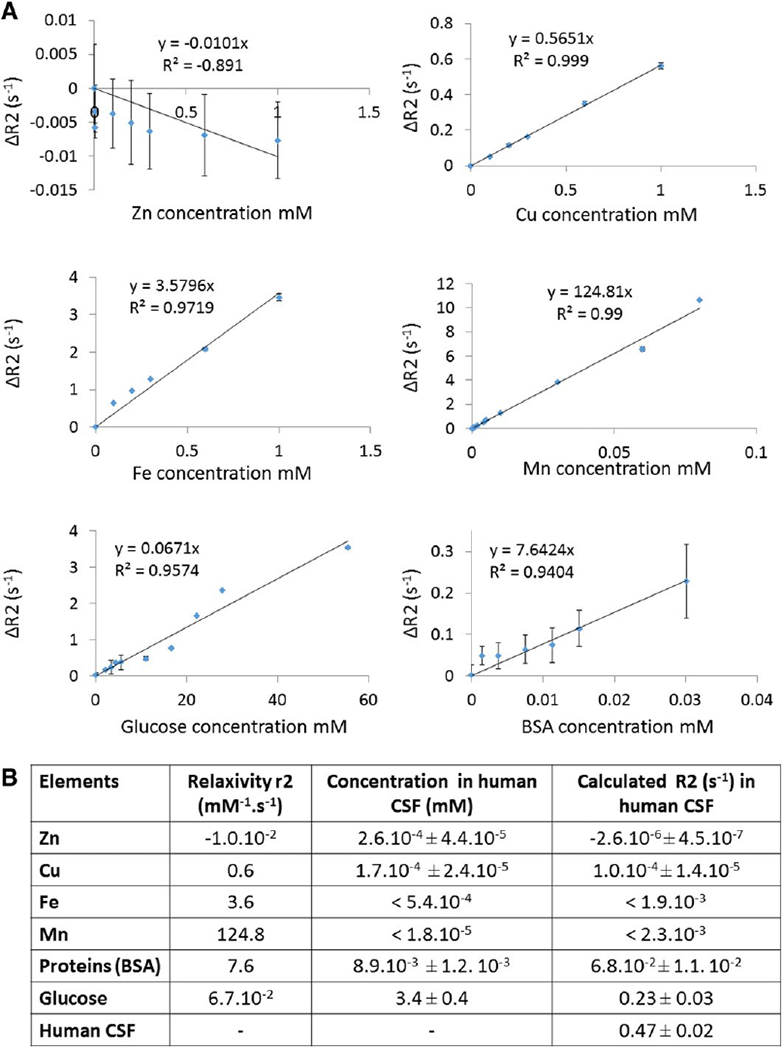
CSF compounds that can substantially change human CSF T2 relaxivity. All T2 measurements were performed on a 14.1 T Bruker MRI system at 37 °C using a CPMG sequence with TE(2048) = 2/2048 ms (intervals of 1 ms). A. Example of ΔR2 plotted against glucose (n = 3) and BSA concentration (n = 3). The regression equation is written for each graph, showing the relaxivity r2 for each species represented in this figure. B. Table showing the relaxivity r2, the concentration and the calculated R2 in human CSF for each element. Relaxivity r2 was computed for each species (proteins, metals and glucose) from the plot between ΔR2 and solute concentration. The concentration of metals in human CSF was determined by IC-PMS and the one of BSA and glucose was quantified using colorimetric methods. Using r2 and concentration values, we calculated the R2 for each element in human CSF (example for the BSA: R2 = r2 × [BSA concentration]; R2 = 7.6 × 8.9.10−3; R2 = 6.8.10−2 s−1).
2.1.3. Ex vivo and in vitro MRI acquisition
All ex vivo and in vitro experiments were performed in a vertical bore, 14.1 T MRI system (Bruker Biospin, Billerica, MA) using a volume transmit/receive coil. Ex vivo CSF and in vitro BSA and glucose solutions were also measured at 4.7 T MRI using a volume transmit and receive coil. In order to maintain constant temperature of the samples, the internal MRI temperature was set at 37 °C. Solutions (CSF or solute) were transferred in a 1 cm NMR glass tube and placed in a 37 °C water bath for at least 20 min prior to each experiment. Each tube was homogenized by vortex and directly placed in the NMR coil. A 3D image was performed to determine the sample position in the MRI. T2 measurement of the entire sample was performed with a multiecho Car-Purcell-Meiboom-Gill (CPMG) spectroscopy sequence with TR = 20,000 ms, TE(2048) = 2/2048 ms (intervals of 1 ms) and time of acquisition (TA) = 2 min 40 s. This eliminated the presence of any residual imaging gradients. T1 mapping was performed for ex vivo CSF samples only with a 2D RARE-VTR sequence with TR(6) = 500–20,000 ms; TE = 7.6 ms; TA = 9 min 25 and resolution of 0.625 × 0.625 mm.
2.2. In vivo MRI experiments
2.2.1. Human
In vivo CSF T2 values were calculated from three healthy subjects (1 male and 2 females, mean age 39 ± 4 years).
A heavily T2-weighted image was performed to visualize CSF without any contribution of brain tissue in the image. Conventional T2 maps were obtained with a standard two point T2 sequence and T2 maps were obtained with a multiple TEs sequence that attempted to minimize applied field gradients. All these sequences were used on 2 healthy subjects (2 females, ages of 42 and 35 years) on a Siemens 3 T Skyra system (software version VD11) equipped with a 32-channel phased-array receive-only head coil. Conventional T2 maps were generated using a dual-echo fast-spin-echo sequence with TR = 3500 ms, TE = 11/101 ms, TA = 3.5 min, in-plane resolution 0.5 mm, and slice thickness 3 mm. The T2 mapping was a 2D spin-echo sequence (Siemens product sequence) with TR = 10,000 ms and 32 TEs equally spaced between 30.5 and 945.5 ms, TA = 10.5 min, in-plane resolution 3 mm, and slice thickness 3 mm. Heavily T2-weighted images were acquired using a three dimension, fast spin–echo sequence (FSE), prescan-normalize filter for receive coil homogeneity, TR = 4800 ms, TE = 752 ms, FA = 100°, scan acceleration factor GRAPPA = 2, echo-train-length = 421, fat-saturation mode = strong, 0.65 mm isotropic resolution, bandwidth = 543 Hz/Px, and TA = 4 min 43 s [18]. This last sequence was also used on a Siemens 7 T MRI on one healthy volunteer (40 y.o. male) with the same parameters except the resolution: in-plane resolution 1.5 mm, and slice thickness 1.5 mm.
2.2.2. Rodent
A total of fifteen rodents were used to perform heavily T2-weighted images, conventional T2 mapping (n = 3), and T2-spectroscopy (n = 12) to remove the presence of any background imaging sequence gradientsFor all the scans, rodents were anesthetized with isoflurane (4% induction, 1.5% maintenance) and placed in a dedicated cradle equipped with byte and ear bars. Temperature and respiratory rate were monitored during the acquisition. A 3D image was performed to determine the animal position in the MRI.
2.2.2.1. Conventional T2 mapping and heavily T2 images.
Three rats (SD, 3 months old) were used for this experiment. Heavily T2-weighted images and conventional T2 mapping were performed on a 4.7 T MRI system (Bruker Avance III scanner and Bruker console) using a 72 mm ID birdcage coil and a surface coil to detect.
Three dimensional, heavily T2-weighted images were acquired with a T2-preparation (128 echoes, 3 ms spacing, M-LEV8 phase cycling) with a segmented FLASH readout [19], TR = 10 ms, TE = 384 ms, in-plane resolution 0.3 mm, and slice thickness 1 mm, TA = 24 min. Conventional T2 maps were generated with a multi-slice-multi-echo (MSME) sequence, TR = 4000 ms, TE(20) = 10.95/219 ms (intervals of 10.95 ms), in-plane resolution 0.3 mm, slice thickness 1 mm and TA = 6 min 24 s. For the MSME sequence, we used crushers giving 2π phase dispersion across the slice (same gradient strength for all echoes), and a 1-ms windowed sinc pulse for the refocusing pulse.
2.2.2.2. T2-spectroscopy.
Twelve mice (C57Bl6 male, 3 months old) were used to performed T2-spectroscopy. T2 quantitation was carried out using T2 spectroscopy sequence on 4 different horizontal field strength MRIs: 1 T (Bruker, Icon), 4.7 T (Bruker MRI), 9.4 T (Bruker MRI) and 11.7 T (Bruker MRI). The experiments at 4.7, 9.4 and 11.7 T all used a large birdcage coil (72 mm I.d. at 4.7 and 89 mm at 9.4 and 11.7 T) for transmission and a 1 cm diameter surface coil for reception. This arrangement serves to localize the experiment, and in particular, reduces the signal from the aqueous part of the eye (to b 10% of the signal).
The spectroscopic evaluation of T2 was obtained using a multiecho CPMG sequence with TR = 10,000 ms, TE(1024) = 2/2048 ms (intervals of 2 ms), Nav = 8, and TA = 1 min 20 s at 1 T; TR = 20,000 ms, TE(1024) = 2/2048 ms (intervals of 2 ms), Nav = 8 and TA = 2 min 40 s at 4.7 T, 9.4 T and 11.7 T. This spectroscopic evaluation of T2 was performed in vivo (CSF flow) and post mortem (no CSF flow) to observe the eventual impact of CSF flow on CSF T2 value. At the end of each in vivo scan, the mouse was euthanized by cerebral dislocation and immediately re-scanned to obtain the post mortem CSF T2 value. Due to the short time between sacrificing the animal and MRI data collection it is not likely that the pH got acidic due to the long time scale of CSF acidification [20].
2.3. In vivo experiments to manipulate CSF glucose concentrations: glucose challenge
To determine if T2 of CSF in vivo was sensitive to changes in glucose, experiments were done to manipulate CSF glucose in rodent. It is well established that CSF glucose changes with blood glucose concentrations [21], consequently, glucose was injected in the blood. Ten rats (SD, male, 3 months old) were used for this study. Five rats were fasted for 24 h before the experiment, and five other rats were fed ad libitum. The day of the experiment, rats were anesthetized with isoflurane (4% induction, 1.5% maintenance), and a non-survival surgery was performed to catheterize the femoral artery for blood collection and the jugular vein for glucose infusion. Two PE50 tubes of about 1 m each were used for the catheterization and blood clotting was avoided using 10% heparin (Hospira, USA) in the saline solution. Dead volume was about 0.4 mL. After surgery, the rat was placed in a dedicated cradle equipped with bite and ear bars. Temperature and respiratory rate were monitored during the acquisition.
Experiments were performed at 4.7 T (Bruker MRI), using a volume excitation and surface coil detection configuration. A 3D image was performed to determine the animal position in the MRI. T2 measurements of the whole head was performed using a multi-echo CPMG sequence with TR = 20,000 ms, TE(1024) = 2/2048 ms (intervals of 2 ms). This measurement was repeated 3 times, every 30 min, for a total time of 1.5h. Before each T2 measurement, glycemia was measured using a glucometer (OneTouch UtraMini, Lifescan, USA) and one-time usage test strips (OneTouch Utra, Lifescan, USA). For this measurement, blood was collecting from the femoral vein catheter going out of the MRI scanner. At the end of the first T2 measurement, a bolus of glucose (0.4 mL, 20% glucose in water) was injected via the jugular vein catheter, followed by continuous glucose infusion (10% in water, 0.05 mL/min). The infusion was stopped at the end of the experiment, just after the end of the third T2 measurement. The rat was then placed in a stereotaxic frame and the skin of the neck was shaved and opened. The cisterna magna was exposed by separating the neck muscles and then gently perforating with a 25G needle. CSF was then directly collected using a glass capillary and rapidly frozen at −20 °C for glucose analysis (see below).
2.4. MRI data analysis
2.4.1. Human
T2 maps were calculated by performing a bi-exponential fit of the pixel intensities using the robust least absolute residuals method in Matlab (MathWorks, MA). CSF-ROIs were drawn by hand in the lateral ventricles. The median T2 value within the CSF-ROI was reported as the CSF-T2 value for each subject.
2.4.2. Rodent
T2 mapping: T2 values were calculated by performing a mono-exponential fit of the pixel or echo intensities. ROIs were drawn on the lateral ventricles, and the T2 maps were derived by fitting.
T2 measurement by spectroscopy: The T2 data was fitted using a linear least squares with nonnegativity constraints method (NNLS; Matlab lsqnonneg function, MathWorks; [22]). For the data presented here, no regularization was used. T2 values were assigned to 1000 bins with an equal separation of 2 ms (covers 2–2000 ms) for the fitting. We obtained a spectrum with three groups of peaks. The first group was assigned to brain and muscle tissue T2, the second was assigned to fat T2 and the third was assigned to CSF T2 (Fig. 2B). The average value of peak assigned to CSF was used to quantitate the T2.
Fig. 2.
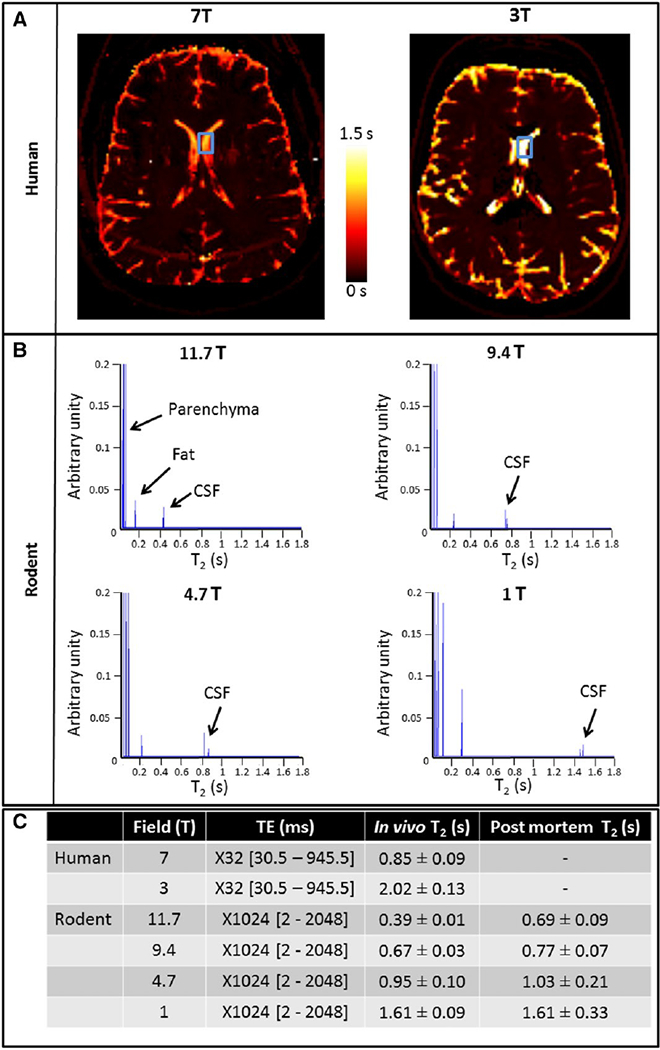
In vivo human and rodent CSF T2 measurement at different field strength. A. CSF T2 was measured at different field strengths. In humans, T2 mapping was performed at 7 T and 3 T. Images show an apparently longer CSF T2 at 3 T than at 7 T (according to the color scale). The blue boxes represent the ROIs drown in the lateral ventricles. B. In rodent, spectroscopic sequences were used to measure CSF T2 of the whole head at 11.7 T, 9.4 T, 4.7 T, and 1 T. There are 3 peaks in the spectra, the first corresponding to parenchyma with very short T2 (0–0.1 s), the second to fat with short T2 (0.1–0.2 s), and the last to CSF with the longest T2 (0.3–2 s). C. Quantification of CSF T2 in vivo shows longer T2 values at low field in both Human and rodent. For rodent, CSF T2 post mortem got longer at higher field likely due to CSF flow in the brain/head gradients.
2.4.3. Solutions (CSF and solute)
T2 was extracted from spectroscopic measurements using NNLS method [23]. Only a single component was found in the solution data and the average value of this component was used.
For each solute (proteins, metals and glucose), ΔR2 (1/T2; s−1) values were plotted against solute concentration (mM). Relaxivity r2 (mM−1·s−1) was then computed (ΔR2 = r2 × [solute]). Each solute’s concentration in healthy human CSF was measured. Based on this concentration, ΔR2 value in human healthy CSF for each solute was calculated using ΔR2 = r2 × [BSA] + b assuming the in vitro values for relaxivities.
CSF protein concentration was quantified according to the method of Bradford (Quick start Bradford protein kit, Bio Rad, USA). A reference of 1 mg·mL−1 of BSA was used [24]. CSF paramagnetic metal (Cu, Fe, Mn, and Zn) concentration was quantified by inductively coupled plasma mass spectrometry technique (IC-PMS, Exova, California). CSF glucose concentration was performed using a colorimetric technique (Gluc kit, Sigma, USA). A reference of 1 mg·mL−1 of glucose was used. T1 mapping: T1 values were calculated by performing a mono-exponential fit of echo intensities. ROIs were manually drawn in the area cor-responding to liquid in the tube and T1 map was derived by fitting.
3. Results
3.1. Ex vivo CSF T2 measurement
Data from human, rodent and non-human primate (NHP) are shown in Table 2. Saline was used as a control and had a T2 of about 3.0 s. The average human CSF T2 was 2.1 s. Rodent and NHP T2s were 1.8 s and 1.9 s, respectively. Representative signal T2 decay is shown in Sup Fig. 1.
Table 2.
T1 and T2 of ex vivo CSF samples. CSF samples were collected from healthy humans, rats and monkeys. The relaxation times were measured at 37 °C on a 14.1 T Bruker scanner using a multi-echo CPMG sequence with TR = 20,000 ms, TE(2048) = 2/2048 ms (intervals of 1 ms). Values are represented as mean ± standard deviation.
| Sample name | n | T1 (s) at 14.1 T | T2 (s) at |
|---|---|---|---|
| Saline | 4 | 4.20 ± 0.29 | 3.07 ± 0.24 |
| Human | 3 | 4.22 ± 0.30 | 2.14 ± 0.11 |
| Rodent | 4 | 3.98 ± 0.03 | 1.79 ± 0.04 |
| NHP | 3 | 4.04 ± 0.21 | 1.87 ± 0.13 |
3.2. CSF T2 values from MRI are sequence and magnetic field dependent
Heavily T2-weighted images of human brain (Fig. 1A) and rodent brain (Fig. 1C) show high signal within the CSF surrounding the brain and inside the ventricles. The contrast to noise ratio between CSF and tissue was ~ 30:1 for human and ~ 16:1 for rodent. A conventional T2 mapping measured a T2 of 887 ± 50 ms for human CSF at 3 T and 174 ± 27 ms for rodent CSF at 4.7 T (Fig. 1B and D). Representative T2 decay curve for human and signal T2 decay for rodent are shown in Sup Figs 2 and 3, respectively.
Fig. 1.
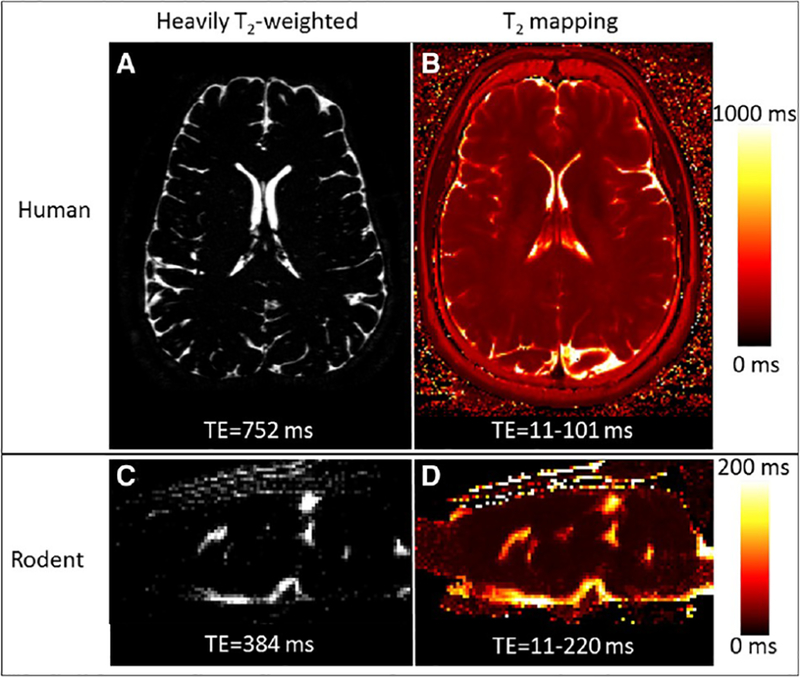
In vivo human and rodent CSF T2 measurement. Human imaging was performed on a 3 T Siemens Skyra and rodent imaging on a 4.7 T Bruker. Heavily T2-w images are shown in panel A (TE = 752 ms) and C (TE = 384 ms). B. Human T2 mapping was performed using a FSE sequence with TR = 3500 ms, TE(2) = 11/101 ms, in-plane resolution 0.5 mm, and slice thickness 3 mm. D. Rodent T2 mapping was performed using a MSME sequence, TR = 4000 ms, TE(20) = 10.95/219 ms (intervals of 10.95 ms), in-plane resolution 0.3 mm, and slice thickness 1 mm. ROIs were manually drawn in the lateral ventricles and the resulting T2 values were 887 ± 50 ms for human CSF and 174 ± 27 for rodent CSF.
Changes in the T2 mapping sequence to minimize applied imaging gradients led to an increased CSF T2 measured from human brain of 2.02 s at 3 T (Fig. 2A). This is consistent with the ex vivo T2 measurement at low field (4.7 T) and indicates that judicious use of MRI sequence parameters can get an accurate T2 at 3 T. Interestingly, the apparent human CSF T2 dropped to 850 ms at 7 T even though the sequence was the same as that used at 3 T. Representative T2 curves are shown in Sup Fig. 2.
To explore the reasons for the apparent shorter T2 at high field, the rodent brain was studied. To eliminate the possibility of MRI sequence causing effects, a spectroscopic T2 measurement was made from the entire rodent head (Fig. 2B). The long T2 of CSF compared to fat or tissue T2 enabled an unambiguous assignment of CSF in the T2 relaxograms. An apparent T2 of 0.4 s was measured at 11.7 T significantly shorter than the ex vivo measurement. CSF T2 was measured at 9.4, 4.7, and 1 T to determine the effects of magnetic field. The T2 of rodent CSF in vivo was 1.5 s at 1 T approaching the ex vivo measurement of 1.8 s. Representative signal T2 decay is shown in Sup Fig. 4.
CSF flow in and out of the slice or through residual field gradients would be expected to shorten CSF T2. To test this hypothesis, CSF T2 was measured in live rodent (CSF flowing) and in post mortem rodent (no CSF flow). CSF T2 values were about the same in live and post mortem rodent at 1 T where residual magnetic field gradients are small (1.6 s; Fig. 2C). There was an increasing difference as the field strength increased and at 11.7 T there was a 77% difference in T2 from live (0.4 s) and post-mortem rodent (0.7 s; Fig. 2C).
Data for the magnetic field dependence of ex vivo and in vivo rodent and human CSF R2 as well as saline R2 is plotted in Fig. 3. There is almost no change of saline R2 measured at 4.7 T and 14.1 T (ratio of 0.94) and a bigger change was observed for ex vivo CSF of human and rodent between 4.7 T and 14.1 T (ratio of 0.85 and 0.70, respectively). Both in vivo human and rodent CSF R2s decrease with decreasing field strength. The in vivo human CSF R2 approaches the ex vivo values by 3 T and the in vivo rodent CSF R2 approaches the ex vivo values only at 1 T.
Fig. 3.
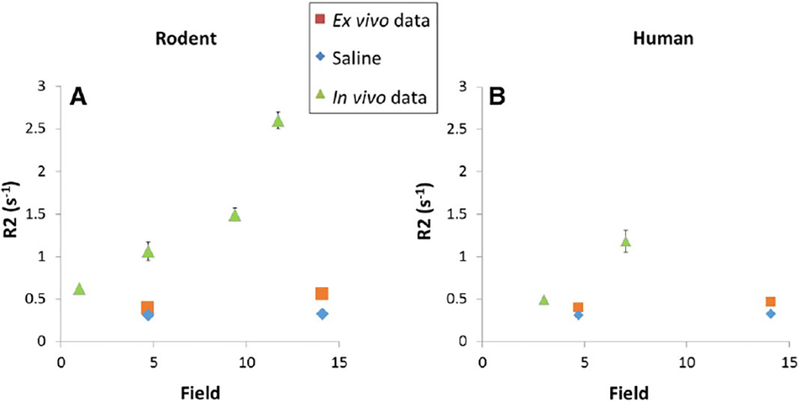
R2 differences between saline, ex vivo and in vivo rodent and Human CSF at different field. A. Rodent CSF and saline T2 measurement were performed using a multi-echo CPMG sequence with TR = 10,000 ms at 1 T and TR = 20,000 ms at 4.7 T, 9.4 T and 14.1 T; TE(1024) = 2/2048 ms (intervals of 2 ms) at 1, 4.7 and 9.4 T and TE(2048) = 2/2048 ms (intervals of 1 ms) at 14.1 T. Scans were performed at 1, 4.7. 9.4 and 11.7 T for in vivo data and at 14.1 and 4.7 T for ex vivo data. B. Human CSF T2 measurements were performed using two different sequences. In vivo CSF T2 measurements were performed by a multi-contrast spin echo sequence with TR = 10,000 ms and 32 TEs equally spaced between 30.5 and 945.5 ms. Ex vivo CSF and saline T2 measurements were performed using the same multi-echo CPMG sequence detailed above for rodent.
3.3. What causes the shortening of CSF T2 as compared to saline T2?
To test whether paramagnetic metals, ions, proteins, and/or glucose can explain the T2 relaxivity of CSF as compared to saline, in vitro relaxivities were measured. BSA was used as a surrogate for CSF protein. Relaxivity data for Zn, Cu, Fe, Mn, glucose and BSA is shown in Fig. 4. The concentration of each of the relevant species was measured in CSF samples (Fig. 4B). The concentration of metals was too low to significantly modify CSF T2 relaxivity (b 0.5%). Proteins can explain approximately 15% of the shortening of CSF T2. Interestingly, the glucose concentration is high enough to cause most of the shortening to CSF T2 with respect to saline T2. Indeed, the human CSF R2 of approximately 0.5 is explained primarily by the R2 of saline (approximately 0.3) plus the R2 of glucose (approximately 0.2). The T2 relaxivity of glucose is quite low (0.067 mM−2 s−1) but the very long T2 of CSF enables the high concentrations of glucose (~ 3 mM) to dominate the T2 relaxivity of CSF.
3.4. Chemical exchange does not explain the in vivo vs ex vivo T2 discrepancy at high field
A major mechanism to explain relaxation by glucose is exchange of protons between glucose and water. To test whether chemical exchange can explain the difference of T2 values at high field between in vivo and ex vivo (data shown in Fig. 3), in vitro relaxivities of glucose and BSA solutions at different pH were measured. These data were compared to in vivo and ex vivo rodent data, as well as saline and shown in Fig. 5. The range of glucose solutions R2s at pH 2, 7 and 10 were between 0.27 ± 0.02 and 0.65 ± 0.03 at 14.1 T and between 0.36 ± 0.01 and 0.59 ± 0.02 at 4.7 T. For the BSA, the range of R2 at pH 2, 7 and 10 were between 0.26 ± 0.02 and 0.39 ± 0.04 at 14.1 T and between 0.34 ± 0.03 and 0.41 ± 0.01 at 4.7 T. These data overlap with ex vivo CSF R2 (0.56 ± 0.01 at 14.1 T and 0.39 ± 0.03 at 4.7 T). Glucose R2, at different pH are very different from in vivo CSF R2 at high field (2.6± 0.1 at 11.7 T) suggesting that chemical exchange is not a major contributor to the T2 difference between in vivo and ex vivo data at high field.
Fig. 5.
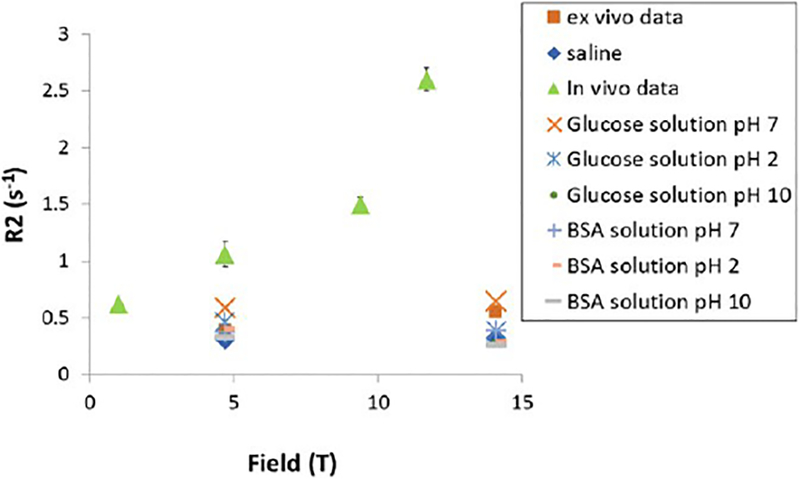
Effect of chemical exchange on rodent CSF R2 values. T2 measurement of rodent CSF in vivo and ex vivo, saline, glucose and BSA solutions were performed using a multi-echo CPMG sequence with TR = 10,000 ms at 1 T and TR = 20,000 ms at 4.7 T, 9.4 T and 14.1 T; TE(1024) = 2/2048 ms (intervals of 2 ms) at 1, 4.7 and 9.4 T and TE(2048) = 2/2048 ms (intervals of 1 ms) at 14.1 T. Scans were performed at 1, 4.7. 9.4 and 11.7 T for in vivo data and at 14.1 and 4.7 T for ex vivo data as well as for saline, glucose and BSA solutions. Glucose and BSA solutions were prepared in saline at a concentration of 4 mM and 0.01 mM, respectively, to mimic CSF physiological values. The pH of both, glucose and BSA solutions is at 7 and it was changed to be acidic (pH 2) and basic (pH 10).
3.5. CSF T2 depends on serum glucose concentration
The strong contribution of glucose to the CSF relaxivity opens the possibility of measuring changes in CSF glucose by measuring changes in CSF T2. An in vivo experiment was performed to determine if CSF T2 changes with changes in CSF glucose concentration. To increase the size of the glucose change caused by infusion, five animals were fasted to lower blood and CSF glucose concentrations and five other animals were fed ad libitum. One of the “fed ad libitum” rat could not be used, consequently the total of rats was nine. Experiments would have been best done at 1 T where the measured T2 is longest (best dynamic range), however, due to availability of MRI time, these experiments were performed at 4.7 T. For each rat, CSF puncture was performed at the end of the experiment, before euthanasia; because of the technical difficulty of CSF puncture only seven CSF samples were obtained from the nine rats that were used in this experiment. The protocol used and the R2 results are show in Fig. 5. There was good correlation between the R2 measured in both the blood glucose (Fig. 5B) and CSF glucose (Fig. 6C). The correlation between CSF T2 and blood glucose (glycemia) had a R2 = 0.71 (p b 0.001; Fig. B) and the correlation between CSF T2 and CSF glucose (glycorrhachia) had a R2 = 0.93 (p b 0.005; Fig. 6C). Thus, CSF T2 values change when CSF glucose is varied in this model of increased blood glucose.
Fig. 6.
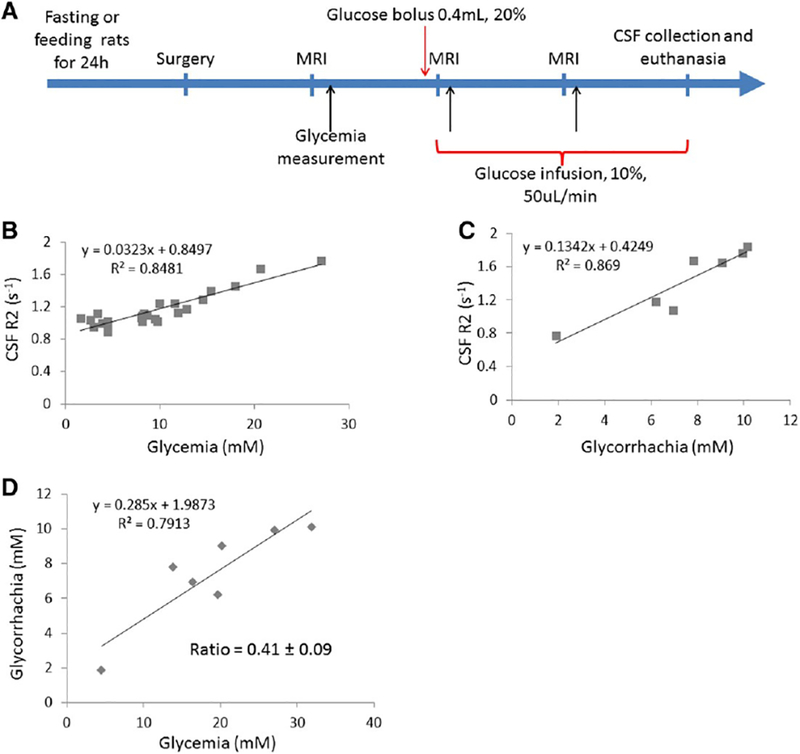
CSF T2 depends on glycemia A. Experimental scheme. Surgery was performed under anesthesia to catheterize both jugular vein and femoral artery. Black arrow corresponds to serum glucose concentration measurement via the femoral artery. The rat is kept within the MRI scanner (4.7 T Bruker MRI system). B. CSF R2 values measured at 3 time point as shown in A using the spectroscopy sequence, plotted against serum glucose concentration values (n = 9 rats). C. CSF R2 values measured at the end of the experiment, just before CSF collection, plotted against CSF glucose concentration values (n = 7). CSF was collected just after the last MRI acquisition and before euthanasia. D. Glycorrhachia as a function of glycemia (n = 7 rats). The ratio of glycorrhachia to glycemia is 0.42.
The ratio of rodent CSF glucose and serum glucose was 0.41 (Fig. 6D) which is close to the value of 0.6 previously measured in rodent and human [21,25]. The apparent T2 relaxivity for glucose derived from this experiment was 0.13 mM−1 s−1 (slope of line in Fig. 6C), higher than the in vitro value of 0.07 mM−1 s−1. These discrepancies are likely due to the fact that the protocol was not designed to make sure glucose concentrations in the CSF had fully equilibrated and were sampled at the same time as T2 was measured.
4. Discussion
In this study, the transverse relaxation time (T2) of CSF was measured ex vivo and in vivo to determine the values for CSF T2 and understand the factors that may lead to N 10-fold variation in CSF T2s in the literature (Table 1). In vitro CSF T2 measurements were approximately 2 s for human, non-human primate and rodent. A similar value for T2 of CSF could be obtained from human brain at 3 T and from rodent brain at 1 T. Higher field measurements led to apparent shorter T2 most likely due to residual field gradients in the CSF caused by the brain tissue at the higher fields. While the ex vivo T2 value of CSF was long, it was still shorter than the T2 of saline. Glucose was identified as the predominant CSF component which can explain the shorter CSF T2 in vitro as compared to saline. This opens the possibility of using CSF T2 to monitor CSF glucose. This was confirmed in vivo in rodent by glucose infusion and simultaneous CSF T2 measurement, opening the possibility of studying glucose regulation of CSF at MRI resolution.
4.1. In vivo CSF T2 depends on field strength and sequences parameters
Ex vivo, CSF T2 was much longer than a conventional in vivo CSF T2 measurements using standard FSE or MSME sequences both in human and rodent brain. This result agrees with previous concerns raised in the literature. Indeed, it has been shown that conventional T2 mapping sequences could be affected by residual field gradients and spurious echoes from these sequences [26,27]. Therefore, minimizing the residual imaging gradients using an adequate sequence and decreasing residual tissue gradients by using lower magnetic field strength as we did in our study, led to longer apparent T2 measurements of CSF. Indeed, human in vivo CSF T2 approached the in vitro data at 3 T while the rodent in vivo CSF T2 approached in vitro data at 1 T. Longer echo times should lead to shorter apparent T2s due to longer diffusion distances for water in the residual gradients. Flow of CSF in residual gradients could also shorten T2 [28]. Therefore, in our study we showed that eliminating CSF flow in the post-mortem rodent brain lengthened the measured T2 excepted at 1 T, where residual tissue gradients had a minimal effect on T2.
A spectroscopy pulse sequence was used in rodents to eliminate imaging gradients completely which achieved the longest T2’s measured here. However, even at 1 T rodent CSF T2 values in vivo did not reach the long values of T2 measured ex vivo implying that tissue gradients still contribute to the shortening of T2. Also, tissue gradient are expected to have larger impact on rodents CSF T2 due to the small size of the CSF spaces compare to that in humans. In the human brain, a simple multiple TE spin echo acquisition with a long TR led to the longest T2s as compared to clinically conventional used two point T2 mapping pulse sequence based on a fast spin echo. At 3 T, human CSF measured was about 2 s which is on the low end of values obtained ex vivo (2–2.8 s).
Implementing a spectroscopic measurement of human CSF T2, as was done for the rodents, would allow us to assess how many residual imaging gradients decreased the T2 at 3 T. At 7 T, it is clear that tissue gradients begin to shorten the apparent CSF T2 in humans since the CSF T2 dropped from 2 to 0.85 s even when using the same MRI pulse sequence as used at 3 T.
Previous data from both, human and rodent, show a large range of values for T2. Typically, these measurements did not attempt to minimize residual gradients that might affect T2 measurements [28,29,30]. One report has longer CSF T2 values [30,31,32,33] which were measured at low field and likely used imaging pulse sequences with lower applied field gradients available at the time. In vitro human CSF T2 values have been reported to be 2.64 s at 2.33 T [34] and 1.82 at 0.25 T [35] consistent with the results in the present study.
4.2. CSF T2 depends on glucose concentration
Even though CSF has a very low content of biological molecules, the ex vivo T2 of CSF in this study was still shorter than the T2 of saline. In contrast, CSF T1 was very similar to saline T1. It is well known that relaxation agents tend to have a higher T2 relaxivity than T1 relaxivity. To understand the origin of the shorter T2 of CSF as compared to saline, the relaxivity of major constituents of CSF were measured and compared to measured concentrations in CSF. The results indicate that metals concentrations were too low to significantly change the CSF T2 while protein concentration was high enough to have a small effect on CSF T2. In this study, we used albumin relaxivity as a representative of CSF protein. Thus, differences in protein relaxivities will probably affect this determination to some extent. Glucose is the component with the highest concentration in CSF and interestingly, the T2 relaxivity of glucose is large enough to affect CSF T2 proportionally to glucose CSF concentration. These results suggest that CSF T2 can be used as a measure for CSF glucose concentration. Consistent with this, a change in CSF T2 was measured as CSF glucose was varied in the rodent brain by varying the blood glucose level with infusion of glucose. This opens the possibility of studying regulation of glucose levels in human CSF at the MRI resolution.
There has been recent interest in using glucose as a contrast agent for MRI. Yadav et al., showed that T2 of blood depends on glucose concentration [36]. They found a glucose T2 relaxivity of 0.02, 0.06, and 0.08 mM−1 s−1 at 3.0, 7.0, and 11.7 T, respectively. The relaxivity in blood at 11.7 T was 0.09 mM−1 s−1. In agreement with their results, a relaxivity of glucose in water of 0.07 mM−1 s−1 at 14.1 T and 0.04mM−1 s−1 at 4.7 T was measured. There is a field dependence for all solutions most likely due to chemical exchange effects. For CSF, we show that exchange can be important for explaining the difference between in vivo and in vitro T2 relaxivity but this is not large enough to explain differences at high field where the background gradient effects most likely explain the difference between in vivo and in vitro T2. However, for accurate quantitation of glucose from T2, care will have to be taken to account for factors that may affect exchange such as CSF pH. Yadav et al. performed an in vivo study after a glucose bolus injection while imaging the liver, and demonstrated a 10% drop in signal intensity after glucose infusion followed by recovery of the signal intensity after about 50–100 s. They concluded that glucose can be used as a T2 contrast agent for MRI at concentrations that are already approved for human use.
Another approach to detect glucose as a possible MRI contrast agent is to measure chemical exchange of protons from glucose to water using the chemical exchange saturation transfer (CEST) MRI. Glucose, used as a CEST agent (glucoCEST), was first described by two groups: Walker-Samuel et al. and Chan et al. and shown to be detectable in rodent brain [37,38]. Recent work by Xu et al., used natural D-glucose as a contrast agent for CEST [39]. They explored the feasibility of using D-glucose for dynamic perfusion imaging to detect malignant mouse brain tumors based on blood-brain-barrier breakdown after an intravenous bolus of D-glucose. The time-resolved glucose signal changes were detected using glucoCEST MRI. They showed that dynamic glucoCEST MRI is a feasible technique for studying brain tumor enhancement, reflecting differences in tumor blood volume and permeability with respect to normal brain. The long T1 of CSF allows glucoCEST to be performed in CSF. In general, CEST experiments are much less sensitive than T2 weighted MRI, however, they do not suffer from the issues of residual gradients that affect CSF T2 measurements. CEST studies to determine glucose may complement CSF T2 changes especially in cases where increased protein due to tissue degradation or increased cellularity may also affect CSF T2.
In conclusion, this work demonstrates that quantitating CSF T2 is very difficult due to the long T2 of CSF. Any residual gradients either from the imaging sequence or residual tissue gradients especially at higher magnetic fields leads to an apparent shortening of the measured T2. Interestingly, both the very long T2 of CSF and the fact that glucose is the dominant contributor to the relaxation properties of CSF lead to the intriguing possibility that regulation of CSF glucose can be studied by simply using T2 weighted MRI.
Supplementary Material
Acknowledgements
This study was supported by the Intramural Research Program of the National Institute of Neurologic Disorders and Stroke (NINDS) (BN42639), National Institutes of Health.
Abbreviations:
- CNR
contrast to noise ratio
- CPMG
multiecho Car-Purcell-Meiboom-Gill
- CSF
cerebrospinal fluid
- T1
longitudinal relaxation time
- T2
transversal relaxation time
Contributor Information
A. Daoust, Email: alexia.daoust@nih.gov.
S. Dodd, Email: doddst@ninds.nih.gov.
G. Nair, Email: govind.bhagavatheeshwaran@nih.gov.
N. Bouraoud, Email: bouraoudn@ninds.nih.gov.
S. Jacobson, Email: JacobsonS@ninds.nih.gov.
S. Walbridge, Email: stuartwalbridge@mail.nih.gov.
D.S. Reich, Email: reichds@ninds.nih.gov.
A. Koretsky, Email: KoretskyA@ninds.nih.gov.
References
- [1].Manfredonia F, Ciccarelli O, Khaleeli Z, et al. Normal-appearing brain T1 relaxation time predicts disability in early primary progressive multiple sclerosis. Arch Neurol 2007;64:411–5. [DOI] [PubMed] [Google Scholar]
- [2].Schenck JF, Zimmerman EA. High-field magnetic resonance imaging of brain iron: birth of a biomarker? NMR Biomed 2004;17:433–45. [DOI] [PubMed] [Google Scholar]
- [3].Deoni SCL, Mercure E, Blasi A, et al. Mapping infant brain myelination with magnetic resonance imaging. J Neurosci 2011;31:784–91. [DOI] [PMC free article] [PubMed] [Google Scholar]
- [4].Saito N, Sakai O, Ozonoff A, Jara H. Relaxo-volumetric multispectral quantitative magnetic resonance imaging of the brain over the human lifespan: global and regional aging patterns. Magn Reson Imaging 2009;27:895–906. [DOI] [PubMed] [Google Scholar]
- [5].Jackson GD, Connelly A, Duncan JS, Grünewald RA, Gadian DG. Detection of hippocampal pathology in intractable partial epilepsy: increased sensitivity with quantitative magnetic resonance T2 relaxometry. Neurology 1993;43:1793–9. [DOI] [PubMed] [Google Scholar]
- [6].Reutens DC, Stevens JM, Kingsley D, et al. Reliability of visual inspection for detection of volumetric hippocampal asymmetry. Neuroradiology 1996;38:221–5. [DOI] [PubMed] [Google Scholar]
- [7].Li L, Wang X-Y, Gao F-B, et al. Magnetic resonance T2 relaxation time at 7 Tesla associated with amyloid β pathology and age in a double-transgenic mouse model of Alzheimer’s disease. Neurosci Lett 2016;610:92–7. [DOI] [PubMed] [Google Scholar]
- [8].Piper RJ, Mikhael S, Wardlaw JM, Laidlaw DH, Whittle IR, Bastin ME. Imaging signatures of meningioma and low-grade glioma: a diffusion tensor, magnetization transfer and quantitative longitudinal relaxation time MRI study. Magn Reson Imaging 2016;34:596–602. [DOI] [PMC free article] [PubMed] [Google Scholar]
- [9].Schilling A, Blankenburg F, Bernarding J, Heidenreich J, Wolf K. Intracerebral pH affects the T2 relaxation time of brain tissue. Neuroradiology 2002;44:968–72. [DOI] [PubMed] [Google Scholar]
- [10].Schutzer SE, Liu T, Natelson BH, et al. Establishing the proteome of normal human cerebrospinal fluid. PLoS One 2010;5:e10980. [DOI] [PMC free article] [PubMed] [Google Scholar]
- [11].Tichy J, Alling C, Dencker SJ, Svennerholm L. Fatty acid profiles of cerebrospinal fluid lipids in normals and chronic alcoholics. Scand J Clin Lab Invest 1970;25:191–7. [DOI] [PubMed] [Google Scholar]
- [12].Leen WG, Willemsen MA, Wevers RA, Verbeek MM. Cerebrospinal fluid glucose and lactate: age-specific reference values and implications for clinical practice. PLoS One 2012;7:e42745. [DOI] [PMC free article] [PubMed] [Google Scholar]
- [13].Roos PM, Vesterberg O, Syversen T, Flaten TP, Nordberg M. Metal concentrations in cerebrospinal fluid and blood plasma from patients with amyotrophic lateral sclerosis. Biol Trace Elem Res 2013;151:159–70. [DOI] [PubMed] [Google Scholar]
- [14].Riddoch D, Thompson RA. Immunoglobulin levels in the cerebrospinal fluid. Br Med J 1970;1:396–9. [DOI] [PMC free article] [PubMed] [Google Scholar]
- [15].Seyfert S, Faulstich A, Marx P. What determines the CSF concentrations of albumin and plasma-derived IgG? J Neurol Sci 2004;219:31–3. [DOI] [PubMed] [Google Scholar]
- [16].LeVine SM, Lynch SG, Ou CN, Wulser MJ, Tam E, Boo N. Ferritin, transferrin and iron concentrations in the cerebrospinal fluid of multiple sclerosis patients. Brain Res 1999;821:511–5. [DOI] [PubMed] [Google Scholar]
- [17].Kanoh Y, Ohtani H. Levels of interleukin-6, CRP and alpha 2 macroglobulin in cerebrospinal fluid (CSF) and serum as indicator of blood-CSF barrier damage. Biochem Mol Biol Int 1997;43:269–78. [DOI] [PubMed] [Google Scholar]
- [18].Gao KC, Nair G, Cortese ICM, Koretsky A, Reich DS. Sub-millimeter imaging of brainfree water for rapid volume assessment in atrophic brains. NeuroImage 2014;100: 370–8. [DOI] [PMC free article] [PubMed] [Google Scholar]
- [19].Brittain JH, Hu BS, Wright GA, Meyer CH, Macovski A, Nishimura DG. Coronary angiography with magnetization-prepared T2 contrast. Magn Reson Med 1995;33: 689–96. [DOI] [PubMed] [Google Scholar]
- [20].Liu R-Y, Zhou J-N, van Heerikhuize J, Hofman MA, Swaab DF. Decreased melatonin levels in postmortem cerebrospinal fluid in relation to aging, Alzheimer’s disease, and apolipoprotein E-ε4/4 genotype. J Clin Endocrinol Metab 1999;84:323–7. [DOI] [PubMed] [Google Scholar]
- [21].Nigrovic LE, Kimia AA, Shah SS, Neuman MI. Relationship between cerebrospinal fluid glucose and serum glucose. N Engl J Med 2012;366:576–8. [DOI] [PubMed] [Google Scholar]
- [22].Graham SJ, Stanchev PL, Bronskill MJ. Criteria for analysis of multicomponent tissue T2 relaxation data. Magn Reson Med 1996;35:370–8. [DOI] [PubMed] [Google Scholar]
- [23].Prasloski T, Mädler B, Xiang Q-S, MacKay A, Jones C. Applications of stimulated echo correction to multicomponent T2 analysis. Magn Reson Med 2012;67:1803–14. [DOI] [PubMed] [Google Scholar]
- [24].Bradford MM. A rapid and sensitive method for the quantitation of microgram quantities of protein utilizing the principle of protein-dye binding. Anal Biochem 1976; 72:248–54. [DOI] [PubMed] [Google Scholar]
- [25].Steffens AB, Scheurink AJ, Porte D, Woods SC. Penetration of peripheral glucose and insulin into cerebrospinal fluid in rats. Am J Physiol Regul Integr Comp Physiol 1988; 255:R200–4. [DOI] [PubMed] [Google Scholar]
- [26].Crawley AP, Henkelman RM. Errors in T2 estimation using multislice multiple-echo imaging. Magn Reson Med 1987;4:34–47. [DOI] [PubMed] [Google Scholar]
- [27].Poon CS, Henkelman RM. Practical T2 quantitation for clinical applications. J Magn Reson Imaging 1992;2:541–53. [DOI] [PubMed] [Google Scholar]
- [28].Weigel M, Hennig J. Diffusion sensitivity of turbo spin echo sequences. Magn Reson Med 2012;67:1528–37. [DOI] [PubMed] [Google Scholar]
- [29].Piechnik SK, Evans J, Bary LH, Wise RG, Jezzard P. Functional changes in CSF volume estimated using measurement of water T2 relaxation. Magn Reson Med 2009;61: 579–86. [DOI] [PubMed] [Google Scholar]
- [30].Jezzard P, Duewell S, Balaban RS. MR relaxation times in human brain: measurement at 4 T. Radiology 1996;199:773–9. [DOI] [PubMed] [Google Scholar]
- [31].Crémillieux Y, Ding S, Dunn JF. High-resolution in vivo measurements of transverse relaxation times in rats at 7 Tesla. Magn Reson Med 1998;39:285–90. [DOI] [PubMed] [Google Scholar]
- [32].Hopkins AL, Yeung HN, Bratton CB. Multiple field strength in vivo T1 and T2 for cerebrospinal fluid protons. Magn Reson Med 1986;3:303–11. [DOI] [PubMed] [Google Scholar]
- [33].Larsson HB, Frederiksen J, Petersen J, et al. Assessment of demyelination, edema, and gliosis by in vivo determination of T1 and T2 in the brain of patients with acute attack of multiple sclerosis. Magn Reson Med 1989;11:337–48. [DOI] [PubMed] [Google Scholar]
- [34].Castro ME, Boisvert DP, Treiber EO, Lunt JA, Allen PS. Effect of CSF albumin concentration on NMR relaxation parameters. In: Inaba PDY, Klatzo DI, Spatz DM, editors. Brain Edema: Springer Berlin Heidelberg; 1985. p. 594–600. [Google Scholar]
- [35].Go KG, van Dijk P, Luiten AL, et al. Interpretation of nuclear magnetic resonance tomograms of the brain. J Neurosurg 1983;59:574–84. [DOI] [PubMed] [Google Scholar]
- [36].Yadav NN, Xu J, Bar-Shir A, et al. Natural D-glucose as a biodegradable MRI relaxation agent. Magn Reson Med 2014;72:823–8. [DOI] [PMC free article] [PubMed] [Google Scholar]
- [37].Chan KWY, McMahon MT, Kato Y, et al. Natural D-glucose as a biodegradable MRI contrast agent for detecting cancer. Magn Reson Med 2012;68:1764–73. [DOI] [PMC free article] [PubMed] [Google Scholar]
- [38].Walker-Samuel S, Ramasawmy R, Torrealdea F, et al. In vivo imaging of glucose uptake and metabolism in tumors. Nat Med 2013;19:1067–72. [DOI] [PMC free article] [PubMed] [Google Scholar]
- [39].Xu X, Chan KWY, Knutsson L, et al. Dynamic glucose enhanced (DGE) MRI for combined imaging of blood-brain barrier break down and increased blood volume in brain cancer. Magn Reson Med 2015;74:1556–63. [DOI] [PMC free article] [PubMed] [Google Scholar]
- [40].Kjos B, Ehman R, Brant-Zawadzki M, Kelly W, Norman D, Newton T. Reproducibility of relaxation times and spin density calculated from routine MR imaging sequences: clinical study of the CNS. Am J Roentgenol 1985;144:1165–70. [DOI] [PubMed] [Google Scholar]
Associated Data
This section collects any data citations, data availability statements, or supplementary materials included in this article.