. 2019 Oct 1;8:e49062. doi: 10.7554/eLife.49062

Figure 2. Fractionation of Ciona follicles.

(A) Isolated follicles were fractionated using stainless steel sieves of varying particle sizes (20, 38, 63, 90, or 150 μm). Each fraction contained respective stage of Ciona follicles corresponding to (i) early stage I, (ii) late stage I to early stage II, (iii) early stage II to late stage II, (iv) late stage II to late stage III, or (v) stage IV oocytes. (B) Immature/pre-ovulatory follicles were further divided into three groups as indicated, and representative follicles are shown before and after a 24 hr incubation. Scale bars in (A) and (B) represent 20 and 100 μm. (C) Size, GVBD rate, and ovulation rate of late stage II (n = 145), early stage III (n = 100), and late stage III (n = 99) follicles are shown as mean ± SEM.

Figure 2.

Figure 2—figure supplement 1. Transcriptomic profiles during follicular development.

Figure 2—figure supplement 1.

RNA-seq was performed using 500 ng of total RNA from fractionated follicles. The expression level of each gene was calculated and shown as the reads per kilobase, megareads (RPKM) in the scatter plot. Differentially expressed genes (DEGs) that were upregulated (>2 fold) or downregulated (<0.5 fold) between two consecutive fractions are indicated in black.
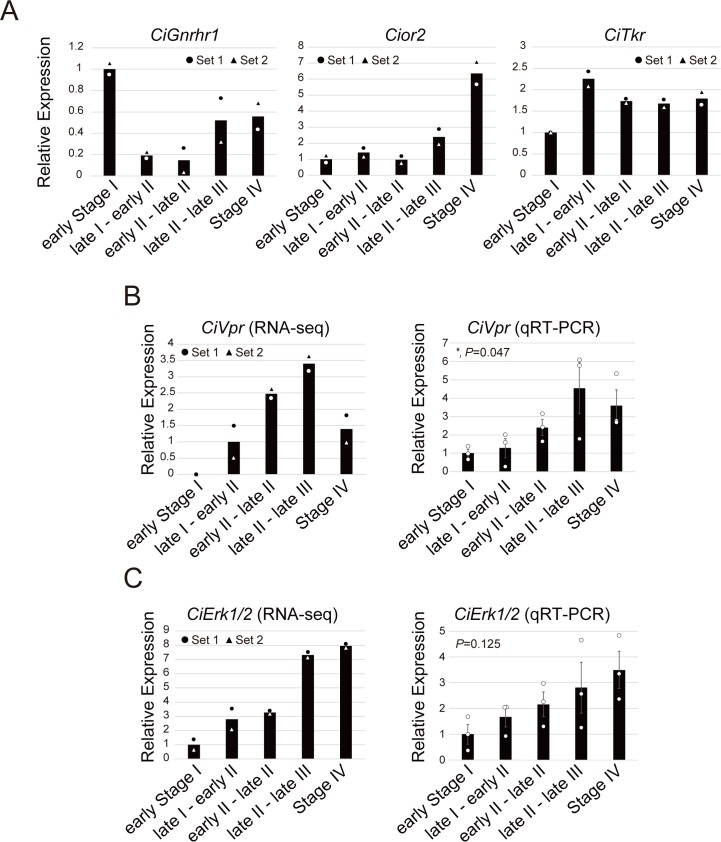
Figure 2—figure supplement 2. Expression of the CiVpr and CiErk1/2 genes increases toward oocyte maturation and ovulation.

Figure 2—figure supplement 2.

(A) Expression patterns of three receptors for the known neuropeptides, tGnRHs (CiGnRHR1), cionin (CioR2), and tachykinin (CiTKR). None of the receptors were specifically upregulated before GVBD and ovulation (late stage II to late stage III). (B, C) Expression patters of the CiVpr (B) and CiErk1/2 (C) were examined by RNA-seq (left) and qRT-PCR (right), respectively. Expression was normalized to that of the ubiquitin associated domain containing one gene (CiUbac1), which RNA-seq indicated is expressed constitutively throughout follicular development. Results are shown as mean with data points and/or mean ± SEM. The expression levels of early stage I or late stage I to early stage II were set as 1. Two and three independent sets of follicles were used for RNA-seq and qRT-PCR, respectively. The qRT-PCR data were analyzed by one-way factorial ANOVA (F = 3.55; *, p=0.047 for CiVpr and F = 2.34; p=0.125 for CiErk1/2) followed by Tukey’s post hoc test. Similar patterns were observed between RNA-seq and qRT-PCR, confirming upregulation of the two genes toward oocyte maturation and ovulation.
Figure 2—figure supplement 2—source data 1. Source data for Figure 2—figure supplement 2.
Relative expression values of the genes to CiUbac1 (RNA-seq and qRT-PCR data) are shown.
DOI: 10.7554/eLife.49062.008