Abstract
In this study, a single microphone speech enhancement algorithm is proposed to improve speech intelligibility for cochlear implant recipients. The proposed algorithm combines harmonic structure estimation with a subsequent statistical based speech enhancement stage. Traditional minimum mean square error (MMSE) based speech enhancement methods typically focus on statistical characteristics of the noise and track the noise variance along time dimension. The MMSE method is usually effective for stationary noise, but not as useful for non-stationary noise. To address both stationary and non-stationary noise, the current proposed method not only tracks noise over time, but also estimates the noise structure along the frequency dimension by exploiting the harmonic structure of the target speech. Next, the estimated noise is employed in the traditional MMSE framework for speech enhancement. To evaluate the proposed speech enhancement solution, a formal listener evaluation was performed with 6 cochlear implant recipients. The results suggest that a substantial improvement in speech intelligibility performance can be gained for cochlear implant recipients in noisy environments.
I. INTRODUCTION
Cochlear implant (CI) devices are able to provide deaf individuals with the ability to recover some level of hearing function. Currently, CI recipients achieve a relatively high degree of speech intelligibility in quiet environments. However, in noisy backgrounds their speech intelligibility capability drops dramatically. Previous research has shown that in noisy backgrounds, the speech reception threshold (SRT) of CI listeners is about 15 to 25 dB higher than for normal hearing listeners (Hochberg et al., 1992; Wouters and Vanden Berghe, 2001; Spriet et al., 2007). Therefore, developing effective speech enhancement algorithms is essential to improve speech perception for CI recipients.
Speech can be viewed as an over-redundant signal which is antagonistic to noise interference. Normal hearing listeners usually have little difficulty in understanding speech with mild to moderate levels of noise. Even at zero or negative signal-to-noise ratio (SNR) levels for certain types of noise, normal hearing listeners still can achieve high speech intelligibility. Conversely, CI recipients are only able to decode limited amounts of spectral and temporal information of speech which is delivered through a small number of CI encoding channels (e.g., 16 or 22 channels) (Patrick et al., 2006; Loizou, 2006). This limited spectral and temporal resolution often leaves CI recipients unable to discriminate target speech from corrupting background noise. To improve speech perception in noise for CI recipients, both single- and multiple-microphone based speech enhancement algorithms have been explored in previous studies (Kokkinakis et al., 2012; Koning, 2014). It has been shown that most single microphone noise reduction algorithms are effective under a stationary noise condition. However, their benefits are modest or disappear in fluctuating time-varying noise (Loizou, 2007). Multi-microphone speech enhancement algorithms are able to significantly increase speech intelligibility for CI recipients in both stationary and non-stationary noise. However, there is a strict assumption for multi-microphone based methods that speech and noise sources must be spatially separated. In some real scenarios, such as a diffuse sound field or when the target speech and noise arrive from the same direction, multiple-microphone algorithms have limited benefits. Thus, a single-microphone speech enhancement solution to improve speech perception for CI recipients remains an open problem. In addition, a single-microphone algorithm can be used to complement multi-microphone methods to improve speech perception in more diverse noisy scenarios (Hersbach et al., 2012). In this study, the aim is to improve speech intelligibility for CI recipients by developing an effective single microphone speech enhancement algorithm that employs estimated harmonic structure from the target speech.
For single-microphone based algorithms, previous research has been focused on two different aspects. One is developing front-end noise reduction algorithms before CI encoding (Hochberg et al., 1992; Weiss, 1993; Yang and Fu, 2005; Loizou et al., 2005; Li et al., 2009; Toledo et al., 2003). The other is optimizing the CI channel selection to deliver higher SNR speech sub-bands (Hu et al., 2007; Hu and Loizou, 2008; Buchner et al., 2008; Buechner et al., 2011; Nie et al., 2009; Hu and Loizou, 2010a; Hu et al., 2011; Dawson et al., 2011; Mauger et al., 2012; Hu et al., 2015). In the former case, noise reduction is performed to improve the speech representation before CI encoding. For example, the INTEL system was the earliest single microphone noise reduction algorithm evaluated for speech intelligibility of CI recipients. The algorithm for this system was an equivalent spectral subtraction method for the purpose of speech enhancement (Hochberg et al., 1992). Their listening test experiments showed that the phoneme recognition threshold in stationary noise can be improved by an average of 4 to 5 dB for CI subjects. More recently, a modified spectral subtraction method was developed for CI devices aimed at reducing musical artifact noise, by combining a variation-reduced gain function and spectral flooring (Yang and Fu, 2005). Significant speech intelligibility improvement was achieved for CI recipients for a speech-shaped noise condition, but not for a babble noise condition. A subspace based speech enhancement algorithm has also been developed (Loizou et al., 2005). In that method, the noisy signal vector was projected into the “signal” and “noise” subspaces while only the components from the signal subspace are retained for target speech estimation. Evaluation results showed significant improvement for processed versus unprocessed speech in a stationary noise condition.
For the alternative domain which focuses on CI channel optimization methods, strategies have been designed for selection of the CI encoding channels to efficiently deliver the speech signal to the electrode array for the improved auditory neural stimulation. An ideal binary mask (IdBM) based study has also demonstrated that SNR-dependent channel selection is more desirable than the current maximum envelope based N-of-M channel selection strategy (Hu and Loizou, 2008). Specifically, the CI channel with an SNR higher than the threshold would be considered as speech-dominated and retained; Otherwise it is considered mask-dominated and discarded. Although the time-frequency representation was coarse in that study (only 22 channels), the speech intelligibility of CI recipients was restored to the level attained in a quiet condition. This previous study therefore established an optimal upper-bound for channel selection based speech enhancement algorithms. An environment specific noise suppression algorithm was later developed based on a binary mask estimation using a Gaussian mixture model (GMM) (Hu and Loizou, 2010a). That method was able to improve speech perception for CI recipients in both stationary and non-stationary noise conditions. Furthermore, the soft mask based channel modification was investigated to attenuate low SNR channels while retaining high SNR channels (Hu et al., 2007; Dawson et al., 2011; Mauger et al., 2012; Hersbach et al., 2012). The advantage of a soft mask over a binary mask is that the environmental awareness is able to be retained for CI recipients, since low SNR channels are attenuated rather than completely removed (Hu et al., 2007). The sparsity characteristic of speech is also taken into account when developing an effective speech enhancement algorithm for CI devices. The “envelopegram” is basically decomposed into the basis and components matrices using a non-negative matrix factorization (NMF) (Hu et al., 2011). Accordingly, the enhanced target speech is therefore obtained in the NMF reconstruction stage.
Comparing the above two types of CI noise reduction algorithms, earlier researchers argued that preprocessing based methods may introduce additional processing based speech distortion in decomposition and reconstruction of speech signals (Hu and Loizou, 2010b; Dawson et al., 2011). However, according to a more recent studies (Qazi et al., 2012; Koning, 2014), speech perception differs between those with normal hearing and CI recipients. Specifically, CI listeners are more sensitive to noise interference than speech distortion due to limited number of CI channels for stimulation, which is the opposite to normal hearing listeners who have full access to the entire frequency range. One reason could be the long-term CI listening experience allows the CI recipients to adapt to the distorted speech via neural plasticity within the auditory context and higher level brain processing. However, noise interference is not tolerated well by CI listeners since it presents competing neural stimulation. The loss of redundancy feature of the CI encoding procedures has resulted in a lack of noise robustness, because limited amounts of speech information are delivered to the auditory nerve of the CI listeners.
In this study, we propose a pre-processing based speech enhancement algorithm to improve the speech representation before the CI encoding. The proposed method attempts to assist CI recipients to perceive target speech by reducing the effect of the interfering noise. In our method, a harmonic structure estimation approach is combined with traditional minimum mean square error (MMSE) speech enhancement for a leveraged overall solution. The MMSE approach is a statistical based method which minimizes the mean square error between the estimation and target speech (Ephraim and Malah, 1984). In addition to tracking noise along the time dimension, we also explore the harmonic structure of target speech signals for estimating any interfering non-stationary noise. CI listeners have been shown to have more difficulties with non-stationary noise versus stationary noise. Using this harmonic structure estimation, we are able to remove more non-stationary noise content for CI listeners, making perception of the resulting target speech to be perceived as less disturbed. Specifically, the speech energy is primarily carried by the harmonic partials in the frequency domain in voiced segments. For noisy speech, the spectral content located within the harmonic partials are considered to be speech-dominated. On the other hand, the spectral content located between adjacent harmonic partials are considered to be noise-dominated. In general, the spectrum of both speech and noise is typically distributed in a continuous manner along the available frequency range. Therefore, we can estimate the noise within the harmonic partials based on the spectral content between the harmonic partials. The estimated noise along both the time and frequency dimensions are combined and employed in the MMSE framework for an improved speech enhancement solution. The harmonic structure estimation is based on noise robust pitch estimation developed in our previous studies (Wang et al., 2014; Wang et al., 2017). Thus, a cleaner speech representation is obtained for CI encoding which ensures that higher SNR encoded speech is delivered to the auditory nerve of CI listeners.
In addition, similar speech enhancement methods have also been proposed in previous research (Krawczyk-Becker and Gerkmann, 2015, 2016). Nevertheless, their noise estimation methods differ from our method. Our motivation is to achieve more accurate noise reduction, while their study was focused more on preserving the speech harmonics to prevent excessive speech distortion.
II. PROPOSED HARMONIC+MMSE SPEECH ENHANCEMENT ALGORITHM
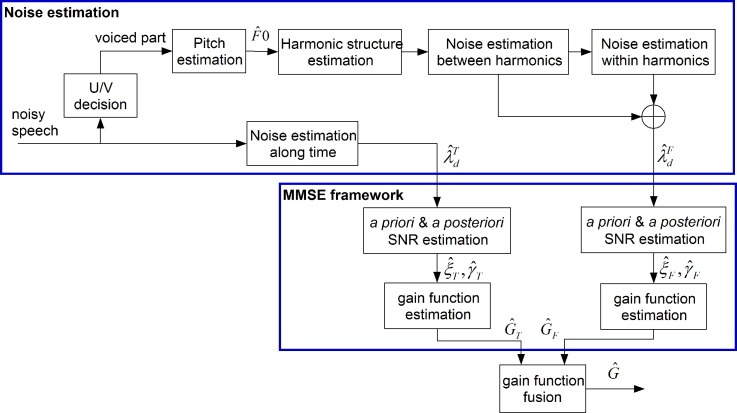
In this part, we describe the proposed Harmonic+MMSE speech enhancement algorithm for improving speech intelligibility for CI recipients. The algorithm overview is shown in Fig. 1. From Fig. 1, we see that the proposed algorithm is comprised of two main stages: (i) noise estimation and (ii) speech enhancement based on MMSE. The noise estimation has two separate parts, including noise tracking along both time and frequency dimensions. On the one hand, time domain noise tracking is based on a time-recursive average algorithm (Martin, 2001). Alternatively, noise estimation along the frequency dimension is based on exploring the harmonic structure of the target speech. In the MMSE framework, given the estimated noise variance ( or ), the a priori SNR ( or ), and a posteriori SNR ( or ) are estimated. These parameters are used to derive the gain function ( and ) for the time and frequency dimensions, respectively. Finally, we fuse the gain function of both time and frequency dimensions into a single form () for the target speech estimation based on an MMSE principle (Krawczyk-Becker and Gerkmann, 2015).
FIG. 1.
(Color online) Block diagram of the speech enhancement algorithm.
In the following, we will explain the details of traditional MMSE framework, harmonic structure estimation, noise estimation and gain function estimation for the target speech signal.
A. MMSE framework
The MMSE based speech enhancement approach aims to find the average of the a posteriori probability density function (pdf) of the clean speech spectrum amplitude given the pdf of the speech and noise (Ephraim and Malah, 1984). Usually, the assumption is made that both speech and noise are Gaussian distributed and are statistically independent from each other. Here Bayes rule is used to determine the MMSE estimator for the clean speech spectrum amplitude. Specifically, the gain function is derived as below (Loizou, 2007),
| (1) |
where Yk and are the observed noisy and estimated speech spectrum amplitude, respectively. Here, the index k denotes the kth spectrum component, and are the zero- and first-order of modified Bessel function, is the a posteriori SNR, and νk is defined by the a priori SNR and a posteriori SNR , shown as
| (2) |
where and are defined as
| (3) |
| (4) |
where and are the estimated variances of speech and noise, respectively.
In particular, the a priori and a posteriori SNR can be viewed as the true and measured SNR, respectively. The a priori SNR is the main parameter influencing noise suppression, while the a posteriori SNR serves as a correction parameter that influences attenuation only when is low (Loizou, 2007). Therefore, the success of the MMSE approach for noise reduction mainly relies on the accurate estimation of the a priori SNR. Furthermore, the a priori SNR estimation depends on the estimated speech and noise variance. Traditionally, the noise variance is estimated during the speech pause section assuming that the noise is stationary. With the estimated noise spectrum, the a priori SNR is estimated based on algorithms such as maximum-likelihood method, decision-directed approach or its modified method (Ephraim and Malah, 1984; Cohen, 2005; Hasan et al., 2004). However, the strong assumption of stationary noise causes the unreliable noise estimation in real sound scenarios. Thus, developing more accurate noise estimation methods is essential for improving the performance of MMSE based speech enhancement. In the next subsection, we will describe the harmonic structure estimation which is used for noise estimation.
B. Harmonic structure estimation
In this subsection, we focus on harmonic structure estimation for the target speech signal. Based on a sinusoidal model, the voiced speech signal waveform is composed of a series of sinusoidal signals with frequencies which are multiple integers of the fundamental frequency (McAulay and Quatieri, 1986). In the frequency domain, the speech spectrum is composed of harmonic partials located at frequencies which are multiple integers of the fundamental frequencies (Stylianou, 2001). For noisy speech, the spectrum within the harmonic partials tend to be speech dominated. However, the spectrum between the harmonics tend to be noise dominated. If we are able to estimate the frequencies of the harmonic structure for the target speech, then we can categorize the noisy spectrum into speech and noise dominated bands along the frequency dimension, and estimate them with alternative strategies.
We propose to estimate the harmonic structures by selecting the noisy spectral peaks near the ideal harmonic partials with frequencies that are integer multiples of F0 (kF0). In order to obtain accurate pitch estimation, we adopt a classification based approach which is an extension of our previous work (Wang et al., 2017). We attempt to estimate pitch contour values by classifying the pitch candidates into true and false based on input harmonic features. The flowchart of the pitch estimation algorithm is illustrated in Fig. 2. From Fig. 2, we see that pitch estimation is comprised of two steps: (i) pitch candidates generation and (ii) target pitch selection. First, the long-short-term Fourier transform is performed on the input noisy speech waveform to obtain the long-term and short-term frequency spectrum (Huang and Wang, 2011). After this, in each frame, a series of frequency based pitch candidates are extracted from both the original noisy speech spectrum and the subharmonic summation (SBH) spectrum (Hermes, 1988). After pitch candidate generation, five harmonic related features are extracted for each pitch candidate to complementary represent the characteristics of the pitch associated harmonic structure. The noise robust harmonic features are developed to project the pitch candidates into a more separable space so as to facilitate effective pitch candidate classification. The pitch selection process is formed as a neural network classification problem where pitch candidates are categorized into true or false types. Finally, a temporal continuity constraint is applied for pitch tracking based on a hidden Markov model (HMM) along with Viterbi decoding to ensure a speech-like F0 contour.
FIG. 2.
(Color online) F0 estimation overview.
The details of the harmonic feature (er, sr, hd, o2e, rh) extraction are described as follows.
Harmonic energy ratio (er): The harmonic energy ratio is the energy ratio between the detected harmonic energy and the overall noisy spectrum energy. A larger er usually indicates a higher SNR of the identified harmonic structure associated with the particular pitch candidate.
SBH amplitude ratio (sr): The SBH amplitude ratio is the ratio between the SBH amplitude of the pitch candidate peak and the maximum peak of the SBH vector. For clean speech, the maximum peak of SBH is expected to appear exactly at the pitch frequency. For noisy speech, the peak at the pitch frequency might not be maximum due to interference. However, its amplitude is usually close to the maximum value. Therefore, a higher sr value usually indicates a higher likelihood that the corresponding pitch candidate is a true pitch.
Harmonic frequency deviation (hd): Harmonic frequency deviation stands for the average frequency deviation of the detected harmonic partials from the ideal harmonic frequencies for a particular pitch candidate. The smaller the value of hd, the more probable that the pitch candidate is a true pitch.
Odd to even harmonic energy ratio (o2e): Odd to even harmonic energy ratio stands for the energy ratio between odd order of harmonics and even order of harmonics. Since the speech spectrum envelope is smoothly distributed along the frequency range, the overall energy of the odd order of harmonics and even order of harmonics should be equivalent to each other. Therefore, the use of o2e is able to control or limit any half-pitch errors as well as suppress the effect of noise interference.
Ratio of detected harmonic structures (rh): The ratio of the detected harmonic structure denotes the ratio between the number of detected harmonic partials and the ideal overall number of harmonic partials distributed in the analysis frequency range. More harmonic partials detected for one pitch candidate indicates that less noise interference is present in the speech harmonics associated with that pitch candidate.
The five harmonic features are combined together to form a collective input vector [er sr hd o2e rh] for neural network based classification. In the training phase, the neural network is created to model the relationship between input harmonic features and output pitch salience. The output value is set to either 0 or 1, denoting either a false pitch or a true pitch value, respectively. The connecting weights between each layer in the neural network architecture is obtained based on back-propagation (Mitchell, 1997). In the testing phase, given the input of harmonic feature vector for a pitch candidate, the greater the output value of the neural network, the more probable this pitch candidate is the true pitch. Moreover, a temporal continuity constraint is used for pitch tracking to ensure natural pitch contours. The pitch tracking problem is modeled with a HMM, and the Viterbi algorithm is used for HMM decoding.
With the estimated pitch values, the harmonic structures are obtained by selecting the spectral peaks which are closest to the ideal harmonic partials within a frequency range related to the harmonic order. In reality, the observed harmonic partials usually deviate from the ideal frequency due to the instability of the glottal pulse sequence/shape during speech production. The harmonic deviation is typically greater as one moves towards higher frequency compared to the low frequency range. Therefore, we set the deviation threshold ΔfH to depend on the specific frequency band. The criteria therefore is to set ΔfH to a smaller value in the low frequency range, and a larger value as we move to higher frequency. The details are shown as follows:
| (5) |
Here, the different values of ΔfH were determined empirically. At this point, the harmonic structure estimation has been completed.
C. Noise estimation based on harmonic structure
In this subsection, we focus on estimating noise along frequency dimension based on exploring harmonic structure of the target speech. In any voiced section, speech energy is primarily carried by the harmonics, only small amounts of speech energy located between harmonic partials. Accordingly, the noisy spectrum within harmonic partials is dominated by speech which has higher SNR. Alternatively, the noisy spectral content between harmonic partials is dominated by noise which has a lower SNR. Therefore, on the one hand, the spectrum within harmonic partials will be more reliable for estimating speech. Alternatively, the spectrum between harmonic partials will be more appropriate for noise estimation.
The composite algorithm overview of the noise estimation is presented in Fig. 3. It can be seen that the harmonic spectrum is first generated for target speech by convolving the harmonic partial vectors with the spectrum of a short-term hamming window, shown as follows:
| (6) |
where and are the amplitude and frequency of the kth order of harmonic peak, is the spectrum vector of the short-term hamming window, and is the delta function. Next, the generated harmonic spectral amplitude is reduced from the noisy speech spectrum in order to obtain the initial estimated noise spectrum , as shown,
| (7) |
We call the noise spectrum inside of the main lobe window the “within-harmonic (WH)” noise, and that one outside of the main lobe window as “between-harmonic (BH)” noise. The bandwidth of the main lobe of the harmonics is set as 2/3 of the main lobe bandwidth of the short-term Hamming window spectrum to distinguish between BH and WH noise. The ratio 2/3 is chosen since the central part of the harmonic main lobe has higher speech energy than the tail portion. For example, in the case of a 30 ms frame, the main lobe bandwidth of harmonics is set to 70 Hz. Furthermore, the WH noise and BH noise will be estimated separately.
FIG. 3.
Algorithm overview of noise estimation.
In the case of BH noise estimation, the noise energy is the dominant component which has little influence from speech. Thus, the initial estimated noise in the same frequency range will be used for BH noise as shown,
| (8) |
where , and fmb is the bandwidth of the harmonic main lobe.
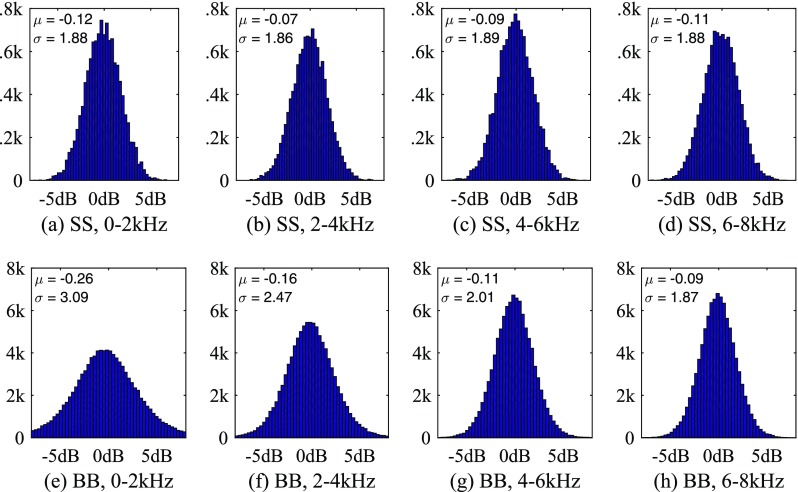
However, for WH noise estimation, the initial estimated noise is not reliable since speech has the dominant energy in this frequency range, serving as a strong interference for noise estimation. Nevertheless, we made an assumption that the noise spectrum is distributed continuously along the frequency dimension. In this way, given that the noise spectrum in the near frequency bands, the noise spectrum in the current frequency band can be approximated based on an interpolation technique. Figure 4 presents the statistical histogram of the logarithmic energy ratio between neighboring frequency bands in four different frequency ranges (0–2000 Hz, 2000–4000 Hz, 4000–6000 Hz and 6000–8000 Hz), for both speech-shaped noise and babble noise. The bandwidth and band shift are both set to 100 Hz. Meanwhile, the mean and standard variance values are shown as well. From Fig. 4, we see that the mean value of the logarithmic energy ratio between neighboring bands are near 0 dB across all four cases. The maximum spread value of the neighboring band energy ratio for both types of noise is less than 5 dB. This analysis indicates that the noise energy has a high correlation between adjacent frequency bands.
FIG. 4.
(Color online) Histogram of energy ratio between neighboring frequency bands of noise. SS: speechshaped noise, BB: babble noise.
With this formulation, we can estimate the WH noise using the estimated BH noise spectrum with linear interpolation method as shown below,
| (9) |
where and are the edge frequencies for the left and right neighboring BH noise band adjacent to the current harmonic partial, and are the average amplitude of the estimated BH noise spectrum in the adjacent left and right frequency bands.
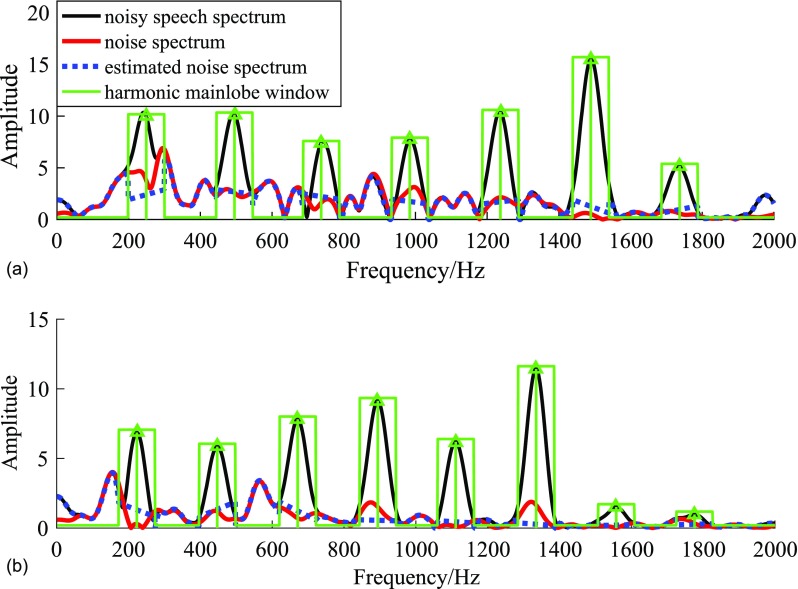
Figure 5 illustrates an example of the noise estimation solution based on harmonic structure. Figure 5(a) is for the speech-shaped noise case, and Fig. 5(b) is for the babble noise case. It can be seen that both the BH and WH noise spectrum amplitude estimation is almost consistent with the true noise values over frequency.
FIG. 5.
(Color online) Interpretation of noise estimation based on harmonic structure. (a) Speech-shaped noise (b) babble noise.
D. Noise tracking along time dimension
Besides the noise estimation along frequency dimension based on harmonic structure, we also perform the noise estimation along time dimension, which is attempting to address the stationary noise. The time dimension based noise tracking is based on a minimum statistics algorithm with optimal smoothing (Martin, 2001) assuming that the noise is stationary. In practice, the noise variance is estimated in the beginning during a quiet section and updated during later unvoiced and speech-absent segments.
E. Gain function estimation
With the estimated noise spectrum along both time and frequency dimensions, we derive the gain function for the target speech. The noise spectrum estimated along frequency and time dimensions will be incorporated into the MMSE framework to generate two gain functions and based on Eq.(1), respectively. Based on the MMSE principle (Krawczyk-Becker and Gerkmann, 2015), and are fused to obtain the optimal gain function for the target speech, shown as Eq. (10),
| (10) |
where and are the frequency- and time-dimension based noise variances, which can be computed from the estimated noise spectrum amplitude obtained in Secs. II C and II D. The estimated gain function for the target speech is then applied to the noisy speech spectrum to estimate the clean speech spectrum. Finally, an IFFT is used to transform the frequency domain signal back into time waveforms for each analysis frame. Each continuous frame will be connected via an overlap-and-add technique. This concludes the algorithm formulations for harmonic estimation based MMSE enhancement.
III. LISTENING EXPERIMENTS
A. Subjects and stimuli
Six post-lingually deafened cochlear implant users participated in this study. The age of the subjects at the time of testing ranged from 58 to 82 years, with a mean age of 67.7 years. Implant use ranged from 5 to 10 years, with a mean of 7.5 years. Table I shows the biographical data for all subjects. Subjects were paid an hourly wage for their participation.
TABLE I.
Biographical data from the subjects tested.
| Subject | Age (yr) | Gender | Age at HL onset (yr) | Cochlear implant use (yr) | Etiology of deafness | Number of channels |
|---|---|---|---|---|---|---|
| s1 | 68 | M | 55 | 6 | Hereditary | 22 |
| s2 | 62 | F | 48 | 5 | Hereditary | 22 |
| s3 | 58 | F | 38 | 5 | Hereditary | 22 |
| s4 | 71 | M | 27 | 9 | Nerve Damage | 22 |
| s5 | 82 | M | 57 | 10 | Hereditary | 22 |
| s6 | 65 | F | 30 | 10 | Nerve Damage | 22 |
The target speech materials are comprised of sentences from the IEEE database (IEEE, 1969). The IEEE corpus contains 72 lists. Each list has ten phonetically balanced sentences. All the sentences were produced by a female speaker. Babble noise is used to corrupt the sentences to simulate the noisy speech. The babble noise was recorded in the sound booth in the CRSS-CILab at University of Texas at Dallas. Three separate dialog groups are formed by 9 talkers talking in English (Krishnamurthy and Hansen, 2009). A noise segment with the same length as the target speech signal was randomly selected from the noise signal stream and added to the clean speech signal at the SNRs of 0, 5, and 10 dB, respectively.
B. Procedure
The listening task includes sentence recognition by CI subjects. The subjects were seated in a soundproof room (Acoustic System, Inc.), where the speech samples were played to the CI subjects. The subjects were asked to orally repeat all words which were heard in each sentence. We compare our method with a perceptually motivated MMSE method (Loizou, 2005), which we call MMSE in the experiment results. All speech samples were processed off-line in matlab with the perceptually motivated MMSE algorithm and our proposed Harmonic+MMSE method. For comparison, the simulated noisy sentences are also included in the listening test. All sentences were presented to subjects through a loudspeaker placed at a distance of 80 cm in front of the subject. The sound pressure level of the speech sentences from the loudspeaker were set as fixed 65 dB through out the test. The subjects were fitted with their daily CI MAP strategy. Before the test, each subject participated in a 20 min practice session to listen to a set of clean stimuli to familiarize him/her with the testing procedure. Each subject participated in a total of nine test conditions (3 SNR levels × 3 processing conditions). Two IEEE sentence lists were used per test condition. None of the sentences were repeated across the test conditions. The order of test conditions was randomized across all subjects. Subjects were given a 5-min break every 30 min during the test sessions to avoid listener fatigue.
C. Results
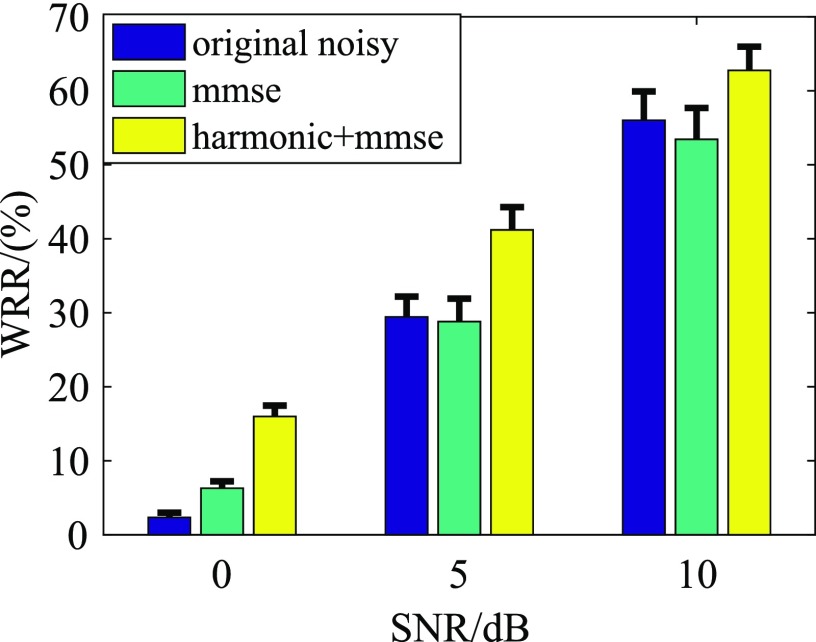
The speech intelligibility performance of each CI subject is measured in terms of word recognition rate (WRR) from the testing sentences. Figure 6 shows the average WRR results in the babble noise case. The standard error of the mean (SEM) for WRR results is also shown along with the average value. From Fig. 6, we see that the Harmonic+MMSE approach improves speech intelligibility for CI recipients in all the SNR levels. The MMSE stand-alone method improves performance at 0 dB, but decreases speech intelligibility performance at 5 dB and 10 dB SNR levels. The above results indicate the advantage of the combination of Harmonic processing with MMSE to address non-stationary noise. In order to investigate the significance at different SNR for babble noise, we performed an analysis of variance (ANOVA) analysis on these WRR results. The ANOVA results for 0 dB and 5 dB SNR are [F(2, 17) = 21.26, p < 0.0003] and [F(2, 17) = 16.21, p < 0.0007], respectively, which show a significant difference across processing conditions. However, the ANOVA result for 10 dB is [F(2, 17) = 2.67, p < 0.1181], where no significant difference exists at this SNR level.
FIG. 6.
(Color online) Average word recognition rate for babble noise.
Post hoc pairwise analyses were performed to assess the statistical significance between different processed conditions at 0 dB and 5 dB SNR levels. When the SNR is 0 dB, Post hoc results show significant differences between MMSE+Harmonic and the original noisy speech condition (p < 0.0002), as well as between MMSE+Harmonic processed condition and the only MMSE processed condition (p < 0.003). However, there is no significant difference between MMSE processed condition and the original unprocessed condition (p < 0.2078). When the SNR is 5 dB, a similar statistical difference is found between each speech pair as with an SNR of 0 dB. In particular, the p-value of the three pairs are (i) p < 0.0019 is observed between Harmonic+MMSE processed and original noisy condition; (ii) p < 0.0013 is observed between Harmonic+MMSE processed and only MMSE processed conditions; and (iii) p < 0.9646 is observed between only MMSE processed condition and original noisy condition.
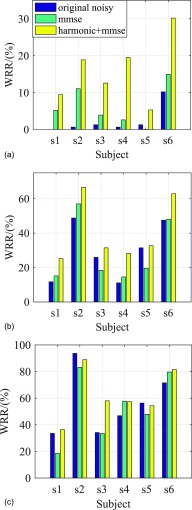
In addition, we present WRR results for individual CI subject which is shown in Fig. 7. Figures 7(a) and 7(b) show that all CI subjects benefit from Harmonic+MMSE in terms of WRR performance. MMSE stand-alone processing improves WRR results for most of the subjects at 0 dB, but inconsistently at 5 dB, whereas no improvement is observed compared to unprocessed condition for some subjects (s3, s5, and s6). From Fig. 7(c), it can be seen that Harmonic+MMSE is able to improve or preserve the WRR performance for most CI subjects, while MMSE stand-alone processing decreases WRR performance for most CI subjects.
FIG. 7.
(Color online) Word recognition rate for individual subject in babble noise case. (a) SNR = 0 dB (b) SNR = 5 dB (c) SNR = 10 dB.
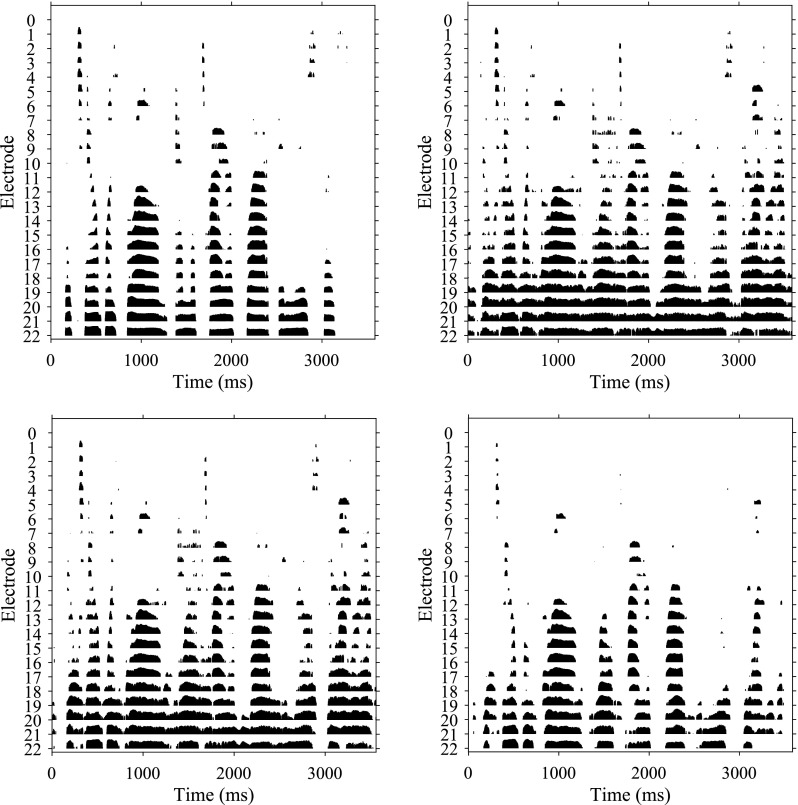
In order to compare the output of the cochlear implant processed signal, we present electrodograms of the clean, noisy and processed conditions, respectively in Fig. 8. From Fig. 8(d), We see the that noise is attenuated and harmonics are well preserved in MMSE+Harmonic processed electrodogram. However, from Fig. 8(c), for the stand-alone MMSE processed condition, too much residual noise is either retained or introduced.
FIG. 8.
Electrogram in babble noise case, SRN = 0 dB. (a) Clean, (b) noisy, (c) MMSE processed, (d) MMSE+Harmonic processed.
IV. GENERAL DISCUSSION AND CONCLUSION
In this study, a speech enhancement method based on combining harmonic structure estimation and MMSE was proposed to improve speech intelligibility for CI recipients. Our algorithm more efficiently estimates noise using harmonic structure during speech which improved MMSE enhancement. A listening evaluation with CI subjects demonstrated the potential benefit of the proposed method for CI subjects in terms of WRR (word recognition rate) performance for a babble noise condition. At an SNR of 0 dB, mean subject WRR scores improved from 2% to 6% and 16% with stand-alone MMSE processing and combined Harmonic+MMSE processing, respectively. At an SNR of 5 dB, the combined Harmonic+MMSE improved WRR performance from 29% to 41%, while MMSE processing alone decreased WRR by 1%. At an SNR of 10 dB, Harmonic+MMSE slightly improved WRR scores to the range 56% to 63%, while stand-alone MMSE processing actually decreased WRR scores by 3%.
Based on these results, for the non-stationary noise condition, MMSE processing alone was not capable of reflecting the time-varied characteristics of noise, hence leading to no significant contribution, or even decreasing speech intelligibility in high SNR scenarios. However, improved noise estimation obtained by Harmonic+MMSE processing was shown to provide a better a priori and a posteriori SNR estimation for the MMSE framework to estimate the target speech. In addition, the harmonic model used in the proposed method was able to distinguish speech harmonics from fluctuating background noise so as to enhance the time-frequency representation of speech. Similar findings have shown that F0 contour is a substantial cue for speech perception in noise for CI recipients (Qin and Oxenham, 2003; Chen et al., 2015).
The performance of individual CI subjects showed that almost all CI subjects benefit more from Harmonic+MMSE than stand-alone MMSE processing. The poor speech intelligibility performance of CI subjects in fluctuating babble noise without processing reflects both the need and challenge in providing sustained listener benefits in diverse conditions. In addition, those subjects with poor performance in their daily strategies where shown to benefit more from Harmonic+MMSE which had a more aggressive noise reduction solution. On the contrary, these CI subjects who achieved better performance generally had a listener profile closer to normal hearing listeners who are more sensitive to speech distortion versus residual noise.
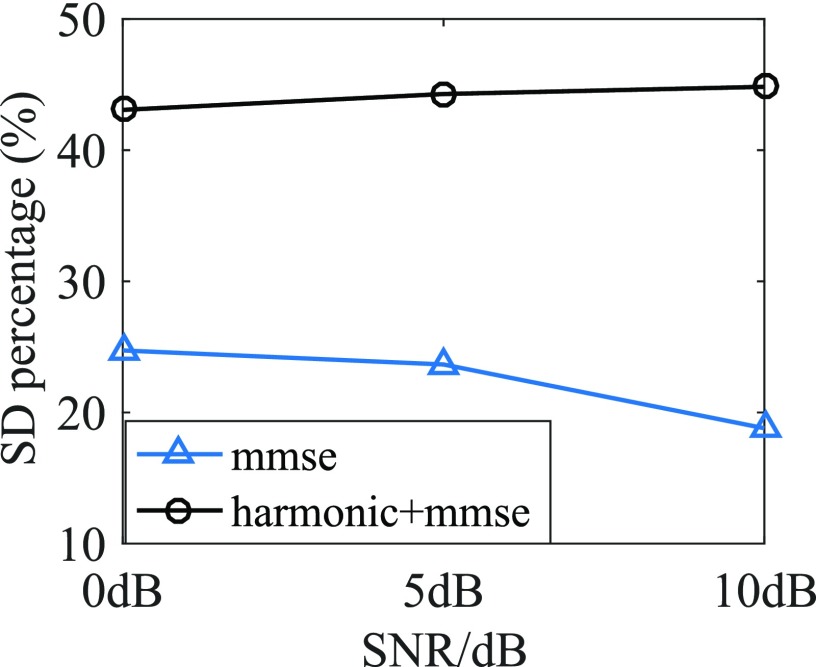
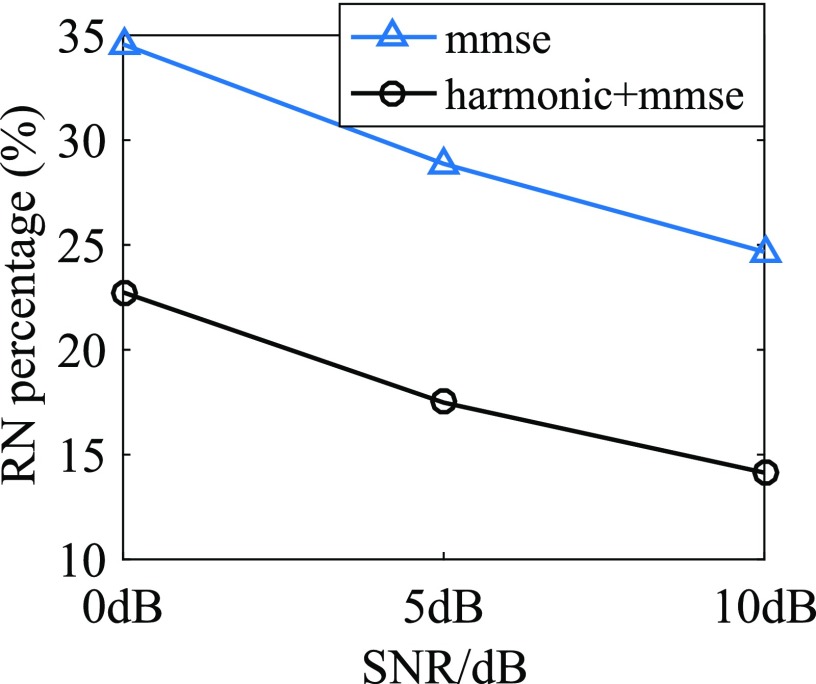
Furthermore, in order to investigate the effects of speech distortion and residual noise on speech intelligibility of CI recipients, we computed the percentage rate of speech distortion and residual noise for both the MMSE processed and Harmonic+MMSE processed speech (Loizou and Kim, 2011). The percentage rate of speech distortion was obtained as the ratio between the number of T-F bins which were underestimated (–6.02 dB compared to the clean speech) versus the total number of time-frequency (T-F) bins. The percentage rate of residual noise was computed as the ratio between the number of T-F bins which were overestimated (+6.02 dB compared to the clean speech) versus the total number of T-F bins. Figures 9 and 10 showed the percentage of speech distortion and residual noise, respectively. From Fig. 9, we saw that the Harmonic+MMSE processed speech had a higher speech distortion rate than the stand-alone MMSE processed speech. In addition, from Fig. 10, we saw that MMSE alone had more residual noise than the Harmonic+MMSE processed speech. From these results, we can now infer CI recipients are more sensitive to residual noise than speech distortion when exposed to non-stationary noise.
FIG. 9.
(Color online) Speech distortion ratio for processed speech in babble noise condition.
FIG. 10.
(Color online) Residual noise ratio for processed speech in babble noise condition.
For future research, the trade-off between noise reduction and speech distortion could be further investigated for alternate noise conditions. With such a follow-on study, a proper weight value could be set for both the Harmonic gain and MMSE gain functions to achieve a more consistent and greater level of speech intelligibility improvement for CI recipients (Hu and Loizou, 2010a). Moreover, it is also possible to set alternate analysis window sizes for the input distorted speech signal according to the estimated pitch values to ensure higher frequency resolution for harmonic structure estimation.
ACKNOWLEDGMENTS
This research is supported by NIH/NIDCD Grant No. R01 DC010494.
References
- 1. Buchner, A. , Nogueira, W. , Edler, B. , Battmer, R. D. , and Lenarz, T. (2008). “ Results from a psychoacoustic model-based strategy for the nucleus-24 and freedom cochlear implants,” Otol. Neurotol. 29(2), 189–192. 10.1097/mao.0b013e318162512c [DOI] [PubMed] [Google Scholar]
- 2. Buechner, A. , Beynon, A. , Szyfter, W. , Niemczyk, K. , Hoppe, U. , Hey, M. , Brokx, J. , Eyles, J. , Van de Heyning, P. , Paludetti, G. , Zarowski, A. , Quaranta, N. , Wesarg, T. , Festen, J. , Olze, H. , Dhooge, I. , Müller-Deile, J. , Ramos, A. , Roman, S. , Piron, J. , Cuda, D. , Burdo, S. , Grolman, W. , Roux Vaillard, S. , Huarte, A. , Frachet, B. , Morera, C. , Garcia-Ibáñez, L. , Abels, D. , Walger, M. , Müller-Mazotta, J. , Leone, C. A. , Meyer, B. , Dillier, N. , Steffens, T. , Gentine, A. , Mazzoli, M. , Rypkema, G. , Killian, M. , and Smoorenburg, G. (2011). “ Clinical evaluation of cochlear implant sound coding taking into account conjectural masking functions, MP3000,” Cochl. Impl. Int. 12(4), 194–204. 10.1179/1754762811Y0000000009 [DOI] [PMC free article] [PubMed] [Google Scholar]
- 3. Chen, F. , Hu, Y. , and Yuan, M. (2015). “ Evaluation of noise reduction methods for sentence recognition by mandarin-speaking cochlear implant listeners,” Ear Hear. 36(1), 61–71. 10.1097/AUD.0000000000000074 [DOI] [PubMed] [Google Scholar]
- 4. Cohen, I. (2005). “ Relaxed statistical model for speech enhancement and a priori snr estimation,” IEEE Trans. Audio Speech Lang. Process. 13(5), 870–881. 10.1109/TSA.2005.851940 [DOI] [Google Scholar]
- 5. Dawson, P. W. , Mauger, S. J. , and Hersbach, A. A. (2011). “ Clinical evaluation of signal-to-noise ratio based noise reduction in nucleus cochlear implant recipients,” Ear Hear. 32(3), 382–390. 10.1097/AUD.0b013e318201c200 [DOI] [PubMed] [Google Scholar]
- 6. Ephraim, Y. , and Malah, D. (1984). “ Speech enhancement using a minimum mean-square error short-time spectral amplitude estimator,” IEEE Trans. Acoust. Speech Sign. Process. 32(6), 1109–1121. 10.1109/TASSP.1984.1164453 [DOI] [Google Scholar]
- 7. Hasan, M. , Salahuddin, S. , and Khan, M. (2004). “ A modified a priori SNR for speech enhancement using spectral subtraction rules,” IEEE Sign. Process. Lett. 11(4), 450–453. 10.1109/LSP.2004.824017 [DOI] [Google Scholar]
- 8. Hermes, D. J. (1988). “ Measurement of pitch by subharmonic summation,” J. Acoust. Soc. Am. 83(1), 257–264. 10.1121/1.396427 [DOI] [PubMed] [Google Scholar]
- 9. Hersbach, A. A. , Arora, K. , Mauger, S. J. , and Dawson, P. W. (2012). “ Combining directional microphone and single-channel noise reduction algorithms: A clinical evaluation in difficult listening conditions with cochlear implant users,” Ear Hear. 33(4), e13–e19. 10.1097/AUD.0b013e31824b9e21 [DOI] [PubMed] [Google Scholar]
- 10. Hochberg, I. , Boothroyd, A. , and Weiss, M. (1992). “ Effects of noise and noise suppression on speech perception by cochlear implant users,” Ear Hear. 13(4), 263–271. 10.1097/00003446-199208000-00008 [DOI] [PubMed] [Google Scholar]
- 11. Hu, H. , Li, G. , Chen, L. , Sang, J. , Wang, S. , Lutman, M. E. , and Bleeck, S. (2011). “ Enhanced sparse speech processing strategy for cochlear implants,” in Proceedings of EUSIPCO, Barcelona, Spain, pp. 491–495. [Google Scholar]
- 12. Hu, H. , Lutman, M. E. , Ewert, S. D. , Li, G. , and Bleeck, S. (2015). “ Sparse nonnegative matrix factorization strategy for cochlear implants,” Trends Hear. 19, 1–16. 10.1177/2331216515616941 [DOI] [PMC free article] [PubMed] [Google Scholar]
- 13. Hu, Y. , and Loizou, P. C. (2008). “ A new sound coding strategy for suppressing noise in cochlear implants,” J. Acoust. Soc. Am. 124(1), 498–509. 10.1121/1.2924131 [DOI] [PMC free article] [PubMed] [Google Scholar]
- 14. Hu, Y. , and Loizou, P. C. (2010a). “ Environment-specific noise suppression for improved speech intelligibility by cochlear implant users,” J. Acoust. Soc. Am. 127(6), 3689–3695. 10.1121/1.3365256 [DOI] [PMC free article] [PubMed] [Google Scholar]
- 15. Hu, Y. , and Loizou, P. C. (2010b). “ On the importance of preserving the harmonics and neighboring partials prior to vocoder processing: Implications for cochlear implants,” J. Acoust. Soc. Am. 127(1), 427–434. 10.1121/1.3266682 [DOI] [PMC free article] [PubMed] [Google Scholar]
- 16. Hu, Y. , Loizou, P. C. , Li, N. , and Kasturi, K. (2007). “ Use of a sigmoid-shaped function for noise attenuation in cochlear implants,” J. Acoust. Soc. Am. 122(4), EL128–EL134. 10.1121/1.2772401 [DOI] [PubMed] [Google Scholar]
- 17. Huang, Q. , and Wang, D. (2011). “ Single channel speech separation based on long-short frame asociated harmonic model,” Digital Sign. Process. 21(4), 497–507. 10.1016/j.dsp.2011.02.003 [DOI] [Google Scholar]
- 18.IEEE (1969). “ IEEE recommended practice for speech quality measurements,” IEEE Trans. Audio Electroacoust. 17(3), 225–246. 10.1109/TAU.1969.1162058 [DOI] [Google Scholar]
- 19. Kokkinakis, K. , Azimi, B. , Hu, Y. , and Friedland, D. R. (2012). “ Single and multiple microphone noise reduction strategies in cochlear implants,” Trends Amplif. 16(2), 102–116. 10.1177/1084713812456906 [DOI] [PMC free article] [PubMed] [Google Scholar]
- 20. Koning, R. (2014). “ Speech enhancement in cochlear implants,” Ph.D. thesis, Department of Neurosciences, KU Leuven, Belgium. [Google Scholar]
- 21. Krawczyk-Becker, M. , and Gerkmann, T. (2015). “ MMSE-optimal combination of wiener filtering and harmonic model based speech enhancement in general framework,” in Proceedings of WASPAA, New Paltz, NY, pp. 1–5. [Google Scholar]
- 22. Krawczyk-Becker, M. , and Gerkmann, T. (2016). “ Fundamental frequency informed speech enhancement in a flexible statistical framework,” IEEE Trans. Audio Speech Lang. Process. 24(5), 940–951. 10.1109/TASLP.2016.2533867 [DOI] [Google Scholar]
- 23. Krishnamurthy, N. , and Hansen, J. H. L. (2009). “ Babble noise: Modeling, analysis, and applications,” IEEE Trans. Audio Speech Lang. Process. 17(7), 1394–1407. 10.1109/TASL.2009.2015084 [DOI] [Google Scholar]
- 24. Li, J. , Fu, Q. J. , Jiang, H. , and Akagi, M. (2009). “ Psychoacoustically-motivated adaptive beta-order generalized spectral subtraction for cochlear implant patients,” in Proceedings of ICASSP, Taipei, Taiwan, pp. 4665–4668. [Google Scholar]
- 25. Loizou, P. C. (2005). “ Speech enhancement using a minimum-mean-square error short-time spectral amplitude estimator,” IEEE Trans. Acoust. Speech Sign. Process. 13(5), 857–869. 10.1109/TSA.2005.851929 [DOI] [Google Scholar]
- 26. Loizou, P. C. (2006). “ Speech processing in vocoder-centric cochlear implants,” in Cochlear and Brainstem Implants, Otorhinolaryngol, edited by Moller A. R. ( Karger, Basel: ), Vol. 64, pp. 109–143. [DOI] [PubMed] [Google Scholar]
- 27. Loizou, P. C. (2007). Speech Enhancement: Theory and Practice, 1st ed. ( CRC Press, Boca Raton, FL: ), Chap. 7. [Google Scholar]
- 28. Loizou, P. C. , and Kim, G. (2011). “ Reasons why current speech-enhancement algorithms do not improve speech intelligibility and suggested solutions,” IEEE Trans. Audio Speech Lang. Process. 19(1), 47–56. 10.1109/TASL.2010.2045180 [DOI] [PMC free article] [PubMed] [Google Scholar]
- 29. Loizou, P. C. , Lobo, A. , and Hu, Y. (2005). “ Subspace algorithms for noise reduction in cochlear implants,” J. Acoust. Soc. Am. 118(5), 2791–2793. 10.1121/1.2065847 [DOI] [PMC free article] [PubMed] [Google Scholar]
- 30. Martin, R. (2001). “ Noise power spectral density estimation based on optimal smoothing and minimum statistics,” IEEE Trans. Audio Speech Lang. Process. 9(5), 504–512. 10.1109/89.928915 [DOI] [Google Scholar]
- 31. Mauger, S. J. , Arora, K. , and Dawson, P. W. (2012). “ Cochlear implant optimized noise reduction,” J. Neural Eng. 9(6), 1–9. 10.1088/1741-2560/9/6/065007 [DOI] [PubMed] [Google Scholar]
- 32. McAulay, R. , and Quatieri, T. (1986). “ Speech analysis/synthesis based on a sinusoidal representation,” IEEE Trans. Acoust. Speech Sign. Process. 34(4), 744–754. 10.1109/TASSP.1986.1164910 [DOI] [Google Scholar]
- 33. Mitchell, T. M. (1997). Machine Learning, 2nd ed. ( McGraw Hill, New York: ), Chap. 4. [Google Scholar]
- 34. Nie, K. , Drennan, W. , and Rubinstein, J. (2009). “ Cochlear implant coding strategies and device programming,” in Ballenger's Otorhinolaryngology Head and Neck Surgery, edited by Snow J. B. and Wackym P. A. ( PMPH—USA, Shelton: ), pp. 389–394. [Google Scholar]
- 35. Patrick, J. F. , Busby, P. A. , and Gibson, P. J. (2006). “ The development of the nucleus freedom cochlear implant system,” Trends Ampl. 10(4), 175–200. 10.1177/1084713806296386 [DOI] [PMC free article] [PubMed] [Google Scholar]
- 36. Qazi, Q. u. R. , Dijk, B. v. , Moonen, M. , and Wouters, J. (2012). “ Speech understanding performance of cochlear implant subjects using time-frequency masking-based noise reduction,” IEEE Trans. Biomed. Eng. 59(5), 1364–1373. 10.1109/TBME.2012.2187650 [DOI] [PubMed] [Google Scholar]
- 37. Qin, M. K. , and Oxenham, A. J. (2003). “ Effects of simulated cochlear-implant processing on speech reception in fluctuating maskers,” J. Acoust. Soc. Am. 114(1), 446–454. 10.1121/1.1579009 [DOI] [PubMed] [Google Scholar]
- 38. Spriet, A. , Van Deun, L. , Eftaxiadis, K. , Laneau, J. , Moonen, M. , van Dijk, B. , van Wieringen, A. , and Wouters, J. (2007). “ Speech understanding in background noise with the two-microphone adaptive beamformer beam in the nucleus freedom cochlear implant system,” Ear Hear. 28(1), 62–72. 10.1097/01.aud.0000252470.54246.54 [DOI] [PubMed] [Google Scholar]
- 39. Stylianou, Y. (2001). “ Applying the harmonic plus noise model in concatenative speech synthesis,” IEEE Trans. Speech Audio Process. 9(1), 21–29. 10.1109/89.890068 [DOI] [Google Scholar]
- 40. Toledo, F. , Loizou, P. C. , and Lobo, A. (2003). “ Subspace and envelope subtraction algorithms for noise reduction in cochlear implants,” in Proceedings of the 25th Annual International Conference of the IEEE Engineering in Medicine and Biology Society, Cancun, Mexico, pp. 2002–2005. [Google Scholar]
- 41. Wang, D. , Loizou, P. C. , and Hansen, J. H. L. (2014). “ F0 estimation in noisy speech based on long-term harmonic feature analysis combined with neural network classification,” in Proceedings of INTERSPEECH, Singapore, pp. 2258–2262. [Google Scholar]
- 42. Wang, D. , Yu, C. , and Hansen, J. H. L. (2017). “ Robust harmonic features for classification-based pitch estimation,” IEEE Trans. Audio Speech Lang. Process. 25(5), 952–964. 10.1109/TASLP.2017.2667879 [DOI] [PMC free article] [PubMed] [Google Scholar]
- 43. Weiss, M. R. (1993). “ Effects of noise and noise reduction processing on the operation of the nucleus-22 cochlear implant processor,” J. Rehabil. Res. Dev. 30(1), 117–128. [PubMed] [Google Scholar]
- 44. Wouters, J. , and Vanden Berghe, J. (2001). “ Speech recognition in noise for cochlear implantees with a two-microphone monaural adaptive noise reduction system,” Ear Hear. 22(5), 420–430. 10.1097/00003446-200110000-00006 [DOI] [PubMed] [Google Scholar]
- 45. Yang, L. P. , and Fu, Q. J. (2005). “ Spectral subtraction-based speech enhancement for cochlear implant patients in background noise,” J. Acoust. Soc. Am. 117(3), 1001–1004. 10.1121/1.1852873 [DOI] [PubMed] [Google Scholar]


