

Abstract
Liquid-cell electron microscopy is a rapidly growing field in the imaging domain. While real-time observations are readily available to analyze materials and biological systems, these measurementshave been limited to the two-dimensional (2-D) image plane. Here, we introduce an exciting technical advance to image materials in 3-D while enclosed in liquid. The development of liquid-cell electron tomography permitted us to observe and quantify host-pathogen interactions in solution while contained in the vacuum system of the electron microscope. In doing so, we demonstrate new insights for the rules of engagement involving a unique bacteriophage and its host bacterium. A deeper analysis of the genetic content of the phage pathogens revealed structural features of the infectious units while introducing a new paradigm for host interactions. Overall, we demonstrate a technological opportunity to elevate research efforts for in situ imaging while providing a new level of dimensionality beyond the current state of the field.
Keywords: Liquid-cell, electron tomography, silicon nitride, bacteriophage
Graphical Abstract

Liquid-cell electron microscopy (LC-EM) is a rapidly evolving imaging technique capable of providing unprecedented views of molecular processes. Breakthroughs in the development of ultrathin materials such as silicon nitride (SiN) and graphene led to the construction of microfluidic chambers that can operate within electron microscopes.1–3 Due to these advances, researchers can now visualize dynamic events at high spatial and temporal resolution.4,5 Insights from LC-EM studies also provide a strong complement to the remarkable results achievable with cryo-EM. The fundamental difference between the two techniques is the physical state of the sample. Liquid-cell specimens are contained within nanoliters of solution that remain fluid in the EM column during imaging.6 Cryo-EM specimens are typically frozen in vitreous ice prior to imaging. This freezing procedure traps molecules of interest in a static state of existence.7 Images acquired from static specimens must be interpreted with this caveat in mind as they represent a single moment in the lifetime of the sample. LC-EM data thereby provide quantifiably different information within a temporal framework.
Here, we describe opportunities to expand LC-EM technology beyond two-dimensional temporal assessments and into the three-dimensional (3-D) regime. Drawing upon established techniques in the cryo-EM field, we introduce the liquid-cell electron tomography (LC-ET) technique. Traditional electron tomography entails recording images of tilted specimens within the same region of interest using a low dose of electrons, cumulatively ~100 electrons//Å2.8–11 These data are then used to build an image stack that varies in tilt angle and Z-dimension. The combined image stack can then be interpolated and viewed as a 3-D density map using molecular visualization software.12 Notable outcomes of this technology include structural studies that reveal intricate components of biological assemblies such as multiprotein secretion systems and flagellar motors.13–19 Expanding upon these achievements, we have adapted a tomography workflow that can be used on a wide variety of electron microscopes to evaluate liquid specimens in 3-D. This work also complements recent efforts by other research teams to implement tomography methods for the environmental STEM community.20
To craft the LC-ET technique, we recorded an image series of a model system pertinent to host-pathogen interactions. We used the Agrobacterium sp. H13–3 bacterial host and its natural pathogen, flagellotropic phage (7–7-1). While some structural information exists for this biological system, a more detailed understanding of the infection pathway is relevant to broader societal applications ranging from agricultural sustainability to human health and disease.21,22 Initial interactions between the agrobacterium host and its phage pathogen are thought to occur along the bacterial flagella. These early contacts bring the attached phage proximal to the body of the bacterial surface through its natural motion in solution.23 Once upon the bacterial surface, phages inject their genomic material across biological membranes in a series of highly coordinated events.24–26 We are primarily interested in the host attachment and genome invasion processes, as blocking these essential steps may attenuate infection. These mechanisms are highly dynamic and have never been directly viewed at the molecular level. As such, we designed a new imaging platform to contain biological systems in liquid while performing tomographic data collection in a transmission electron microscope (TEM) for the first time. Visualizing biological interactions in liquid and in 3D establishes the foundation to study live infections with the potential to apply this knowledge to human disease processes.
A Microchip Sandwich for Tilted EM Specimens.
To develop a liquid cell environment that can be tilted in the TEM column, we produced a “microchip sandwich” device. The sandwich was achieved by placing a carbon-coated copper mesh EM grid on an adhesive gel pack and adding a biological sample in liquid to the grid surface (Figure 1A, B). The EM grids contain a layer of plastic film prior to carbon evaporation and were produced using previously established methods.27 The plastic film reinforces the carbon layer to minimize liquid evaporation in the microscope. A SiN microchip is then carefully placed over top of the grid assembly. The microchip sandwich is lifted out of the gel pack with forceps and loaded into the tip of a FEI-designed specimen holder at room temperature. The sandwich was mechanically locked into place using the grid clip that is a standard part of the holder (Figure S1). Using this configuration, we carried out and refined liquid tomography experiments on a bacteriophage sample (Figure 1C).
Figure 1.

Workflow for liquid cell tomography applications for EM analysis. (A) A single drop of 2% amyl acetate (Collodion) is placed on top of water contained in a glass beaker. The Collodion forms a thin plastic film as it spreads over the water surface. TEM grids (400 mesh copper grids, Ted Pella) were individually placed on top of the plastic film, followed by a piece of paper that encompasses the grid area. The paper with the attached grids is gently removed using forceps and allowed to dry in a Petri dish, grid-side up. Once dry, the grids are coated with atomized carbon using a commercial vacuum evaporator instrument and standard coating procedures.27 We used a Denton 502A instrument. (B) The carbon-coated EM grids are placed on a gel pack, and a liquid sample is added to the grid. The wet grid is covered by a SiN microchip. (C) The microchip assembly can be tilted to ±45° within the column of the EM for image acquisition and downstream computing procedures. Output from the tilt series provides an image stack that is used to calculate a tomographic reconstruction. Images of the bacteriophage model system revealed biological features in the specimen, including a distinct head, a tail, and tail fibers. Scale bar is 50 nm.
The bacteriophage was contained within a sample drop (2 μL) and proved to be a suitable initial specimen as its unstained form was easy to identify in EM images (Figure S2). The 2 μL droplet volume was determined experimentally, as we found that 1 μL droplets produced drier samples, while 3 μL droplets overflowed and wet the edges of the sandwich and created thicker liquid layers (Figure S3). This wetting effect caused the assembly to adhere to the forceps, creating difficulties with the transfer step. Evaporation is dependent upon liquid thickness and may occur within 60 min of imaging within local environments.28 If the sealed sample is removed from the specimen holder, the solution within the microchip environment may last for days. When the EM grid was removed from the chip, a notable drop was still present.
Electron Tomography of Bacteriophage in Solution.
After successfully loading the microchip sandwich within the specimen holder, we examined the sample using an FEI Spirit Bio-Twin TEM operating at 120 kV and equipped with an FEI Eagle CCD camera. Images of bacteriophages in solution were recorded at a variety of tilt angles up to ±45° using a magnification of ~49 000× and defocus of −1.5 μm. The main advantage of the microchip sandwich over commercially available systems comprised of two microchips is the ability to image the thin liquid specimen at higher tilt angles. Commercial microchip systems can only be tilted to ~15° in the TEM before the image becomes obstructed by the thick paired-chip assembly. Alternatively, graphene liquid cells may accomplish the same tilting feat in theory; however, no such examples exist for tomography applications.
Suitable regions of interest contained bacteriophages and were free of grid bars or the edges of the microchip. Images were manually recorded in such regions at various tilts in 3–5 degree increments. The images were then output and processed as an image stack using the IMOD and ETOMO software packages.29,30 These programs used the output images and corresponding tilt angle information to create a tomogram of the region of interest where phage particles were clearly defined and free from overlapping adjacent particles. Tomograms were viewed as sequential image stacks or density maps using the UCSF Chimera package.12 Figure 2A demonstrates results from the manual segmentation of a bacteriophage through the image stack, colorized for ease of viewing.
Figure 2.

Segmentation of a bacteriophage from images of liquid specimen. (A) Image series demonstrates the manual segmentation of a bacteriophage (magenta) distinguished from the liquid background (cyan). (B) Density map (magenta) of a reconstructed bacteriophage is displayed at different angles. Scale bar is 50 nm. (C) Images of a phage particle extracted from an image stack show differences in phage dimensions and features from ±35° in the tilt series.
The liquid surroundings (cyan) have inherently lower electron scattering properties compared to the electron dense body of the phage (magenta). To better visualize the individual phage body, we computationally filtered the solution using a statistical cutoff based on the scattering properties and density of the phage with respect to the background solution (Figure 2B, Movie S1). Representative particle images that were used to calculate the tomographic information are shown in Figure 2C. Additional microchip sandwiches, data collection sessions, and tomographic reconstructions were performed to ensure the reproducibility of the new technique. Bubbling solution that surrounds the phage indicates liquid is present in the sample.
To minimize evaporation effects during TEM data collection, samples were viewed within 60 min of assembly. Dry regions are visibly discernible from hydrated areas as rapid changes in pH and salt concentration can create damaging effects (Figure S4). The visible accumulation of artifacts surrounding the bacteriophage upon drying renders the specimen unusable for analysis. Dry specimen without damaging effects may still be useful in quantitative measurements although its biological state may be altered. In our analysis, the structure of the native phage determined in liquid is consistent with cryo-EM structures of tailed-bacteriophages studied by other research teams.31
A closer examination of the liquid phage population in the EM images revealed different architectures that we could classify based on the physical features and genomic content of each phage particle. Quantitative analysis of the particles showed that ~95% of intact phages comprised of both the capsid head and tail domains contained genomic DNA in the capsid (Figure 3A, green; Movie S2). Of the phage capsids that lacked the tail domain, ~67% of the particles did not contain DNA material in the capsid head (Figure 3A, red; Movie S3). This information was determined by measurements performed on 42 intact phages and 119 phage capsids lacking tail domains (Figure 3B, S5). It is generally thought that the tail domain enables the initial phage engagement with the bacterial host. Therefore, we expected a majority of the intact phages to be capable of binding to bacteria and potentially infecting them with their genome. An intriguing new finding from this analysis also supports the idea that the presence of the tail domain helps maintain the DNA genome within the capsid domain prior to infection. This finding supports the established paradigm that genomic material is packed into the phage head prior to the tail being attached.32 While this information comes from the T4 phage, the most well-studied tailed phage of the Myoviridae family, these data also suggest this same mechanism for the phage 7–7–1 particle assembly.
Figure 3.

Phage architectures vary in physical features and genomic content. (A) EM tomographic section (left) and reconstruction (green) of an intact phage (capsid + tail) containing genomic material (+DNA) in the capsid head (see also Movie S2). Scale bar is 20 nm. Tomographic section (right) and EM reconstruction (red) of a phage capsid lacking the tail domain. Empty capsids that lacked genetic material (−DNA) were prevalent among the tailless-capsid population (~67%). Scale bar is 30 nm. (B) Quantitative analysis in table and graphical format to indicate variability in phage architectures. These measurements support the idea that a broken or altered tail triggers the release of DNA from the phage capsid (see also Movie S3).
LC-ET of Biological Systems.
After completing the proof-of-concept imaging experiments involving the bacteriophage, we advanced in our efforts to visualize 3-D interactions between the 7–7-1 bacteriophage and its Agrobacterium host. This model system was a suitable choice for developing the LC-ET technique as both the bacterial cell bodies and phage invaders were visible at lower TEM magnifications in liquid. In preparation for in situ imaging experiments, Agrobacterium sp. H13–3 was grown at 30 °C to an OD600 of 0.3. After motility was evaluated via light microscopic observation, cells were concentrated 12-fold via centrifugation on a bed of inert Fluorolube oil and adjusted to a 10-fold concentration with motility buffer (0.5 mM CaCl2, 0.1 mM EDTA, 20 mM HEPES, pH 7.4). Equal volumes of Agrobacterium cells and purified phage suspension (MOI of 200) were added to the microfluidic chamber and incubated for 10 min prior to imaging. Carbon-coated EM grids and SiN microchips were simultaneously glow-discharged and then used to build sandwich platforms containing host and phage components. The enclosed specimen was inserted into a FEI Spirit BioTwin TEM operating at 120 kV. Images were acquired at 15 000× magnification at a defocus of −1.5 μm using an FEI Eagle CCD camera.
Using LC-ET, we were able to visualize the initial stages of phage attachment to its bacterial host in their native liquid environments. Regions of interest contained both bacterial and phage sources that were located toward the center of the imaging window and away from grid bars of the carbon-coated EM grids. Images of these regions revealed flagellated bacterial cells and phage particles colocalized within the liquid environment (Figure 4). The concentration of phage particles was highest near the flagellar filaments, signifying the first step of phage-host interaction. Furthermore, we observed phage particles proximal to the bacterial cell body, indicative of the second phase of interaction, namely phage docking to the bacterial cell surface (Figure 4, inset). As phage attachment can be seen concentrated around flagellar bases, we provide visual evidence that the flagellar interaction is a likely requirement for successful viral attachment to its host23,33,34
Figure 4.

Liquid-phase imaging and statistical analysis of biological interfaces. (A) EM image depicting bacteria and phages contained in liquid phase. Black arrows point to phage particles, and white arrows indicate bacterial flagella. (B) Image with colored contours that correlate to differences in the electron density of biological features in the specimen. Color increments range from light gray (1σ) to yellow (4σ). (C) Image of the specimen tilted to 45°. Inset shows the heads of the phage in direct contact with the bacterial surface. (D) Image with colored contours that correlate to differences in electron density at a 45° tilt. Inset shows the phage heads (magenta) in direct contact with bacterium cell body (cyan). Scale bars are 250 nm.
To ensure that phage particles were in fact interacting with the bacteria’ we tilted the specimen within the microscope column to acquire tomographic information. Images acquired from an untilted and 45°-tilted specimen are indicated in Figure 4A, B. Performing tilt analysis in the TEM permitted us to further segment 3-D interactions and to eliminate the possibility that phages are actually located above or below the bacterial plane rather than clearly interacting with the expected surfaces. We were also able to distinguish features in the images based on electron scattering properties. Objects with similar scattering properties indicate similar electron densities within the liquid layer. These properties were quantified based on statistical significance at different threshold values. Threshold cutoffs were colored to show scattering properties ranging from high to low density in Figure 4C, D.
Differences between the liquid background (low density) and the biological material (higher density) were quantified for each of the images in the tilt series. These differences were based on statistical variability in electron scattering properties (1σ – 4σ) with 1σ indicating a lower density value and 4σ being a higher density value. The color scale in Figure 4B shows the density differences with each color bin representing an increment of 0.5-σ. In assessing these properties’ we were able to estimate the propensity of the phage to attach to the bacterium in a liquid environment as both of these biological sources could be statistically distinguished from the liquid background. These findings are also supported by other recent studies using LC-EM to visualize the infection of E. coli by a P1 phage occurring at 5 nm resolution.35
Host-Pathogen Rules of Engagement.
As the rules of engagement for host-pathogen systems are still being defined for flagellotropic phages and their hosts, improving our understanding of these steps would benefit researchers across the microbiology community. To distinguish specific interactions between the phage and bacterium, we peered through a tomogram image series featuring these key players. Information in the central region of the tomographic reconstruction led us to identify phage particles “distal” from the cell body of the bacterium or “engaged” with the cell surface. This 3-D analysis indicated that the phage particles generally engaged the bacterial surface in a region adjacent to their head assembly rather than their tail fibers. (Figure 5A; Movies S4 and S5). To better visualize these interactions, the image series was density-filtered using a 2σ-threshold cutoff to eliminate background noise. This procedure permitted us to delineate the liquid boundary at the host-pathogen interface. At the low magnification used to acquire the tomogram of the bacteria—phage samples, liquid bubbles are not visually obvious under low-dose conditions. However, the differences between liquid and dry specimens were visually striking. Dried specimens contained numerous areas that were covered with salt and buffer artifacts surrounding the biological material, while hydrated regions lacked these features (Figure S6).
Figure 5.
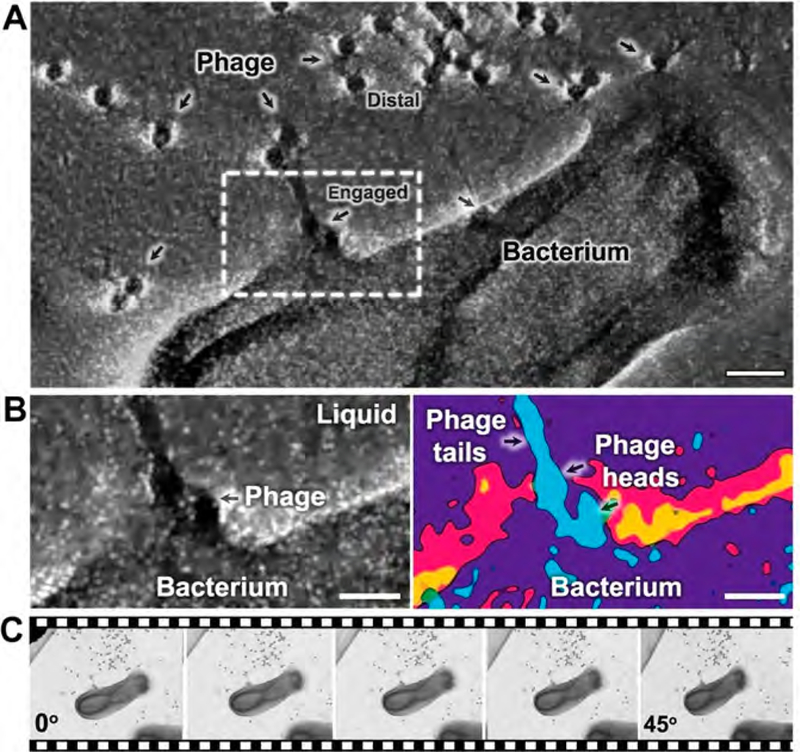
Host-pathogen engagement analysis using tomographic data and heat mapping. (A) View of the central section from a tomographic reconstruction highlighting “distal” and “engaged” phage particles with respect to the bacterium. A region of interest is indicated by the white box. Scale bar is 500 nm. (B) A magnified view of the region of interest with well-defined boundaries defined for the bacterium cell body, attached phage heads, and the surrounding liquid layer. Heat map analysis distinguishes the phage head and tail features (light blue, 4σ) at the liquid boundary (magenta and yellow, ~2σ) and bacterium surface (purple, 3σ). Scale bar is 15 nm. (C) Representative images in the tilt series.
We further analyzed regions of interest within the tomogram that exhibited a high signal-to-noise ratio and clearly discernible phage particles attached to the bacterium. Heat maps were generated based on electron density scattering properties, similar to the routines implemented for Figure 4. These maps were colorized to enhance biological features within regions of interest. One example of this analysis is shown in Figure 5A, B (white box). This region contains distinct phages with capsid and tail domains intact (light blue, 4σ-threshold), located in the thin liquid boundary (magenta/yellow, ~2σ-threshold) upon the host cell body (purple, 3σ-threshold). The images compiled in the tomogram enhanced the numerical values for the liquid layer in the heat map analysis.
Overall, the level of electron scattering from the liquid background along with that of the bacterium remained less dense at the interface region than the phage particles. This effect can be attributed to the densely packed genomic material within the phage capsids which enhance its density in the liquid environment. The raw images that support this analysis are provided in Figure 5C. The phage particles identified in proximity to the cell body each contained capsid and tail domains along with their genome. This analysis was confirmed by high density values in the phage heads determined in Figures 4 and 5. We interpret these results to mean that the engaged phages found along the cell body were primed and prepared to infect the host bacterium. Additional experiments to capture real-time movies of the infection process using LC-ET are ongoing in our laboratory.
Technical Considerations for Performing LC-ET.
Due to the nature of the microchip sandwich assembly being composed of two different materials, the levels of enclosed liquid may be variable across the imaging landscape. Thereby, the imaging time frame is not a standard value throughout the entire sandwich and needs to be evaluated during the imaging process. Ultrathin areas of the liquid sample may become damaged by the electron beam over the time-course needed to acquire a full tomogram data set. Damaging effects can be minimized by using low-dose imaging conditions (<1 electron/Å2 per exposure). Each tomographic series contained between 10–20 images, creating a total dose of ~10–20 electrons/Å2 per reconstruction. This level of detail was sufficient to visualize bacteria—phage interactions.
Another consideration for tomographic reconstructions of all varieties is the issue of the missing wedge. This effect will present a greater factor in downstream 3-D reconstruction routines if too few images are collected, resulting in lower quality density maps. The number of tilt-angle increments can be increased to improve spatial resolution or decreased to avoid excessive radiolysis. In addition, the eucentric height of the sandwich assembly also needs to be established between regions of interest due to changes in liquid thickness or sample variability. As the microchip sandwich assembly is comprised of two surfaces that can be functionalized or labeled to capture molecules of interest, 3-D affinity capture experiments are possible to evaluate using LC-ET methodologies. As we continue to pursue these technical developments, we expect results from this work to reveal mechanistic events in real-time and in 3-D, which is a common goal of researchers working in both materials and life sciences.
Methods.
Bacteria and Phage Growth Conditions.
In preparation for in situ imaging procedures, Agrobacterium sp. H13–3 was grown from a single colony in TYC medium (0.5% tryptone, 0.3% yeast extract, 0.13% CaCl2 (pH, 7.0) containing streptomycin (600 μMg/mL) at 30 °C until an OD600 of 0.3 was reached. Bacterial cell motility was evaluated via observation using a light microscope. Approximately 1.5 mL of bacterial culture was concentrated 10-fold by layering over 0.5 mL of Fluorolube and centrifuging the sample at 14 000g for 10 min at room temperature. The top aqueous layer was removed and discarded. The interphase layer containing bacterial cells was collected, and 75 μL of the sample was resuspended in 25 μL of motility buffer (0.5 mM CaCl2, 0.1 mM EDTA, and 20 mM HEPES, pH 7.4). Following resuspension, bacteria were re-evaluated for motility. Bacterial cells and purified phages were added to the microfluidic chamber at a 1:1 ratio and incubated for 10 min prior to imaging.
Carbon-Coated EM Grid Preparation.
Carbon-coated EM grids were prepared using previously described procedures.27 Briefly, a large glass beaker was filled with deionized water, and 1 drop of amyl acetate (Collodion, Electron Microscopy Sciences) was added on top of the water layer. As the Collodion spread, it formed a thin plastic film. Several copper EM grids (400 mesh, Ted Pella) were placed on top ofthe plastic film. A piece of paper that covers the grid area was placed on top of the grids and allowed to fully soak. Using forceps, the paper was carefully lifted with the grids attached and placed grid-side up in a glass Petri dish. The grids were allowed to air-dry. Once dry, the grids were placed into a carbon evaporator unit and coated using standard procedures. We used a Denton 502A for our carbon-coating procedures. Grids were glow-discharged using a Pelco easiGlow system (Ted Pella) operating under standard procedures.
Microchip Sandwich Preparation.
A variety of SiN micro-chip designs were tested for their usefulness in tomographic data collection. The optimal microchip design had larger viewing areas with windows in the range of 500 × 500 μm in the x- and y-dimensions. This simple window design allowed for maximum tilt angles to be achieved within the EM column. Additionally, microchips comprised of 5 μm pillars spaced 20 μm apart proved useful in providing maximum viewing area with additional reinforcement due to the integrated pillars. For sandwich experiments, microchips were cleaned and prepared as previously described.36 Cleaned chips were glow-discharged twice for 90 s each using a Ted Pella easiGlow device. Carbon-coated copper grids were also glow-discharged using the same procedures. For specimen sandwich production, EM grids were placed in a gel pack; a 2 μL aliquot of the sample was pipetted onto the cleaned copper grid, and a microchip was carefully lowered onto the sample droplet. This assembly was then placed within the tip of the specimen holder, oriented so that the windows and grid bars align in a manner that allows for optimal tilting procedures. Finally, the grid clip was lowered onto the sandwich that was inserted into the TEM.
LC-ET Data Collection and Image Processing.
Upon successfully producing the microchip sandwich specimen, TEM images were collected using a FEI Spirit BioTwin TEM operating at 120 kV. Images of individual bacteriophages were acquired at 49 000× magnification at a defocus of –1.5 μm using a FEI Eagle CCD camera. Images of phages interacting with bacterium were recorded at 15 000× magnification at a defocus value of –1.5 μm using the same TEM and CCD camera. Images were generally acquired within 1 h of specimen preparation. After 1 h of imaging, selected areas having thin liquid layers may be susceptible to drying effects. Images of tilted specimens were recorded at increments of 5 degrees between the largest angles available in the area of interest. In optimum areas of the assembly, it was possible to tilt the specimen in the TEM at tilt angles of ±45°. Data were processed using ETOMO to align images and generate a 3-D image stack. The aligned stack was used to create a 3-D reconstruction of the sample. To generate heat maps for image analysis, pixel values of the signal-to-noise ratio were classified according to their statistical significance level. Threshold cutoffs were colored and used to help with image interpretation in Figures 4 and 5.
Movie Production.
The accompanying movies show representative tomograms of a bacteriophage sample (Movies 1–3) as well as host—pathogen interactions between the bacterium and phage sample (Movies 4 and 5). The density maps are digitally tilted or sliced through to reveal surface interactions between the phage and bacterium structure (Movies 4 and 5). As images are sliced through in one direction, they are then filled to reconstitute the reconstruction in its final form. In each movie reconstruction, the liquid environment allows for a full albeit lower resolution of native biological interfaces.
Supplementary Material
Segmentation and 3-D reconstruction of a bacteriophage in liquid (MOV)
Tomography analysis of a phage capsid containing genetic material (MOV)
Tomography analysis of a phage capsid lacking genetic material (MOV)
Image tilt series of host–pathogen interactions (MOV)
Tomographic reconstruction of a phage engaging the host cell body (MOV)
ACKNOWLEDGMENTS
This work was supported by the National Institutes of Health and the National Cancer Institute (Grant R01CA193578) to D.F.K.
Footnotes
ASSOCIATED CONTENT
Supporting Information
Supporting Information is available for this work, including supporting Figures S1–S6 and supporting Movies S1 – S5. The Supporting Information is available free of charge on the ACS Publications website at DOI: 10.1021/acs.nanolett.9b01309.
Figures of microchip sandwich preparation, features of bacteriophages prepared under different conditions, visual comparison ofspecimen thicknesses, dry and liquid regions of phage specimens showing visually distinct features, images of phage architectures and reconstructions, and comparison of dry and liquid samples containing bacteria (PDF)
The authors declare no competing financial interest.
REFERENCES
- (1).Williamson MJ; Tromp RM ; Vereecken PM; Hull R; Ross FM Dynamic Microscopy of Nanoscale Cluster Growth at the Solid-Liquid Interface. Nat. Mater 2003, 2 (8), 532–536. [DOI] [PubMed] [Google Scholar]
- (2).Zheng H; Smith RK; Jun Y-W; Kisielowski C; Dahmen U; Alivisatos AP Observation of Single Colloidal Platinum Nanocrystal Growth Trajectories. Science 2009, 324 (5932), 1309–1312. [DOI] [PubMed] [Google Scholar]
- (3).Yuk JM; Park J; Ercius P; Kim K; Hellebusch DJ; Crommie MF; Lee JY; Zettl A; Alivisatos AP High-Resolution EM of Colloidal Nanocrystal Growth Using Graphene Liquid Cells. Science 2012, 336 (6077), 61–64. [DOI] [PubMed] [Google Scholar]
- (4).Nielsen MH; Li D; Zhang H; Aloni S; Han TY-J; Frandsen C; Seto J; Banfield JF; Colfen H; De Yoreo JJ Investigating Processes of Nanocrystal Formation and Transformation via Liquid Cell TEM. Microsc. Microanal. 2014, 20 (2), 425–436. [DOI] [PubMed] [Google Scholar]
- (5).Cameron Varano A; Rahimi A; Dukes MJ; Poelzing S; McDonald SM; Kelly DF Visualizing Virus Particle Mobility in Liquid at the Nanoscale. Chem. Commun. 2015, 51 (90), 16176–16179. [DOI] [PMC free article] [PubMed] [Google Scholar]
- (6).de Jonge N; Ross FM Electron Microscopy of Specimens in Liquid. Nat. Nanotechnol. 2011, 6 (11), 695–704. [DOI] [PubMed] [Google Scholar]
- (7).Murata K; Wolf M Cryo-Electron Microscopy for Structural Analysis of Dynamic Biological Macromolecules. Biochim. Biophys. Acta, Gen. Subj. 2018, 1862 (2), 324–334. [DOI] [PubMed] [Google Scholar]
- (8).Migunov V; Ryll H; Zhuge X; Simson M; Struder L; Batenburg KJ; Houben L; Dunin-Borkowski RE Rapid Low Dose Electron Tomography Using a Direct Electron Detection Camera. Sci. Rep. 2015, 5, 14516. [DOI] [PMC free article] [PubMed] [Google Scholar]
- (9).Bartesaghi A; Lecumberry F; Sapiro G; Subramaniam S Protein Secondary Structure Determination by Constrained Single-Particle Cryo-Electron Tomography. Structure 2012, 20 (12), 2003–2013. [DOI] [PMC free article] [PubMed] [Google Scholar]
- (10).Dierksen K; Typke D; Hegerl R; Baumeister W Towards Automatic Electron Tomography II. Implementation ofAutofocus and Low-Dose Procedures. Ultramicroscopy 1993, 49 (1), 109–120. [Google Scholar]
- (11).Tocheva EI; Li Z; Jensen GJ Electron Cryotomography. Cold Spring Harbor Perspect. Biol. 2010, 2 (6), a003442. [DOI] [PMC free article] [PubMed] [Google Scholar]
- (12).Pettersen EF; Goddard TD; Huang CC; Couch GS; Greenblatt DM; Meng EC; Ferrin TE UCSF Chimera-a Visualization System for Exploratory Research and Analysis. J. Comput. Chem. 2004, 25 (13), 1605–1612. [DOI] [PubMed] [Google Scholar]
- (13).Hu B; Morado DR; Margolin W; Rohde JR; Arizmendi O; Picking WL; Picking WD; Liu J Visualization of the Type III Secretion Sorting Platform of Shigella Flexneri. Proc. Natl. Acad. Sci. U. S.A. 2015, 112 (4), 1047–1052. [DOI] [PMC free article] [PubMed] [Google Scholar]
- (14).Park D; Lara-Tejero M; Waxham MN ; Li W; Hu B; Galan JE; Liu J Visualization ofthe Type III Secretion Mediated Salmonella-Host Cell Interface Using Cryo-Electron Tomography. eLife. 2018, 7, No. e39514. [DOI] [PMC free article] [PubMed] [Google Scholar]
- (15).Nans A; Saibil HR; Hayward RD Pathogen-Host Reorganization during Chlamydia Invasion Revealed by Cryo-Electron Tomography. Cell. Microbiol. 2014, 16 (10), 1457–1472. [DOI] [PMC free article] [PubMed] [Google Scholar]
- (16).Wang F; Burrage AM; Postel S; Clark RE; Orlova A; Sundberg EJ; Kearns DB; Egelman EH A Structural Model of Flagellar Filament Switching across Multiple Bacterial Species. Nat. Commun. 2017, 8 (1), 960. [DOI] [PMC free article] [PubMed] [Google Scholar]
- (17).Ghosal D; Chang Y-W; Jeong KC; Vogel JP; Jensen GJ In Situ Structure of the Legionella Dot/Icm Type IV Secretion System by Electron Cryotomography. EMBO Rep. 2017, 18 (5), 726–732. [DOI] [PMC free article] [PubMed] [Google Scholar]
- (18).Basler M; Pilhofer M; Henderson GP; Jensen GJ; Mekalanos JJ Type VI Secretion Requires a Dynamic Contractile Phage Tail-like Structure. Nature 2012, 483 (7388), 182–186. [DOI] [PMC free article] [PubMed] [Google Scholar]
- (19).Jasnin M; Asano S; Gouin E; Hegerl R; Plitzko JM; Villa E; Cossart P; Baumeister W Three-Dimensional Architecture of Actin Filaments in Listeria Monocytogenes Comet Tails. Proc. Natl. Acad. Sci. U. S. A. 2013, 110 (51), 20521–20526. [DOI] [PMC free article] [PubMed] [Google Scholar]
- (20).Jiao X; Roiban L; Foray G; Masenelli-Varlot K Electron Tomography on Latex Particles Suspended in Water Using Environmental Scanning Electron Microscopy. Micron 2019, 117, 60–67. [DOI] [PubMed] [Google Scholar]
- (21).Hu B; Margolin W; Molineux IJ; Liu J Structural Remodeling of Bacteriophage T4 and Host Membranes during Infection Initiation. Proc. Natl. Acad. Sci. U. S. A. 2015, 112 (35), E4919–E4928. [DOI] [PMC free article] [PubMed] [Google Scholar]
- (22).Kennedy E; Nelson EM; Tanaka T; Damiano J; Timp G Live Bacterial Physiology Visualized with 5 Nm Resolution Using Scanning Transmission Electron Microscopy. ACS Nano 2016, 10 (2), 2669–2677. [DOI] [PubMed] [Google Scholar]
- (23).Gonzalez F; Helm RF; Broadway KM; Scharf BE More than Rotating Flagella: LPS as a Secondary Receptor for Flagellotropic Phage 7–7-1. J. Bacteriol 2018, 200, e00363–18. [DOI] [PMC free article] [PubMed] [Google Scholar]
- (24).Rossmann MG; Mesyanzhinov VV; Arisaka F; Leiman PG The Bacteriophage T4 DNA Injection Machine. Curr. Opin. Struct. Biol. 2004, 14 (2), 171–180. [DOI] [PubMed] [Google Scholar]
- (25).Jiang W; Chang J; Jakana J; Weigele P; King J; Chiu W Structure of epsilon15 Bacteriophage Reveals Genome Organization and DNA Packaging/injection Apparatus. Nature 2006, 439 (7076), 612–616. [DOI] [PMC free article] [PubMed] [Google Scholar]
- (26).Molineux IJ; Panja D Popping the Cork: Mechanisms of Phage Genome Ejection. Nat. Rev. Microbiol. 2013, 11 (3), 194–204. [DOI] [PubMed] [Google Scholar]
- (27).Booth DS; Avila-Sakar A; Cheng Y Visualizing Proteins and Macromolecular Complexes by Negative Stain EM: From Grid Preparation to Image Acquisition. J. Vis. Exp. 2011, No. 58, 3227. [DOI] [PMC free article] [PubMed] [Google Scholar]
- (28).Adrian M; Dubochet J; Lepault J; McDowall AW Cryo-Electron Microscopy of Viruses. Nature 1984, 308 (5954), 32–36. [DOI] [PubMed] [Google Scholar]
- (29).Mastronarde DN Dual-Axis Tomography: An Approach with Alignment Methods That Preserve Resolution. J. Struct. Biol. 1997,120 (3), 343–352. [DOI] [PubMed] [Google Scholar]
- (30).Kremer JR; Mastronarde DN; McIntosh JR Computer Visualization of Three-Dimensional Image Data Using IMOD. J. Struct. Biol. 1996, 116 (1), 71–76. [DOI] [PubMed] [Google Scholar]
- (31).Veesler D; Cambillau C A Common Evolutionary Origin for Tailed-Bacteriophage Functional Modules and Bacterial Machineries. Microbiol. Mol Biol. Rev. 2011, 75 (3), 423–433. [DOI] [PMC free article] [PubMed] [Google Scholar]
- (32).Yap ML; Rossmann MG Structure and Function of Bacteriophage T4. Future Microbiol. 2014, 9 (12), 1319–1327. [DOI] [PMC free article] [PubMed] [Google Scholar]
- (33).Yen JY; Broadway KM; Scharf BE Minimum Requirements of Flagellation and Motility for Infection of Agro-bacterium Sp. Strain H13–3 by Flagellotropic Bacteriophage 7–7-1. Appl Environ. Microbiol. 2012, 78 (20), 7216–7222. [DOI] [PMC free article] [PubMed] [Google Scholar]
- (34).Lotz W; Acker G; Schmitt R Bacteriophage 7–7-1 Adsorbs to the Complex Flagella of Rhizobium Lupini H13–3. J. Gen. Virol. 1977, 34 (1), 9–17. [DOI] [PubMed] [Google Scholar]
- (35).Liu J; Chen C-Y; Shiomi D; Niki H; Margolin W Visualization of Bacteriophage P1 Infection by Cryo-Electron Tomography of Tiny Escherichia Coli. Virology 2011, 417 (2), 304–311. [DOI] [PMC free article] [PubMed] [Google Scholar]
- (36).Dukes MJ; Gilmore BL; Tanner JR; McDonald SM; Kelly DF In Situ TEM of Biological Assemblies in Liquid. J. Vis. Exp. 2013, No. 82, 50936. [DOI] [PMC free article] [PubMed] [Google Scholar]
Associated Data
This section collects any data citations, data availability statements, or supplementary materials included in this article.
Supplementary Materials
Segmentation and 3-D reconstruction of a bacteriophage in liquid (MOV)
Tomography analysis of a phage capsid containing genetic material (MOV)
Tomography analysis of a phage capsid lacking genetic material (MOV)
Image tilt series of host–pathogen interactions (MOV)
Tomographic reconstruction of a phage engaging the host cell body (MOV)