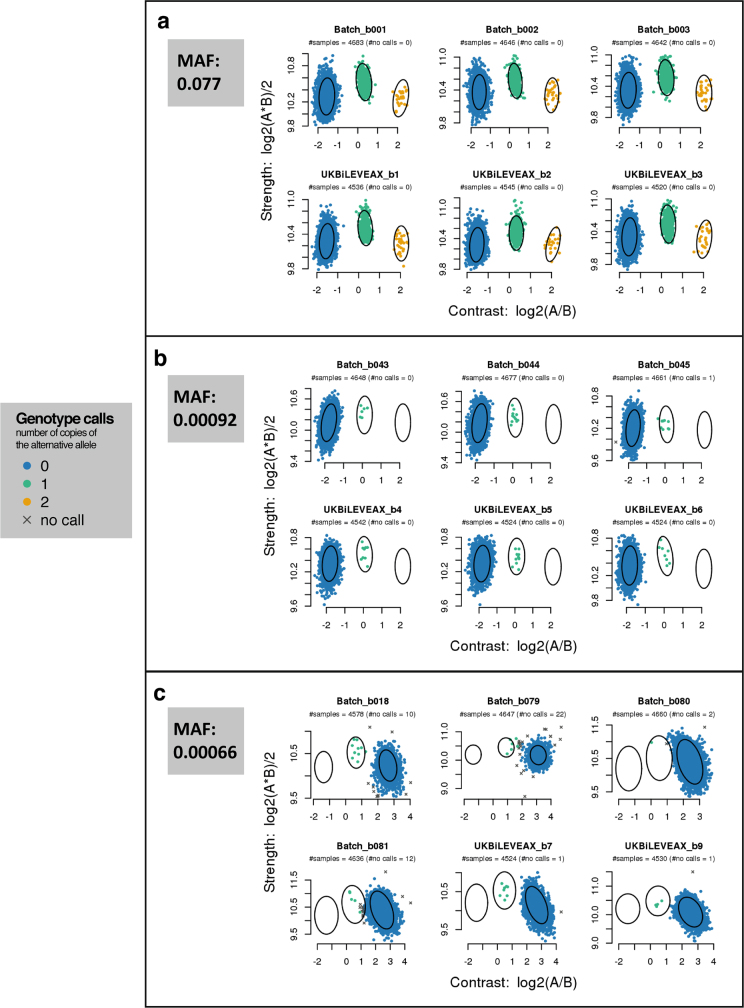
Extended Data Fig. 2. Examples of intensity data and genotype calls for markers of different allele frequencies.
Each sub-figure shows intensity data for a single marker within six different batches. Batches labelled with the prefix ‘UKBiLEVEAX’ contain only samples typed using the UK BiLEVE Axiom array, and those with the prefix ‘batch’ contain only samples typed using the UK Biobank Axiom array. Each point represents one sample and is coloured according to the inferred genotype at the marker. The x and y axes are transformations of the intensities for probe sets targeting each of the alleles ‘A’ and ‘B’ (see Supplementary Information for definition of probe set). The ellipses indicate the location and shape of the posterior probability distribution (two-dimensional multivariate normal) of the transformed intensities for the three genotypes in the stated batch. That is, each ellipse is drawn such that it contains 85% of the probability density. See Affymetrix Axiom Genotyping Solution Data Analysis Guide16 for more details of Affymetrix genotype calling. The MAF of each of the markers is computed using all samples in the released UK Biobank genotype data. a, A marker with a MAF of 0.077 with well-separated genotype clusters. b, Intensities for a marker with a MAF of 0.00092 with well-separated genotype clusters. As would be expected under Hardy–Weinberg equilibrium, there are no instances of samples with the minor homozygote genotype. c, Intensities for a marker with a MAF of 0.00066, and in which the heterozygote cluster is not well separated from the large major homozygote cluster in some batches, making it more difficult to call the heterozygous genotypes confidently.

