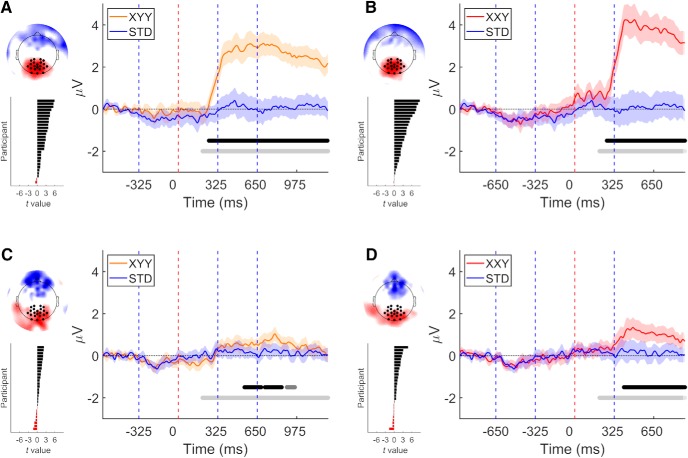
Figure 3.
A P3b response was elicited by both deviant types in experiments 1 (A, B), but not detected in experiment 2 (C, D). On each panel: right, grand average over parietal ROI. Vertical dashed lines indicate syllable boundaries. Time 0 indicates the point at which deviance occur. Shaded areas denote 95% CI. Horizontal light gray line delimits time window of analysis. Middle gray horizontal line indicates p < 0.05 (cluster corrected). Black horizontal line indicates p < 0.01 (cluster corrected). Left top, Topography of the difference wave, mean over the time of the positive cluster. Left bottom, Individual participants’ t values calculated over mean cluster time.

