

Abstract
Nemacheilidae, in the superfamily Cobitoidea, is comprised of many of morphologically similar fish species that occur in Eurasian water bodies. This large group shows inconsistencies between traditional morphological taxonomy and molecular phylogenetic data. We used mitochondrial genomes, recombinase‐activating gene proteins 1 (RAG1) and the mitochondrial cytochrome c oxidase I gene (COI) to study the phylogenetic relationships among Nemacheilidae species using Bayesian inference and maximum likelihood approaches. Phylogenetic analyses based on mitogenomes provided support for two clades (I and II). The mitogenomes, RAG1, and COI results indicated that several species and genera were not consistent with the traditional morphological subdivisions. The two clades inferred from mitogenomes showed clear geographical patterns. The Tibetan Plateau, Hengduan Mountains, and the Iran Plateau may act as a barrier dividing the clades. The estimated timing of clades separation (36.05 million years ago) coincides with the first uplift of the Tibetan Plateau. We conclude that the geological history of the Tibetan Plateau played a role in the diversification and distribution of the Nemacheilidae taxa. These results provided a phylogenetic framework for future studies of this complex group.
Keywords: COI, mitochondrial genomes, Nemacheilidae, phylogeny, recombinase‐activating gene proteins 1, taxonomic problem
In this study, we combined two novel mitochondrial (mtDNA) genomes and 56 published mtDNA genomes of Nemacheilidae species to reconstruct the robust phylogenetic trees for Nemacheilidae species and discuss taxonomic issues and biogeographic history occurred within this family. The results demonstrate many species and even genus are not congruent with the traditional morphological subdivision and find that the geological history of the Tibetan Plateau plays a critical role in driving the diversification and distribution of the Nemacheilidae taxa.
1. INTRODUCTION
The Nemacheilidae is a large family with more than 600 known fish species in 48 genera (Eschmeyer & Fong, 2015). Several new Nemacheilidae species have been continuously reported in the past decade (Du, Chen, & Yang, 2008; Erk‐Akan, Nalbant, & Zeren, 2012; Hu & Zhang, 2010; Kosygin, 2012; Zheng, Du, Chen, & Yang, 2009). More new species are expected to be named in this family. Nemacheilids are small benthic fish mainly distributed in Eurasian waters (http://www.fishbase.com), with the exception of the genus Afronemacheilus that occurs in Africa. Most Nemacheilid species are found in Asia (Kottelat, 2012; Zhu, 1989), and this suggests that Asia is the distribution center of this group (Eschmeyer & Fong, 2015).
There are many morphologically similar species within Nemacheilidae (Nalbant & Bianco, 1998). The species with significant morphological variation and widespread distributions present taxonomic problems. Morphological variation is often inconsistent with the proposed molecular phylogenetic relationships (Liu et al., 2012; Prokofiev, 2009; Sgouros, 2016; Tang, Liu, Mayden, & Xiong, 2006; Zhu, 1989). For example, Schistura species do not display monophyly but instead show polyphyly (Liu et al., 2012; Nalbant & Bianco, 1998; Sgouros, 2016; Tang et al., 2006). Several Homatula species exhibit either paraphyly or polyphyly (Min, Chen, Yang, Winterbottom, & Mayden, 2012). Studies including morphological traits and phylogenetic inference are needed to unravel the complex species relationships among the Nemacheilidae.
Previous studies focused on the phylogeny of a small number of species or specific genera within the Nemacheilidae (Bohlen & Lechtova, 2009; Jamshidi, Abdoli, Sherafatian, & Golzarianpour, 2013; Liu et al., 2012; Liu, Zhang, Tang, & Liu, 2010; Min et al., 2012; Sgouros, 2016; Tang et al., 2006; Wang et al., 2016). Tang et al. (2006) studied the phylogeny of the Cobitoidea based on the mitochondrial cytochrome b gene and control region, but included only 20 Nemacheilidae species. Wang et al. (2016) studied the phylogenetics of Triplophysa using the entire mitochondrial genome. Since most studies have involved limited species, genera, sample sizes, or the number of molecular characters, many phylogenetic patterns could be missed. Additionally, phylogenetic analyses using more species, genus, larger sample sizes, and larger molecular datasets are needed to determine the phylogenetic relationships among Nemacheilidae species.
Understanding the factors shaping the diversity of taxa is important in evolutionary biology. Nemacheilidae species have limited dispersal ability and are unable to readily cross mountains and rivers. As such, the species may provide clues of earlier geological movements. Wang et al. (2016) argued that the Early Miocene uplifts of the Tibetan Plateau led to divergence of the genus Triplophysa. After the collision of the Indian plate with Asian plate in the early Cenozoic, the Tibetan plateau began its uplift (Chung et al., 1998; Ruddiman, 1998; Tapponnier et al., 2001; Yin & Harrison, 2000). The uplift of the plateau changed the landscape of the Asian continent and was the key driving force behind long‐term Cenozoic climate change (An, Kutzbach, Prell, & Porter, 2001; Manabe & Broccoli, 1990). Nemacheilids likely experienced the effects of this geologic event because their current distributions are related to geological features such as the Tibetan Plateau, Tarim basin, and the Himalaya Mountains. An accurate estimation of phylogeny and divergence times of living Nemacheilids provides evidence for the influences of orogenic movements.
In this study, we sequenced and annotated two complete mitochondrial genomes of Schistura fasciolata and Schistura incerta using Illumina MiSeq. We combined our data with 56 complete mitochondrial genomes of Nemacheilidae species in GenBank and reconstruct the robust phylogenetic trees for Nemacheilidae species. We used these data to discuss taxonomic issues within the Nemacheilidae. The recombinase‐activating gene proteins 1 (RAG1) and the mitochondrial cytochrome c oxidase I gene (COI) were also used to study the taxonomy of this family. We then discuss how the orogenic movements in Asia appear to have contributed to Nemacheilidae diversity.
2. METHODS AND MATERIALS
2.1. Specimen collection, DNA extraction, and RAG1 amplification
Schistura fasciolata was collected during May in 2015 from the Xinfengjiang River (24.07N and 114.21E), a tributary within the Pearl River drainage. Schistura incerta was sampled from an independent river named the Nanliujiang River during July in 2018. A bit of fin tissues of the two species were preserved in 100% ethanol, then stored at −20°C after being transported to the laboratory until used for further DNA extraction.
Total genomic DNA was extracted from fin tissue using a standard phenol/chloroform extraction method. RAG1 fragment for the two species was amplified using the primers RAG1F1 and RAG1.4090R1 (Liu et al., 2012). The amplification of genomic DNA was conducted in a 25 µl reaction with an initial denaturation period of 4 min at 94°C followed by 34 cycles of 94°C for 30 s, primer‐specific annealing temperature of 52°C for 40 s, 72°C for 90 s and a single final extension at 72°C for 7 min. The amplified fragments were purified using 1.2% low‐melting agarose gel electrophoresis and sequenced with the identical primer pair using an ABI PRISM 3700 (Applied Biosystems) automatic DNA sequencer.
2.2. Mitochondrial genome amplification, sequencing, assembly, and annotation
Total genomic DNA was extracted from 100 mg fin tissues using a Genomic DNA Isolation Kit (QiaGene) according to the manufacturer's instructions. Complete mitochondrial genome sequencing was performed on the Illumina MiSeq platform (Illumina Inc). The Illumina raw sequence reads were edited using the NGS QC Tool Kit v2.3.3 (Patel & Jain, 2012), with a cutoff value of 50 and 20, respectively, for percentage of read length and PHRED quality score. High‐quality reads were assembled into contigs using the de novo assembler SPAdes 3.9.0 (Bankevich et al., 2012), utilizing a k‐mer set of 93, 95, 97, 103, 105, 107, and 115. The de novo contigs were then assembled into complete mitochondrial genomes by further connection using SOAPdenovo (Luo et al., 2012). The harvested mitogenome sequences of S. fasciolata (16,560 bp) and S. incerta (16,561 bp) were deposited in GenBank (KY404236 and MK361215).
2.3. Sequences collection
The mitochondrial genomes of 56 Nemacheilidae species belonging to 16 genera were downloaded from GenBank (Table S1). The distributions and classification system of each species were collected and verified from FISHBASE (http://fishbase.sinica.edu.tw) and literatures (Kottelat, 2012; Zhu, 1989). Two species from the Balitoridae, two species from the Botiidae, and five species from the Cobitinae were included in our analyses. Two species from the Catostomidae derived from GenBank were selected as outgroups (Tang et al., 2006; Table S1).
The RAG1 sequences of 55 Nemacheilidae species belonging to 18 genera were obtained from GenBank (Table S2). The COI sequences of 148 Nemacheilidae species in 26 genera were downloaded from the BOLD system (http://www.boldsystems.org). The COI sequences of S. fasciolata and S. incerta were extracted from their mitochondrial genomes. The taxonomic information, accession numbers, and distributions of each species are provided in Table S3. Species from the Balitoridae, Botiidae, Cobitinae, and Vaillantellidae were included in RAG1 and COI analyses. Species from the Catostomidae were chosen according to Tang et al. (2006).
2.4. Mitochondrial genomes
A total of 68 mitochondrial genomes including the two outgroups were analyzed. We aligned the mitochondrial genomes using MUSCLE (Edgar, 2004) and then extracted 22 tRNA genes, 13 protein‐coding genes (PCGs), and two ribosomal RNA genes manually. We omitted control regions of the mitochondrial genomes from the final matrix, as some species did not possess this gene fragment. We detected a signal of saturation at the third codon positions of the PCGs using Xia's method in DAMBE5 (NumOTU = 32, Iss = 0.602, Iss.c Asym = 0.555, p < .0001; Table S4; Xia, 2013; Xia & Lemey, 2009). We ran subsequent analyses without the third codon positions of the 13 PCGs. We partitioned the sequence alignment into five subsets: two for 1st and 2nd codon positions of the 13 PCGs, two for the 12s and 16s rRNA genes, and one for the 22 tRNA genes. The optimal partitioning scheme and the best‐fit nucleotide substitution model for each partition of the mtDNA molecules were estimated using the software PartitionFinder (Lanfear, Calcott, Ho, & Guindon, 2012).
The phylogenetic relationships were reconstructed using Bayesian inference (BI) and maximum likelihood (ML) techniques. The BI analyses were performed using MrBayes 3.1.2 (Ronquist & Huelsenbeck, 2003). Four independent runs were performed for 20 million generations. The phylogenetic trees were sampled every 1,000th generation, which resulted in 20,000 trees, and the first 25% were discarded as burn‐ins. Convergence of the BI analyses was assessed by the average standard deviation of split frequencies <0.01 and the potential scale reduction factors (PSRF) were close to 1.0 for all parameters. We also used Tracer v1.5 (Rambaut & Drummond, 2007) to investigate the convergence of the BI analyses. The ML analyses were implemented in RAxML‐VI‐HPC (Stamatakis, 2006) with the GTR + I + G model. Nodal support values were evaluated from 1,000 nonparametric bootstrap replicates. The best partition scheme (Table S5), as determined by PartitionFinder was used in the phylogenetic analyses.
2.5. RAG1 and COI
We aligned RAG1 and COI sequences using MUSCLE. BI and ML analyses were used to infer phylogenetic relationships among Nemacheilidae species using MrBayes 3.1.2 and RAxML‐VI‐HPC, respectively. The optimal substitution model was chosen based on the Akaike information criterion (AIC) in MrModeltest version 2.3. Four independent runs were performed for 50 million generations. The phylogenetic trees were sampled every 1,000th generation and the first 25% were discarded as burn‐ins. The ML analyses were conducted with the GTR + I + G model and 1,000 nonparametric bootstrap replicates.
2.6. Divergence time estimation
We estimated node age using the Bayesian phylogenetic software BEAST v1.8.2 (Drummond & Rambaut, 2007). The concatenated sequences containing the 22 tRNA genes, the 1th and 2nd of the 13 PCGs, and the two ribosomal RNA genes were analyzed. An independent GTR model of nucleotide substitution with gamma‐distributed rate variation across sites inferred by MrModeltest (Nylander, 2004) and the uncorrelated lognormal relaxed clock (Drummond, Ho, Phillips, & Rambaut, 2006) were used for this analysis. The initial phylogenetic tree was generated randomly, and the tree prior followed a Yule branching model.
Two fossil calibrations were incorporated in this study. (a) The oldest fossil of Plesiomyxocyprinus arratiae similar to Myxocyprinus asiaticus was constrained to be from the middle Eocene (38–40 Ma). This calibration point was modelled using a normal distribution with a mean of 39 Ma and standard deviation of 1.0 Ma, providing a 95% confidence interval of 37.76–40.64 Ma (C1). (b) Another fossil calibration of the genus Cobitis was 13.8–15.9 Ma (C2). A lognormal prior of 14.9 Ma was taken as the zero offset; the default lognormal standard deviation of 0.04 was used to constrain this node, giving a 95% confidence interval of 13.94–15.9 Ma. Four independent runs were performed using 100 million generations and sampling every 1,000th tree with the same settings. We then log‐combined the two analyses into one dataset using LogCombiner v1.8.0 (Drummond & Rambaut, 2007), as several ESSs of posteriors of an independent run were <200. All runs were checked for sufficient mixing, stable convergence on unimodal posterior, and effective sample sizes for all parameters using TRACER v1.5. Subsequently, after removing 50% of the resulting trees as burn‐in, the resulting trees were summarized in a Maximum Clade Credibility consensus tree with TreeAnnotator v1.8.0 (Drummond & Rambaut, 2007).
3. RESULTS
3.1. Characteristics of the two Schistura mitogenomes
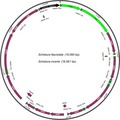
The genomes of S. fasciolata and S. incerta reached 16,560 and 16,561 bp, respectively. Both genomes contained a typical set of 37 mitochondrial genes (13 PCGs, 22 tRNAs and 2 rRNAs) and a putative control region (also known as A+T‐rich region; Figure 1).
Figure 1.

Organization of the two newly sequenced mitochondrial genomes of Schistura fasciolata and Schistura incerta
3.2. Phylogenetic trees based on mitogenomes
The length of 68 aligned mitochondrial genomes reached 16,011 bp. After discarding the third positions of the 13 PCGs, the remaining bases (12,163 bp) were used for phylogenetic inference and divergence time estimates. BI and ML analyses yielded identical and well‐supported tree topologies in major nodes. They differed only in the support values for certain nodes (Figure 2). The phylogenetic results showed that the family Nemacheilidae has two main clades (I and II; Figure 2), each with high support. Genera Schistura, Petruichthys, Mesonoemacheilus, Oxynoemacheilus, Hedinichthys, Nemachilichthys, Acanthocobitis, Aborichthys, and Nemacheilus grouped into clade I and genera Triplophysa, Claea, Barbatula, Tuberoschistura, Homatula, Schistura, Micronemacheilus, Oreonectes, and Lefua clustered into clade II.
Figure 2.

Maximum likelihood tree for 58 Nemacheilidae species based on mtDNA genomes. Numbers near branches indicate bootstrap proportions and Bayesian posterior probabilities from maximum likelihood analysis and Bayesian inferences, respectively. Number in bold with red dot shows the divergence time estimation with 95% confidence interval (CI) between the Nemacheilidae clades. C1 and C2 represent the placement for the two calibrations used in our study
Unexpectedly, several genera did not form the reciprocal monophyly inferred from the ML and BI trees. Claea dabryi and Triplophysa bleekeri formed a clade that was sister to T. anterodorsalis. Representative species from Petruichthys, Oxynoemacheilus, and Mesonoemacheilus were nested within the genus Schistura with strong support. Oreonectes furcocaudalis first clustered with genus Lefua and then was sister to the clade containing Yunnanilus cruciatus and Oreonectes platycephalus (Figure 2). We found that members of genus Schistura were separated between the two major clades. The divergence time between the two clades was estimated to have occurred 36.05 Ma (23.00–51.09 Ma 95% confidence interval [CI]; Figure 2).
3.3. Phylogenetic trees based on RAG1 and COI
The length of aligned RAG1 and COI sequences reached 865 and 626 bp, respectively. Neither BI or ML trees, using RAG1 and COI datasets, showed division of the two clades, which was observed in the mitogenome trees. BI and ML trees, based on RAG1, obtained four clades with the clade including the genera Micronemacheilus, Oreonectes, and Lefua exhibiting relatively low supported values (Figure 3). The relationships among all four clades were not resolved because of comparatively low supported values. This might have been due to the lack of sufficient variable sites. Phylogenetic trees using COI sequences did not show a credible split of clades because relatively low supported values were obtained in most of the nodes (Figure 4).
Figure 3.

Maximum likelihood tree for 57 Nemacheilidae species based on RAG1 sequences. Numbers near branches indicate bootstrap proportions and Bayesian posterior probabilities from maximum likelihood analysis and Bayesian inferences, respectively
Figure 4.

Maximum likelihood tree for 150 Nemacheilidae species based on COI sequences. Numbers near branches indicate bootstrap proportions and Bayesian posterior probabilities from maximum likelihood analysis and Bayesian inferences, respectively (supported values are only shown in some nodes)
The RAG1 and COI analyses also showed that several genera were not monophyletic. In RAG1 trees (Figure 3), Claea dabryi and Schistura savona were nested within the genus Triplophysa and the genus Acanthocobitis, respectively. Oxynoemacheilus gyndes first clustered with Seminemacheilus lendlii and then was sister to Oxynoemacheilus hane. Acanthocobitis pavonacea first clustered with Indoreonectes and then was sister to the clade containing Schistura savona and two Acanthocobitis species (Figure 3). Representative species from Yunnanilus and Nemacheilus were nested within genus Schistura. More importantly, species of genus Schistura were found in two highly supported clades. Though the supported values at most nodes in the COI analyses were comparatively low (Figure 4), some genera did not generate reciprocal monophyly. For example, Claea dabryi and Triplophysa anterodorsalis formed a clade that was sister to other Triplophysa species. Schistura maculosa clustered with genus Indoreonectes. An unidentified Acanthocobitis species and genus Paracanthocobitis grouped into a clade that was sister to other Acanthocobitis species, and Nemacheilus denisoni nested within Schistura.
3.4. Species distributions
Because the phylogenetic topologies utilizing RAG1 and COI datasets were not well resolved, we used species map distributions based on species that had mitogenome sequences (Figure 5). The map suggested a majority of species from clade I were located in South Asia, Southeast Asia, West Asia and the Middle East. Most species in clade II were distributed in East Asia, Europe and the Far East. A few exceptions were found in Iran (Locality 3), Tarim in China (Locality 10), and Thailand (Locality 24). These locations had species that were located in both major clades (Figure 5; Table S1).
Figure 5.

Map showing species distributions of 58 Nemacheilidae species used in the mitogenome analyses. Black and blue dots indicate distribution ranges of species within clade I and species within clade II, respectively. Red dots show distribution ranges of species detected in both clades. Localities of each species are detailed in Table S1. HD, Hengduan Mountains; IP, Iran Plateau; QTP, Tibetan Plateau
4. DISCUSSION
4.1. Comparisons between molecular phylogenies and morphological classifications
Nemacheilidae contains many morphologically similar species and taxonomic problems exist at species and genus levels (Nalbant & Bianco, 1998; Tang et al., 2006). We studied the phylogenetic positions of several species and genera by analyzing the mitogenome sequences of RAG1 and COI.
Three species, Yunnanilus brevis, Nemacheilus triangularis, and Oxynoemacheilus angorae, were nested within the Schistura clade inferred from mitogenome analyses, though support values were relatively low based on ML trees (Figure 2). RAG1 analyses showed that Y. brevis and three Nemacheilus species (N. triangularis, N. guentheri, and N. rueppelli) were nested within the Schistura species complex. Yunnanilus brevis, within the Schistura clade, was also examined by Sgouros (2016). The present findings also challenged the monophyly of Schistura. Although the abovementioned species currently are placed in different genera, they were once considered to be in Nemacheilus, as well as the Schistura species (http://www.fishbase.com). This suggests that earlier studies on Schistura, Nemacheilus, Oxynoemacheilus, or Yunnanilus found insufficient morphological evidence to support the recognition of these genera as a natural grouping. Some genera within the Nemacheilidae, for example Schitura, have many species that are difficult to delimit due to the absence of stable morphological characters (Bǎnǎrescu & Nalbant, 1995). Future morphological studies should consider using our phylogenetic data for species differentiation.
Three Nemacheilus species in this study segregated into two different subclades within clade I (Figure 2). A similar pattern was seen in the RAG1 analyses. N. triangularis and N. guentheri are a valid name in the FishBase database (http://www.fishbase.com), but researchers have used Mesonoemacheilus triangularis and M. guentheri in their studies (Anoop, Dahanukar, Ali, & Raghavan, 2017; Raghavan, Prasad, Ali, & Pereira, 2008; Slechtova, Bohlen, & Tan, 2007). Consequently, we propose that N. triangularis and N. guentheri belong in Mesonoemacheilus.
Claea dabryi nested with Triplophysa species based on three molecular datasets. This was consistent with the work of Liu et al. (2012) and Li, Yang, Si, Zhang, and Song (2016). The position of C. dabryi indicated that this is a young species (1.37 Ma; not shown in Figure 2) derived from Triplophysa species, and challenged the monophyly of genus/subgenus Triplophysa supported by He, Chen, and Chen (2006) and Wang et al. (2016).
Our study shows that Oreonectes does not form monophyletic clade. Oreonectes furcocaudalis formed a clade with Lefua, whereas Oreonectes platycephalus generated another clade with Yunnanilus cruciatus. Previous phylogenetic studies on Nemacheilidae species did not recognize this phylogenetic pattern because they included only a limited number of species from Lefua and Oreonectes and did not contain Yunnanilus species (Liu et al., 2012, 2010; Tang et al., 2006). The diagnostic morphological difference between Oreonectes and Lefua is that Lefua has a vertical and brown line from mouth to the base of tail fin, whereas Oreonectes lack this line (Zhu, 1989). Oreonectes and Yunnanilus differ in their head shape and the length of fistuliform prominence of the anterior nares (Zhu, 1989). The morphological differences and nonmonophyletic clade indicate that Oreonectes may not have an exclusive origin. Further study of this classification is needed by examining more Oreonectes species and additional morphological and molecular characters. RAG1 and COI analyses did not provide relevant evidence due to the absence of Oreonectes furcocaudalis and low supported values.
Evidence for paraphyly in Oxynoemacheilus and Acanthocobitis was inferred from RAG1 and/or COI analyses (Figures 3 and 4). Trees using RAG1 and COI with individual Oxynoemacheilus species shared a clade with Seminemacheilus species. Stoumboudi, Kottelat, and Barbieri (2006) and Prokofiev (2009) placed most Nemacheilidae from Eastern Europe and the Middle East into the genus Oxynoemacheilus, including the genus Seminemacheilus. This suggested that Oxynoemacheilus or Seminemacheilus lacked sufficient morphological evidence to separate the two genera. A similar pattern occurred in Acanthocobitis, Indoreonectes, and Paracanthocobitis. They were placed in the genus Nemacheilus (http://www.fishbase.com). This phylogenetic pattern might be due to the uncertain division between these genera.
Schistura species fell into two major clades based on mitogenomic data. In addition to the phylogenetic position of the Schistura clade within clade I, polyphyly of Schistura was verified based on a larger dataset. Schistura species formed two independent clades in the RAG1 topologies as well. In addition, many species from other genera nested within the Schistura species complex and individual Schistura species (e.g., S. savona and S. maculosa) nesting within other genera are indicative of the polyphyly of Schistura. The polyphyly of Schistura has been noted in other studies (Liu et al., 2012, 2010; Nalbant & Bianco, 1998; Sgouros, Page, Orlofske, & Jadin, 2019; Tang et al., 2006). For example, Tang et al. (2006) reported two paraphyletic clades based on two mtDNA gene fragments. Liu et al. (2012) found two paraphyletic clades based on two mitochondrial gene sequences and four nuclear gene segments. Siva et al. (2017) detected two paraphyletic clades based on the entire mitochondrial genome. Schistura has 200 known species and occupies a vast geographical range. It has considerable morphological diversity which increases the difficulty of accurate species identification. We believe that Schistura should be divided into at least two genera. Additional studies are needed to identify rigorous synapomorphies for the two hypothetic genera based on molecular characters. A similar pattern was found in Yunnanilus (Figure 2). Yunnanilus brevis was regarded as a synonym of Eonemachilus brevis and Nemacheilus brevis, and Yunnanilus cruciatus was treated as a synonym of Nemacheilus cruciatus and Micronemacheilus cruciatus. This suggests that the genus‐level classification of these two species is problematic. The phylogenetic relationships seen in the current study suggests that the two species belong in different genera. Additional Yunnanilus species are needed to resolve the complex relationships within this genus.
The phylogenetic relationships of many species and genera may not be consistent with the traditional morphological subdivision of the Nemacheilidae. Many taxonomic problems exist in this family. More work on morphological traits and phylogenetic inferences should be done to understand the complicated relationships within the Nemacheilidae. The present study provides useful information for future researches.
4.2. Diversification related to the uplift of the Tibetan Plateau
The Nemacheilidae consist of two highly supported clades (I and II). Members of clade I primarily reside in India and central Asia, and members of clade II are mainly distributed in East Asia, Tibetan Plateau, and Europe (Figure 3). Tibetan Plateau, Hengduan Mountains, and Iran Plateau seem to form a boundary between the two clades. Molecular dating indicates that the Nemacheilidae diversified at 36.05 Ma (23.00–51.09 Ma), suggesting that the two clades separated sometime during the Late Eocene and the Oligocene. This phase broadly agrees with the first upliftment of the Tibetan Plateau (~40 Ma), accompanied by the rise of high mountains, the shaping of many river networks, and a greatly modified physiognomy of the plateau and adjacent regions (Chung et al., 1998; Rowley & Currie, 2006). These new mountains and river networks became geographic barriers and diversification reservoirs for Nemacheilidae species, resulting in differentiation. Similar effects have been reported for Asiatic salamanders (Zhang et al., 2006). Thus, the geological history of the Tibetan Plateau appears to be responsible for driving the diversification of Nemacheilidae taxa.
CONFLICT OF INTEREST
All authors declare that they have no competing interests.
AUTHORS' CONTRIBUTIONS
WC and XL designed the research and WC wrote the manuscript. JY and YL performed sampling. All authors read and approved the final manuscript.
Supporting information
ACKNOWLEDGMENTS
This study was financially supported by the Scientific Observing and Experimental Station of Fishery Resources and Environment in the Middle and Lower Reaches of Pearl River, Ministry of Agriculture and Rural Affairs of the People's Republic of China (Nos. 2018) and the Natural Science Foundation of Guizhou Province (Qiankehejichu [2018]1169). We thank LetPub (http://www.letpub.com) for its linguistic assistance during the revision of this manuscript.
Chen W, Yang J, Li Y, Li X. Exploring taxonomic diversity and biogeography of the family Nemacheilinae (Cypriniformes). Ecol Evol. 2019;9:10343–10353. 10.1002/ece3.5553
DATA AVAILABILITY STATEMENT
DNA sequences have been deposited in GenBank under Accession numbers KY404236, MK361215, and MN062061–MN062062. Details regarding individual samples are available in Table S1.
REFERENCES
- An, Z. S. , Kutzbach, J. E. , Prell, W. L. , & Porter, S. C. (2001). Evolution of Asian monsoons and phased uplift of the Himalayan Tibetan plateau since Late Miocene times. Nature, 411, 62–66. [DOI] [PubMed] [Google Scholar]
- Anoop, V. , Dahanukar, N. , Ali, A. , & Raghavan, R. (2017). Taxonomy of the zodiac loaches, Mesonoemacheilus triangularis, M. tambaraparniensis and M. periyarensis, endemic to the Western Ghats of India (Teleostei: Nemacheilidae). Zootaxa, 4341, 124–134. 10.11646/zootaxa.4341.1.11 [DOI] [PubMed] [Google Scholar]
- Bǎnǎrescu, P. M. , & Nalbant, T. T. (1995). A generical classification of Nemacheilinae with description of two new genera (Teleostei: Cypriniformes: Cobitidae). Travaux du Mus d'Hist "Nat Grigore Antipa", 35, 429–496. [Google Scholar]
- Bankevich, A. , Nurk, S. , Antipov, D. , Gurevich, A. A. , Dvorkin, M. , Kulikov, A. S. , … Pevzner, P. A. (2012). SPAdes: A new genome assembly algorithm and its applications to single‐cell sequencing. Journal of Computational Biology, 19, 455–477. 10.1089/cmb.2012.0021 [DOI] [PMC free article] [PubMed] [Google Scholar]
- Bohlen, J. , & Lechtova, V. (2009). Phylogenetic position of the fish genus Ellopostoma (Teleostei: Cypriniformes) using molecular genetic data. Ichthyological Exploration of Freshwaters, 20, 157. [Google Scholar]
- Chung, S.‐L. , Lo, C.‐H. , Lee, T.‐Y. , Zhang, Y. , Xie, Y. , Li, X. , … Wang, P.‐L. (1998). Diachronous uplift of the Tibetan plateau starting 40 Myr ago. Nature, 394, 769 10.1038/29511 [DOI] [Google Scholar]
- Drummond, A. J. , Ho, S. Y. , Phillips, M. J. , & Rambaut, A. (2006). Relaxed phylogenetics and dating with confidence. PLoS Biololgy, 4, 699–710. 10.1371/journal.pbio.0040088 [DOI] [PMC free article] [PubMed] [Google Scholar]
- Drummond, A. J. , & Rambaut, A. (2007). BEAST: Bayesian evolutionary analysis by sampling trees. BMC Evolutionary Biology, 7, 214 10.1186/1471-2148-7-214 [DOI] [PMC free article] [PubMed] [Google Scholar]
- Du, L. N. , Chen, X. Y. , & Yang, J. X. (2008). A review of the Nemacheilinae genus Oreonectes Günther with descriptions of two new species (Teleostei: Balitoridae). Zootaxa, 1729, 23–36. [Google Scholar]
- Edgar, R. C. (2004). MUSCLE: Multiple sequence alignment with high accuracy and high throughput. Nucleic Acids Research, 32, 1792–1797. 10.1093/nar/gkh340 [DOI] [PMC free article] [PubMed] [Google Scholar]
- Erk‐Akan, F. , Nalbant, T. T. , & Zeren, S. C. (2012). Seven new species of Barbatula, three new species of Schistura and a new species of Seminemacheilus (Ostariophysi: Balitoridae: Nemacheilinae) from Turkey. Journal of Fisheries International, 2, 69–85. [Google Scholar]
- Eschmeyer, W. N. , & Fong, J. D. (2015). Species by family/subfamily in the catalog of fishes. San Francisco, CA: California Academy of Sciences. [Google Scholar]
- He, D. K. , Chen, Y. X. , & Chen, Y. F. (2006). Molecular phylogeny and biogeography of the genus Triplophysa (Osteichthyes: Nemacheilinae) in the Tibetan Plateau inferred from cytochrome b DNA sequences. Progress in Natural Science, 16, 1395–1404. [Google Scholar]
- Hu, Y. T. , & Zhang, E. (2010). Homatula pycnolepis, a new species of nemacheiline loach from the upper Mekong drainage, South China (Teleostei: Balitoridae). Ichthyological Exploration of Freshwaters, 21, 51–62. [Google Scholar]
- Jamshidi, S. , Abdoli, A. , Sherafatian, M. , & Golzarianpour, K. (2013). Analysis of mitochondrial DNA sequences of Turcinoemacheilus genus (Nemacheilidae: Cypriniformes) in Iran. Iranian Journal of Fisheries Sciences, 12, 592–604. [Google Scholar]
- Kosygin, L. (2012). Aborichthys waikhomi, a new species of fish (Teleostei: Nemacheilidae) from Arunachal Pradesh, India. Recods of Zoological Survey of India, 112, 49–55. [Google Scholar]
- Kottelat, M. (2012). Conspectus cobitidum: An inventory of the loaches of the world (Teleostei: Cypriniformes: Cobitoidei). Raffles Bulletin of Zoology, 26, 1–99. [Google Scholar]
- Lanfear, R. , Calcott, B. , Ho, S. Y. W. , & Guindon, S. (2012). PartitionFinder: Combined selection of partitioning schemes and substitution models for phylogenetic analyses. Molecular Biology and Evolution, 29, 1695–1701. 10.1093/molbev/mss020 [DOI] [PubMed] [Google Scholar]
- Li, J. , Yang, K. , Si, S. , Zhang, X. , & Song, Z. (2016). Complete mitochondrial genome of Triplophysa bleekeri (Cypriniformes: Balitoridae: Nemacheilinae), and analysis of mitochondrial genetic variability among Triplophysa species. Mitochondrial DNA, 27, 4132–4133. [DOI] [PubMed] [Google Scholar]
- Liu, S.‐Q. , Mayden, R. L. , Zhang, J.‐B. , Yu, D. , Tang, Q.‐Y. , Deng, X. , & Liu, H.‐Z. (2012). Phylogenetic relationships of the Cobitoidea (Teleostei: Cypriniformes) inferred from mitochondrial and nuclear genes with analyses of gene evolution. Gene, 508, 60–72. 10.1016/j.gene.2012.07.040 [DOI] [PubMed] [Google Scholar]
- Liu, S. Q. , Zhang, J. B. , Tang, Q. Y. , & Liu, H. Z. (2010). Phylogenetic relationships among Cobitoidea based on mitochondrial ND4 and ND5 gene sequences. [Abstract in English]. Zoological Research, 31, 221–229. [DOI] [PubMed] [Google Scholar]
- Luo, R. , Liu, B. , Xie, Y. , Li, Z. , Huang, W. , Yuan, J. , … Wang, J. (2012). SOAPdenovo2: An empirically improved memory‐efficient short‐read de novo assembler. Gigascience, 1, 18 10.1186/2047-217X-1-18 [DOI] [PMC free article] [PubMed] [Google Scholar]
- Manabe, S. , & Broccoli, A. (1990). Mountains and arid climates of middle latitudes. Science, 247, 192–195. 10.1126/science.247.4939.192 [DOI] [PubMed] [Google Scholar]
- Min, R. , Chen, X. Y. , Yang, J. X. , Winterbottom, R. , & Mayden, R. L. (2012). Phylogenetic relationships of the genus Homatula (cypriniformes: Nemacheilidae), with special reference to the biogeographic history around the Yunnan‐Guizhou Plateau. Zootaxa, 78–94. 10.11646/zootaxa.3586.1.9 [DOI] [Google Scholar]
- Nalbant, T. , & Bianco, G. (1998). The loaches of Iran and adjacent regions with description of six new species (Cobitoidea). Italian Journal of Zoology, 65, 109–123. 10.1080/11250009809386803 [DOI] [Google Scholar]
- Nylander, J. (2004). MrModeltest v2. Program distributed by the author. Uppsala, Sweden: Evolutionary Biology Centre, Uppsala University. [Google Scholar]
- Patel, R. K. , & Jain, M. (2012). NGS QC Toolkit: A toolkit for quality control of next generation sequencing data. PLoS ONE, 7, e30619 10.1371/journal.pone.0030619 [DOI] [PMC free article] [PubMed] [Google Scholar]
- Prokofiev, A. M. (2009). Problems of the classification and phylogeny of nemacheiline loaches of the group lacking the preethmoid I (Cypriniformes: Balitoridae: Nemacheilinae). Journal of Ichthyology, 49, 874 10.1134/S0032945209100051 [DOI] [Google Scholar]
- Raghavan, R. , Prasad, G. , Ali, P. A. , & Pereira, B. (2008). Fish fauna of Chalakudy River, part of Western Ghats biodiversity hotspot, Kerala, India: Patterns of distribution, threats and conservation needs. Biodiversity Conservation, 17, 3119–3131. 10.1007/s10531-007-9293-0 [DOI] [Google Scholar]
- Rambaut, A. , & Drummond, A. (2007). Tracer v1.4. Retrieved from http://tree.bio.ed.ac.uk/tracer [Google Scholar]
- Ronquist, F. , & Huelsenbeck, J. P. (2003). MrBayes 3: Bayesian phylogenetic inference under mixed models. Bioinformatics, 19, 1572–1574. 10.1093/bioinformatics/btg180 [DOI] [PubMed] [Google Scholar]
- Rowley, D. B. , & Currie, B. S. (2006). Palaeo‐altimetry of the late Eocene to Miocene Lunpola basin, central Tibet. Nature, 439, 677 10.1038/nature04506 [DOI] [PubMed] [Google Scholar]
- Ruddiman, W. (1998). Geology: Early uplift in Tibet? Nature, 394, 723 10.1038/29401 [DOI] [Google Scholar]
- Sgouros, K. (2016). A revised molecular phylogeny reveals polyphyly in Schistura (teleostei: Cypriniformes: Nemacheilidae). Chicago, IL: Northeastern Illinois University. [DOI] [PubMed] [Google Scholar]
- Sgouros, K. , Page, L. M. , Orlofske, S. A. , & Jadin, R. C. (2019). A revised molecular phylogeny reveals polyphyly in Schistura (Teleostei: Cypriniformes: Nemacheilidae). Zootaxa, 4559, 349–362. 10.11646/zootaxa.4559.2.8 [DOI] [PubMed] [Google Scholar]
- Siva, C. , Kumar, R. , Sharma, L. , Laskar, M. A. , Sumer, S. , Barat, A. , & Sahoo, P. K. (2017). The complete mitochondrial genome of a stream loach (Schistura reticulofasciata) and its phylogeny. Conservation Genetics Resources, 10, 829–832. [Google Scholar]
- Slechtova, V. , Bohlen, J. , & Tan, H. H. (2007). Families of Cobitoidea (Teleostei; Cypriniformes) as revealed from nuclear genetic data and the position of the mysterious genera Barbucca, Psilorhynchus, Serpenticobitis and Vaillantella. Molecular Phylogenetics and Evolution, 44, 1358–1365. 10.1016/j.ympev.2007.02.019 [DOI] [PubMed] [Google Scholar]
- Stamatakis, A. (2006). RAxML‐VI‐HPC: Maximum likelihood‐based phylogenetic analyses with thousands of taxa and mixed models. Bioinformatics, 22, 2688–2690. 10.1093/bioinformatics/btl446 [DOI] [PubMed] [Google Scholar]
- Stoumboudi, M. , Kottelat, M. , & Barbieri, R. (2006). The fishes of the inland waters of Lesbos Island, Greece. Ichthyological Exploration of Freshwaters, 17, 129. [Google Scholar]
- Tang, Q. , Liu, H. , Mayden, R. , & Xiong, B. (2006). Comparison of evolutionary rates in the mitochondrial DNA cytochrome b gene and control region and their implications for phylogeny of the Cobitoidea (Teleostei: Cypriniformes). Molecular Phylogenetics and Evolution, 39, 347–357. 10.1016/j.ympev.2005.08.007 [DOI] [PubMed] [Google Scholar]
- Tapponnier, P. , Zhiqin, X. , Roger, F. , Meyer, B. , Arnaud, N. , Wittlinger, G. , & Jingsui, Y. (2001). Oblique stepwise rise and growth of the Tibet Plateau. Science, 294, 1671–1677. 10.1126/science.105978 [DOI] [PubMed] [Google Scholar]
- Wang, Y. , Shen, Y. , Feng, C. , Zhao, K. , Song, Z. , Zhang, Y. , … He, S. (2016). Mitogenomic perspectives on the origin of Tibetan loaches and their adaptation to high altitude. Scientific Reports, 6, 29690 10.1038/srep29690 [DOI] [PMC free article] [PubMed] [Google Scholar]
- Xia, X. (2013). DAMBE5: A comprehensive software package for data analysis in molecular biology and evolution. Molecular Biology and Evolution, 30, 1720–1728. 10.1093/molbev/mst064 [DOI] [PMC free article] [PubMed] [Google Scholar]
- Xia, X. , & Lemey, P. (2009). Assessing substitution saturation with DAMBE In Lemey P., Salemi M., & Vandamme A. M. (Eds.), The phylogenetic handbook (vol. 2, pp. 615–630). Cambridge, UK: Cambridge University Press. [Google Scholar]
- Yin, A. , & Harrison, T. M. (2000). Geologic evolution of the Himalayan‐Tibetan orogen. Annual Review of Earth and Planetary Sciences, 28, 211–280. 10.1146/annurev.earth.28.1.211 [DOI] [Google Scholar]
- Zhang, P. , Chen, Y.‐Q. , Zhou, H. , Liu, Y.‐F. , Wang, X.‐L. , Papenfuss, T. J. , … Qu, L.‐H. (2006). Phylogeny, evolution, and biogeography of Asiatic Salamanders (Hynobiidae). Proceedings of the National Academy of Sciences of the United States of America, 103, 7360–7365. 10.1073/pnas.0602325103 [DOI] [PMC free article] [PubMed] [Google Scholar]
- Zheng, L. P. , Du, L. N. , Chen, X. Y. , & Yang, J. X. (2009). A new species of Genus Triplophysa (Nemacheilinae: Balitoridae), Triplophysa longipectoralis sp. nov, from Guangxi, China. Environmental Biology of Fishes, 85, 221–227. 10.1007/s10641-009-9485-4 [DOI] [Google Scholar]
- Zhu, S. Q. (1989). Chinese nemacheilinae. Nanjing, China: Jiangsu Science and Technology Press. [Google Scholar]
Associated Data
This section collects any data citations, data availability statements, or supplementary materials included in this article.
Supplementary Materials
Data Availability Statement
DNA sequences have been deposited in GenBank under Accession numbers KY404236, MK361215, and MN062061–MN062062. Details regarding individual samples are available in Table S1.