Abstract
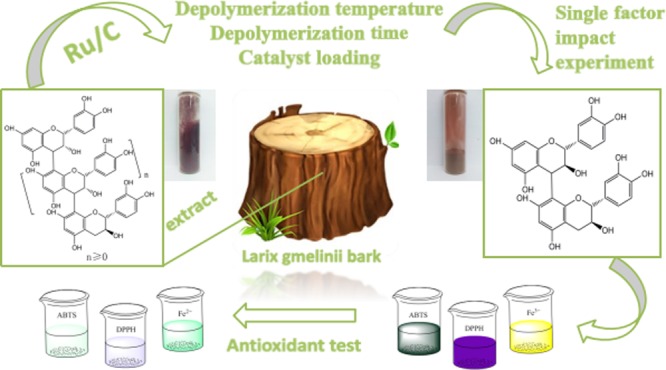
A new method has been developed for the high-value utilization of larch bark, which is regarded as a low-value byproduct of the logging industry. Polymeric proanthocyanidins (PPCs) were extracted from the Larix gmelinii bark and depolymerized by catalytic hydrogenolysis, using ruthenium/carbon (Ru/C) as the catalyst. The method has been found that although the molecular weight of the depolymerized product was significantly lower, the basic structural units were not destroyed, and the product retained a condensed flavanol polyphenol structure; the depolymerized product contains very little Ru metal and thus complies with food safety standards; the antioxidant properties of both the depolymerized products and PPCs were better than those of the commonly used antioxidant 2,6-di-tert-butyl-4-methylphenol. The relative molecular weight and steric hindrance of the depolymerized products were lower than those of the PPCs, leading to better antioxidant performance. A new technical route for the depolymerization of PPCs from the L. gmelinii bark is provided. The route offers practical and commercial advantages, and the product could have many applications as an antioxidant.
1. Introduction
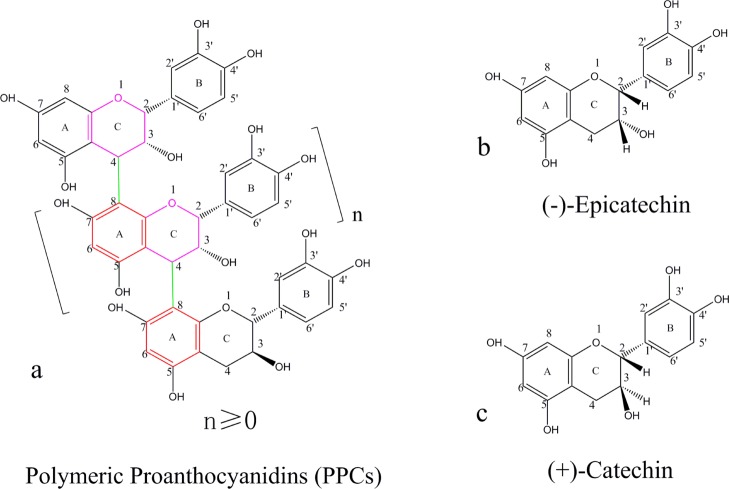
Larix gmelinii (Rupr.) Kuzen., a member of the Pinaceae family, is the principal tree species of coniferous forests in China’s Greater and Lesser Xing’an Mountains, Changbai Mountains, Tianshan Mountains, and Yunnan Mountains and is also wide spread in the Siberian region of Russia.1 During the cutting and processing of L. gmelinii in these regions, bark and branches, which account for 8–15% of the volume of the logs and can amount to 94 000 tons per year, are typically viewed as a low-value resource and used as fuel.2 The L. gmelinii bark does, however, contain potentially useful phenolic compounds, including polymeric proanthocyanidins (PPCs), which can account for 10–16% of the bark weight, together with gallic acid, protocatechuic acid, and vanillic acid.3 PPCs contain 9–10 sub units of catechin and epicatechin.4 The molecular structure of PCCs from the L. gmelinii bark is shown in Figure 1a. The PCCs, which contain (−)-epicatechin (Figure 1b) and (+)-catechin (Figure 1c) structural units,5 have an average molecular weight of about 2800 and an average polymerization degree of 9–10.6 The ratio of 2,3-cis ((−)-epicatechin) to 2,3-trans ((+)-catechin) sub units is about 6:4.7
Figure 1.
Molecular structure of PPCs from the L. gmelinii bark (a) PPCs; (b) (−)-epicatechin; (c) (+)-catechin.
PPCs with polymerization degree >5 account for about 70% of the total mass of phenolic compounds from the L. gmelinii bark.8 Because of their high polymerization degree and high molecular weight, these PPCs are unable to penetrate biological membranes effectively, limiting both their biological activity and range of applications.9 Shorter oligomers (dimers, trimers, and tetramers), which are often referred to as oligomeric proanthocyanidins (OPCs),4 are powerful antioxidants and very efficient free-radical scavengers. OPCs have been reported to have protective or preventative functions in eye disease, aging, cancer, and cardiovascular and cerebrovascular diseases.1,3,6 Because of this, they potentially have many applications in fields including medicines, cosmetics, and health foods.10−12 The ability to depolymerize PPCs into OPCs would thus improve their value and is an important research objective.
At present, depolymerization of PPCs is mostly carried out using either microbial or chemical methods. Research into microbial depolymerization has focused largely on screening transformed strains of microorganisms.13 The transformation products of these reactions are, however, highly uncertain and it is difficult to obtain oligomers with a specific polymerization degree. Conditions for chemical depolymerization have been extensively studied.14 Depolymerization requires cleavage of the C4–A8 bond (see Figure 1), which can be broken by metal-catalyzed hydrogenolysis, using metals such as Pd, Ni, Fe, and Pt. Although Pd-catalyzed hydrogenolysis, especially, has been shown to cleave the C4–A8 bond in high yield, giving easily separable products,15 the high cost of Pd is a problem. Deng et al.16 have found that Ru, another group VIII metal that is much cheaper than Pd, can also catalyze hydrogenolysis of C–C bonds. The ability to use Ru as the catalyst for depolymerization of PPCs from the L. gmelinii bark would, therefore, be of both practical and commercial significance.
Here, the reaction conditions for 5% Ru/C-catalyzed depolymerization of PPCs from the L. gmelinii bark, including temperature, time, and catalyst loading, were optimized. The depolymerization products were characterized by UV–vis, Fourier-transform infrared (FTIR), and 1H NMR spectroscopy, as well as gel permeation chromatography (GPC), and their antioxidant properties were measured. Levels of Ru metal in the depolymerization products were determined by X-ray photoelectron spectroscopy (XPS) and inductively coupled plasma mass spectrometry (ICP-MS). A technical basis for the low-cost depolymerization and exploitation of PPCs from the L. gmelinii bark has been provided, and ways to improve the value of an undervalued resource have also been explored.
2. Results and Discussion
2.1. Proposed Mechanism of Catalytic Depolymerization of PPCs
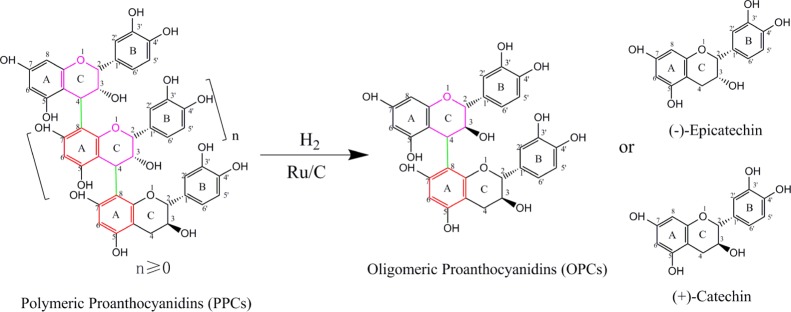
In typical molecules of L. gmelinii bark PPCs, the inductive effect of the hydroxyl group at the 3-position of the C-ring reduces the density of the electron cloud on the C-ring. This leads to a partial positive charge at the 4-position and formation of an electrophilic center. The hydroxyl groups at the 5- and 7-positions of the A-ring have unshared lone pairs on the oxygen atoms, which form a p−π conjugated system with the π electrons of the benzene ring. The conjugation effect dominates, and the electron cloud shifts to the benzene ring. The electron cloud density on the benzene ring is increased to a greater extent at the position para to the hydroxyl group (8-position) than at the position ortho to the hydroxyl group (4-position). The 8-position on the A-ring is thus strongly negatively charged, forming a nucleophilic center. Under the conditions of catalytic hydrogenolysis, the C4–A8 bond is easily broken42 and the PPCs are depolymerized to give OPCs, together with catechin/epicatechin. The proposed mechanism is shown in Figure 2.
Figure 2.
Diagram showing proposed mechanism of Ru-catalyzed depolymerization of PPCs from the L. gmelinii bark.
2.2. Optimization of Hydrogenolysis Conditions
2.2.1. Effect of Temperature
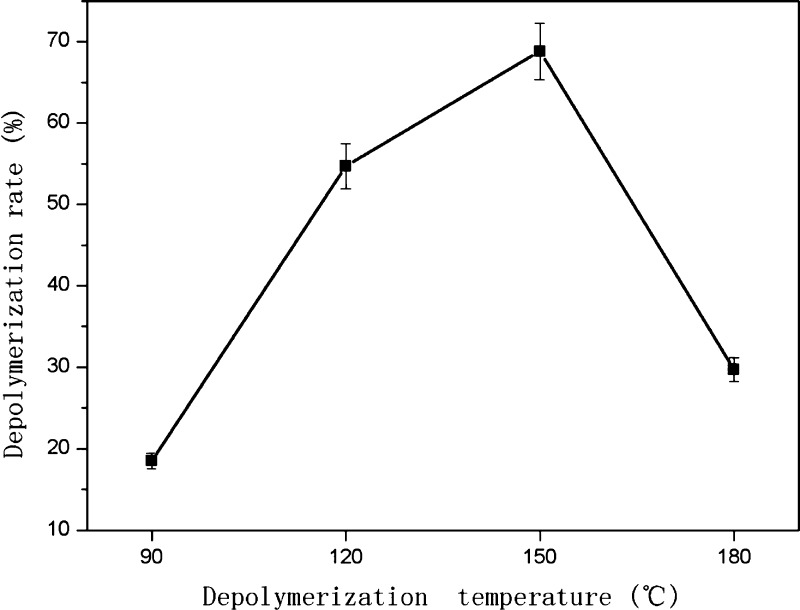
C–C bonds are generally high energy bonds and cleavage requires catalyst, high temperature, and high pressure or other harsh conditions. The depolymerization reaction was, therefore, carried out under 3 MPa hydrogen, with a Ru/C loading of 1.5% (g/mL), at 90, 120, 150, or 180 °C for 1 h. The effect of temperature on the depolymerization rate of PPCs is shown in Figure 3.
Figure 3.
Effect of temperature on the depolymerization rate of PPCs (3 MPa hydrogen, 500 rpm stirring, reaction time of 1 h, and 1.5% catalyst loading).
The depolymerization rate of PPCs first increased and then decreased, with increasing temperature. The depolymerization rate was highest (68.8%) at 150 °C. When the depolymerization temperature is lower than 150 °C, there is insufficient energy to break all the C4–A8 bonds. As the temperature increases, the number of broken chemical bonds and the depolymerization rate increase. When the temperature increases above 150 °C, however, the structural units of the OPCs or monomers may be damaged, resulting in an apparent decrease in the depolymerization rate. At the same time, the depolymerization product is accompanied by a polymerization reaction, resulting in a further reduction in the depolymerization rate. Overall, the best temperature for depolymerization of PPCs was found to be 150 °C.
2.2.2. Effect of Reaction Time
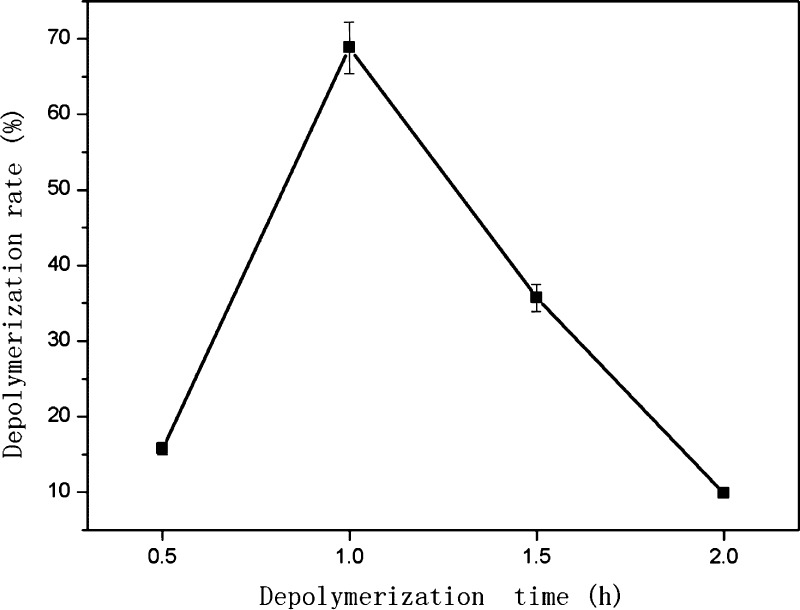
Reaction times of 0.5, 1, 1.5, and 2 h were investigated using 3 MPa hydrogen, a Ru/C loading of 1.5% (g/mL), and a reaction temperature of 150 °C. The effect of reaction time on the depolymerization rate of PPCs is shown in Figure 4.
Figure 4.
Effect of reaction time on depolymerization rate of PPCs (3 MPa hydrogen, 500 rpm stirring, 150 °C, and 1.5% catalyst loading).
The depolymerization rate of PPCs first increased and then decreased, with increasing reaction time. The depolymerization rate was highest (68.8%) with a reaction time of 1 h. When the depolymerization time is less than 1 h, there is insufficient energy to break all of the C4–A8 bonds. As the reaction time is gradually extended, the number of broken chemical bonds and the depolymerization rate increase. As the reaction time is increased further, however, the OPC product or monomer units are destroyed, resulting in an apparent decrease in the depolymerization rate. Also the depolymerization product is also be accompanied by a polymerization reaction, resulting in a further reduction in the depolymerization rate. Overall, the best reaction time for depolymerization of PPCs was found to be 1 h.
2.2.3. Effect of Catalyst Loading
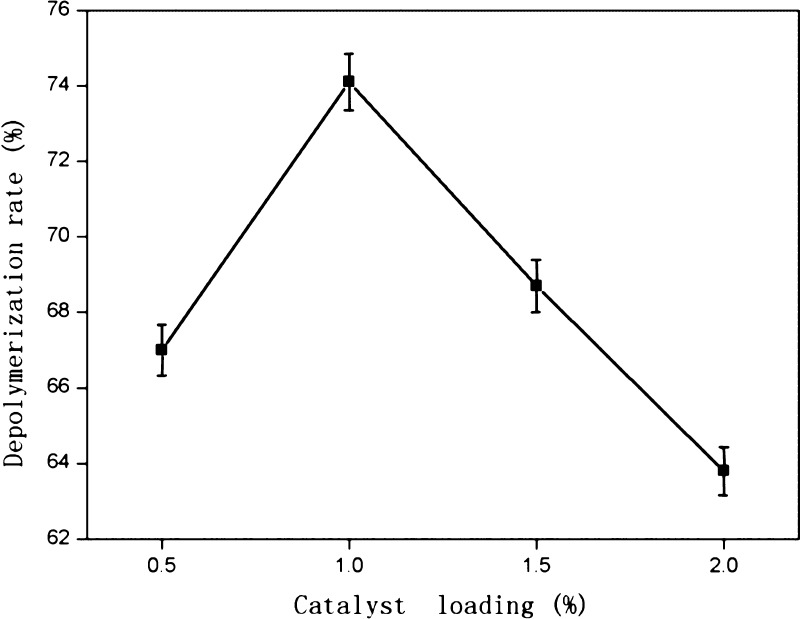
Ru/C loadings of 0.5, 1, 1.5 and 2% (g/mL) were investigated using a hydrogen pressure of 3 MPa, a reaction temperature of 150 °C, and a reaction time of 1 h. The effect of catalyst loading on the depolymerization rate of PPCs is shown in Figure 5.
Figure 5.
Effect of catalyst loading on the depolymerization rate of PPCs (3 MPa hydrogen, 500 rpm stirring, 1 h, and 150 °C).,
The depolymerization rate of PPCs first increased and then decreased, as the catalyst loading was increased. The depolymerization rate was highest (74.1%) with 1% catalyst loading.
During catalytic hydrogenolysis, H2, enters the liquid phase, is adsorbed onto the surface of the catalyst, and decomposes to H+ radicals under Ru catalysis. The newly formed H+ radicals then participate in the C4–A8 bond breaking reaction. When the catalyst loading is less than 1%, the contact area between the catalyst and the reaction system is small, and the amount of adsorbed H2 is small. Fewer H+ radicals are formed, and the reaction efficiency is low, resulting in less C4–A8 bond cleavage and a lower depolymerization rate. When the catalyst loading exceeds 1%, too many H+ radicals are formed, and a homogeneous system cannot be produced. Oligomers or monomers formed by depolymerization of the PPCs are destroyed, resulting in a low apparent depolymerization rate. Overall, the best catalyst loading for depolymerization of PPCs was found to be 1%.
Li et al.15 used Pd/C to catalyze the depolymerization of sorghum proanthocyanidins. Compared with Pd/C, a higher temperature was needed for depolymerization using Ru/C, but a lower catalyst loading and shorter reaction time were required. The depolymerization rate was improved by using Ru/C rather than Pd/C, demonstrating that the use of lower cost Ru/C for depolymerization of proanthocyanidins has an important practical value.
2.3. Structural Characterization of Proanthocyanidins
The OPCs described below were obtained using 3 MPa hydrogen, 150 °C, 1 h, and 1% (g/mL) catalyst loading.
2.3.1. Analysis of UV–Vis Absorption Spectra
The UV–vis absorption spectra of the PPCs, OPCs, and catechins are shown in Figure 6. The spectra of the PPCs, OPCs, and catechins all show large characteristic absorption peaks at 210 nm, together with smaller peaks at 280 nm. Taking into account the theory of UV absorption and the typical structural formula of proanthocyanidins, we have attributed the absorption peaks at 210 nm to the three conjugated double bonds of the benzene ring and those at 280 nm to the conjugated structure of the A- and B-rings of the proanthocyanidins. The peak intensity of PPCs at 280 nm is significantly lower than that of OPCs and catechin, indicating that the steric hindrance of PPCs is higher in the case of higher degree of polymerization, resulting in a benzene ring, and the conjugate effect is not obvious, so the peak intensity is weak. The degree of OPCs polymerization is low, similar to catechin, and the steric hindrance is small, and the conjugation effect is obvious, so the peak intensity is high.45
Figure 6.
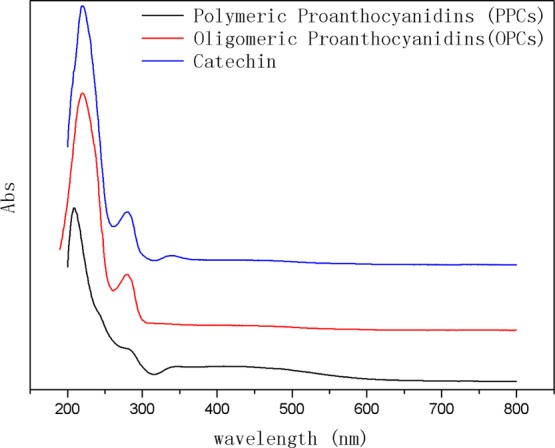
UV–vis absorption spectra of PPCs, OPCs, and catechins.
The UV–vis absorption spectrum of the OPCs is similar to that of the PPCs because both have a condensed flavanol polyphenol structure, with similar basic structural units. Because the basic structural units of both OPCs and PPCs are catechin and epicatechin, the spectra of the proanthocyanidins are also similar to that of catechin. The UV–vis absorption spectra clearly demonstrate that Ru/C-catalyzed depolymerization does not destroy the basic structural unit of proanthocyanidins.
2.3.2. Analysis of FTIR Spectra
The FTIR spectra of the PPCs and the OPCs are shown in Figure 7. The spectra are very similar, demonstrating that the main characteristic functional groups of the proanthocyanidins are unchanged by the depolymerization reaction. The strong absorption peak at 3389 cm–1 is caused by the stretching vibration associated with phenolic hydroxyl groups in the proanthocyanidin molecule, the absorption peak at 2920 cm–1 is caused by the antisymmetric stretching vibration of −CH2 groups, the four absorption peaks at 1600, 1580, 1500, and 1450 cm–1 are caused by ring breathing vibrations of the benzene ring skeleton C=C bonds, and the absorption peak at 1050 cm–1 is the stretching vibration peak of C–O–C groups. In the fingerprint region, the peaks at 920–980 cm–1 are bending vibrations of C–H bonds on the benzene ring, and the characteristic absorption peaks around 800 cm–1 are caused by out-of-plane deformation vibrations of unsaturated C–H bonds on the aromatic ring skeleton.
Figure 7.
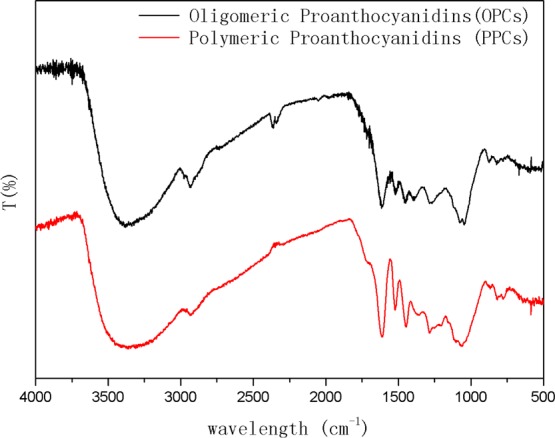
FTIR spectra of PPCs and OPCs.
The FTIR spectra of the PPCs and OPCs are very similar and show feature characteristic of condensed tannins, in agreement with theoretical predictions.9,43,44 The similarity of the FTIR spectra further demonstrates that the depolymerization reaction breaks the linkages between monomers but does not affect the basic structural units of the proanthocyanidins.
2.3.3. Analysis of 1H NMR Spectra
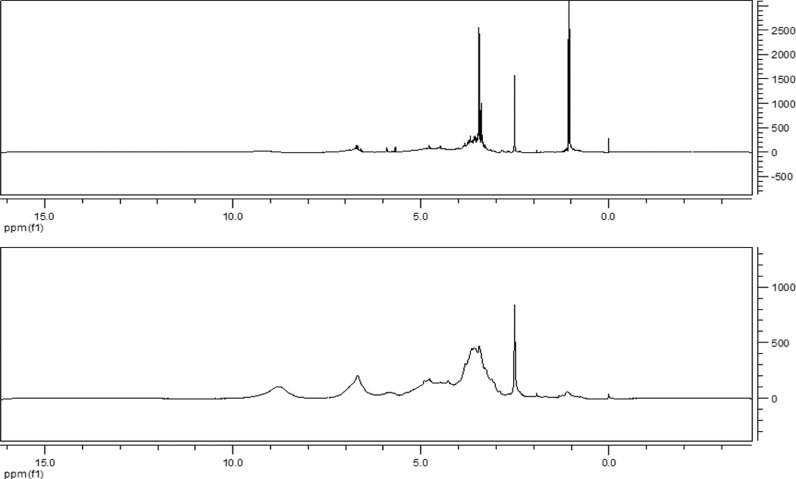
The 1H NMR spectra of the OPCs and PPCs are shown in Figure 8. The spectra indicate that both are polyphenols, with absorption peaks at 1.0 ppm (−CH3, −CH2), 2.5–2.6 ppm (Ar-OH), 3.5 ppm (−OCH3), 6.0–7.0 ppm (Ar-H), and 8.0–9.0 ppm (catechin phenolic OH).
Figure 8.
1H NMR spectra of OPCs (top) and PPCs (bottom).
The peak at 1.0 ppm (−CH3, −CH2) is much larger after depolymerization because C4–A8 linkages in the PPCs are broken, increasing the number of C–H bonds. This is consistent with the proposed mechanism for Ru/C-catalyzed depolymerization of L. gmelinii bark PPCs.
The intensity of the 8–9 ppm peak of OPC is decreased. The reason for the conjecture is related to the change of the degree of polymerization. PPCs belong to a mixture consisting of proanthocyanidins of different degrees of polymerization with an average degree of polymerization greater than 5. When depolymerization occurs, macromolecules in PPCs are destroyed into molecules with low degree of polymerization, while small molecules like catechin components are destroyed to form smaller molecules, and this result in a lower concentration of catechin phenolic OH in the OPCs in the spectrum than in PPCs. This result also confirms our conjecture that if the reaction time is too long or the temperature is too high, the proanthocyanidin molecules will be destroyed.
2.3.4. Determination of Molecular Weight of Proanthocyanidins
The molecular weight distribution curves of OPCs and PPCs are shown in Figure 9. The molecular weight distribution of the PPCs is mainly in the range 800–1800 g/mol, and the molecular weight distribution of the OPCs is mainly in the range 200–1400 g/mol. The molecular weight of the depolymerized product is significantly lower than that of PPCs, indicating that Ru/C has efficiently catalyzed the depolymerization reaction.
Figure 9.
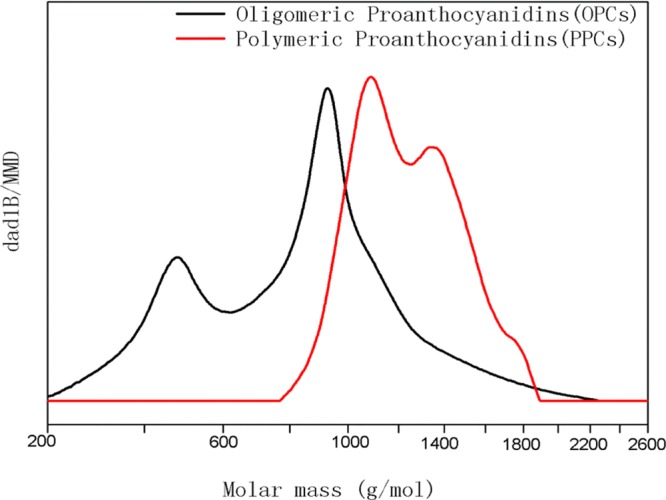
Molecular weight distribution of OPCs and PPCs determined by GPC.
2.3.5. Determination of the Ru Metal Content in OPCs by XPS and ICP–MS
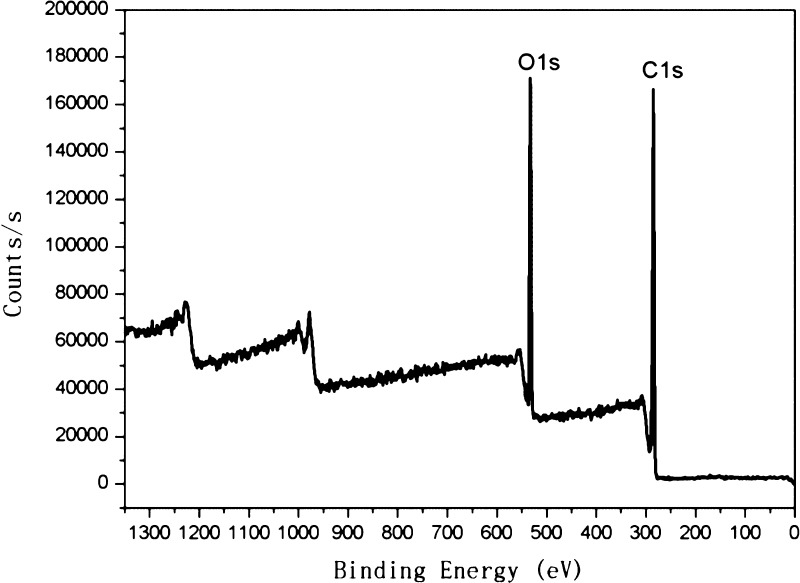
Heavy metal residues must be rigorously controlled in antioxidants for use in foods (NO 629/008, EU. GB 5009.12-2010, GB/T 5009.15-2003, GB/T 5009.17-2003, GB/T 5009.11-2003, GB/T 5009.16-2003, GB/T 5009.138-2003, GB/T 5009.123-2003, Chinese National Standard). Specifically, heavy metal content must be <0.2 mg/kg. The Ru metal content in OPCs was, therefore, determined by XPS and ICP-MS. The XPS spectrum of OPCs (Figure 10), shows only C and O, and no Ru metal was detected.
Figure 10.
XPS spectrum of OPCs.
The ICP-MS method, which has a lower detection limit than XPS, indicated that the Ru metal content of the OPCs is 0.105 mg/kg. The amount of Ru metal in the OPCs thus complies with international food standards, and the OPCs can be safely used as food additives.
2.4. Antioxidant Activity of Proanthocyanidins
The antioxidant activity of OPCs should be higher than that of PPCs because they are richer in phenolic hydroxyl groups. In this section, the antioxidant activities of OPCs and PPCs were compared with the antioxidant activity of the commonly used antioxidant 2,6-di-tert-butyl-4-methylphenol (BHT).
2.4.1. Reducing Ability
Reducing ability is an important indicator of antioxidant activity because stronger reducing ability is associated with greater antioxidant capacity. The Prussian blue method was used to measure the reducing ability of the proanthocyanidins because the phenolic hydroxyl groups and ortho hydrogen atoms of the proanthocyanidins can reduce Fe3+ to Fe2+ under certain conditions. The change in Fe3+ concentration thus reflects the reducing ability of the proanthocyanidins. As shown in Figure 11, the reducing ability of the OPCs increases with increasing mass concentration over the range 0.025–0.2 mg/mL. At a mass concentration of 0.2 mg/mL, the absorbance values of BHT, PPCs, and OPCs were 0.449, 0.557, and 1.013, respectively. Both the OPCs and PPCs thus have higher reducing ability than BHT, largely because of the powerful ability of the phenolic hydroxyl groups and ortho hydrogen atoms in the proanthocyanidin structure to reduce Fe3+. OPCs have higher reducing ability than PPCs mainly because the OPCs have lower relative molecular mass, increased numbers of hydrogen atoms, smaller steric hindrance, and more easily loses hydrogen atoms.
Figure 11.
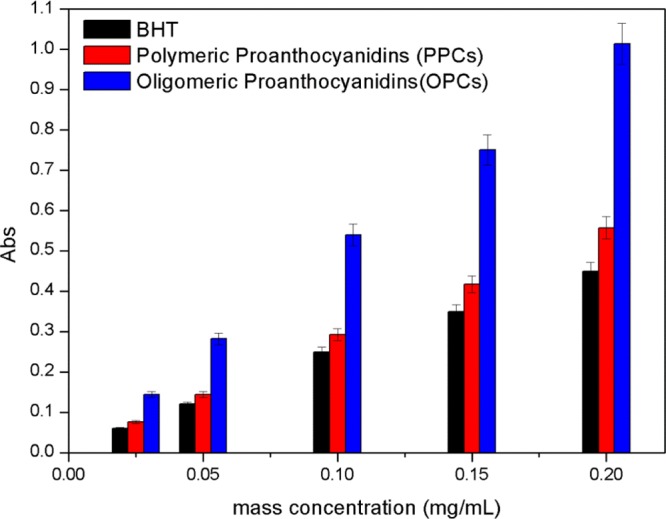
Reducing ability of OPCs, PPCs, and BHT at different mass concentrations.
2.4.2. DPPH• Scavenging Capacity
The 1,1-diphenyl-2-trinitrophenylhydrazyl radical (DPPH•) scavenging capacity of PPCs and OPCs was compared with that of BHT. As shown in Figure 12, over the concentration range 0.025–0.2 mg/mL, the order of DPPH• scavenging capacity was OPCs > PPCs > BHT. Compared with BHT, both PPCs and OPCs showed better DPPH• scavenging capacity. The scavenging capacity also increased with increasing mass concentration. The scavenging activity is attributed to the fact that the phenolic hydroxyl group and ortho hydrogen atoms on the A- and B-rings of the proanthocyanidin molecule (see Figure 1) act as hydrogen donors, which can combine with free radicals to form stable intramolecular hydrogen bonds, semi-quinone free radicals, or structures such as o-benzoquinones, thereby blocking the free radical chain reaction. OPCs have better DPPH• scavenging capacity than PPCs because of their lower molecular weight and smaller steric hindrance, combined with the greater reactivity of the A- and B-ring phenolic hydroxyl groups and ortho hydrogen atoms.
Figure 12.
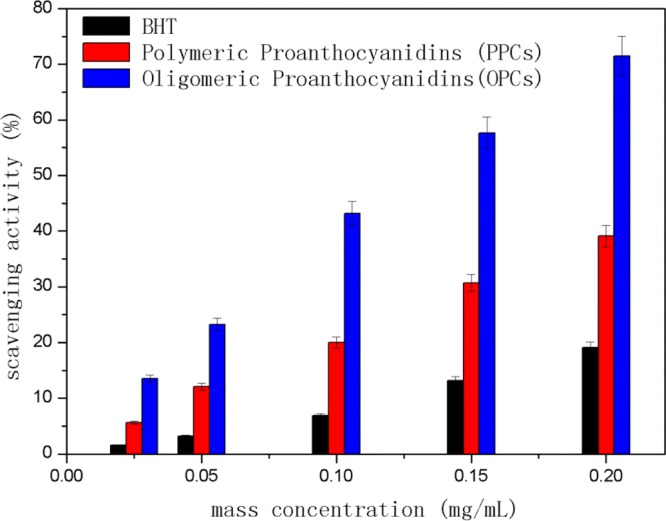
DPPH• scavenging capacity of OPCs, PPCs, and BHT at different mass concentrations.
2.4.3. ABTS•+ Scavenging Capacity
ABTS•+ scavenging capacity is commonly used to indicate the total antioxidant capacity of antioxidants. 2,2′-azino-bis(3-ethylbenzothiazoline-6-sulfonic acid) diammonium salt (ABTS) is oxidized to produce the relatively stable blue-green radical cation ABTS•+, which has a maximum absorption peak at 734 nm. The addition of antioxidants inhibits the production of ABTS•+, resulting in a lighter colored solution and a decrease in absorbance. The more marked the change in the color of the solution, the higher the scavenging rate and the stronger the antioxidant capacity.
As shown in Figure 13, the ABTS•+ scavenging capacity of OPCs, PPCs, and BHT increased with increasing mass concentration over the range 0–0.2 mg/mL. Both OPCs and PPCs are good antioxidants, with higher ABTS•+ scavenging ability than BHT. At the same mass concentration, the order of ABTS•+ scavenging capacity was OPCs > PPCs > BHT. OPCs have better ABTS•+ scavenging activity than PPCs because their molecular weight is smaller, and the phenolic hydroxyl group and ortho hydrogen atoms on the A and B rings are more reactive. When the mass concentration exceeded 0.1 mg/mL, the degree of ABTS•+ radical scavenging had reached saturation, and the scavenging capacity of all three antioxidants was essentially the same.
Figure 13.
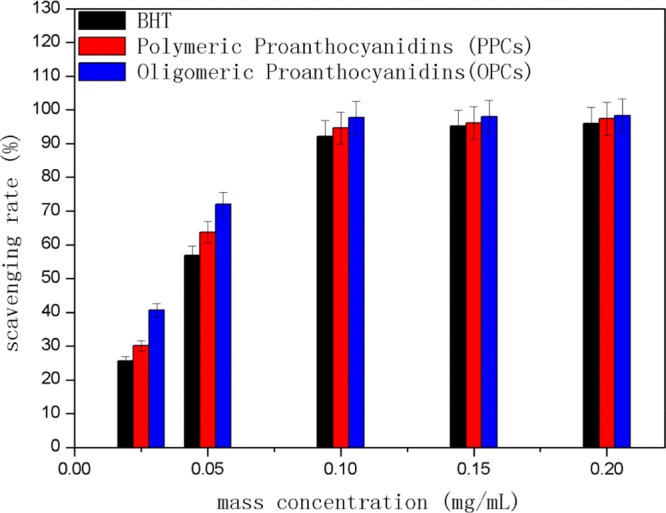
ABTS•+ scavenging capacity of OPCs, PPCs, and BHT at different mass concentrations.
Because ABTS•+ scavenging capacity is often used to indicate the total antioxidant capacity of antioxidants, we measured the concentration at which the scavenging capacity of each antioxidant was half maximal (IC50 value). As shown in Figure 14, the IC50 values are in the order OPCs < PPCs < BHT. The IC50 value of the OPCs obtained by catalytic hydrogenolysis using Ru/C as the catalyst was 0.032 mg/mL, demonstrating that the depolymerized product has the best total antioxidant performance.
Figure 14.
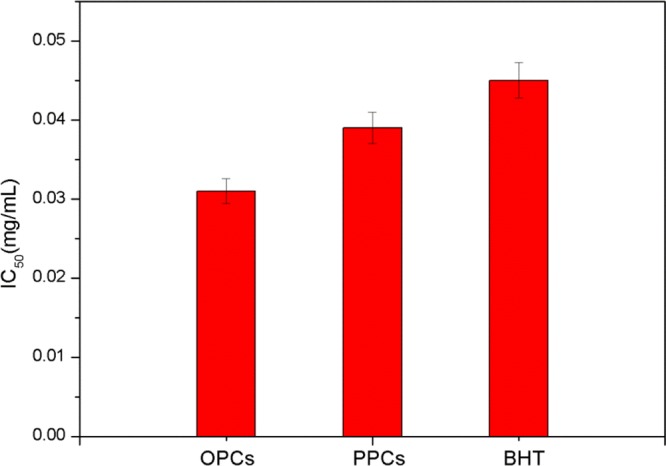
ABTS•+ scavenging activity: IC50 values of OPCs, PPCs, and BHT.
3. Conclusions
In this study, PPCs were extracted from L. gmelinii bark and depolymerized by catalytic hydrogenolysis, using Ru/C as the catalyst. Under the operating conditions investigated, the highest depolymerization rate at 3 MPa hydrogen and 500 rpm stirring was obtained at 150 °C, 1 h, and 1% catalyst loading. The results analyses showed that the molecular weight of the depolymerized products was significantly lower than that of PPCs. Both OPCs and PPCs are condensed flavanol polyphenol structures, containing catechin or epicatechin as the basic structural units. OPCs contain very little Ru metal and meet food safety standards. Both OPCs and PPCs had good reducing ability and DPPH• and ABTS•+ scavenging capacity. The antioxidant properties of both OPCs and PPCs were better than those of the commonly used antioxidant BHT. The OPCs have lower molecular mass, lower steric hindrance, and superior resistance to oxidation compared with the PPCs.
In summary, this study provides a new method, with high practical value, for the depolymerization of PPCs from L. gmelinii bark. The depolymerization products, which have better antioxidant activity than the commonly used antioxidant, are likely to have many applications in fields such as medicine, cosmetics, health foods, and food preservation.
4. Materials and Methods
4.1. Materials and Reagents
A L. gmelinii bark (Tianjin Grace Environmental Technology Co., Ltd., Tianjin, China) was pulverized to particles with diameter 0.5–1.0 mm. The 5% Ru/C catalyst was purchased from Shaanxi Kaida Chemical Co., Ltd. (Beijing, China). Ethanol, petroleum ether (boiling range 60–90 °C), ethyl acetate, ZrOCl2·8H2O, concentrated ammonia solution, silver nitrate, phosphotungstic acid, (+)-catechin, vanillin, acetic acid, methanol, potassium bromide, potassium ferricyanide, disodium hydrogen phosphate, sodium dihydrogen phosphate, trichloroacetic acid, ferric chloride, BHT, DPPH•, ABTS, and potassium persulfate were all of analytical grade.
4.2. Extraction of PPCs
PPCs from L. gmelinii bark were extracted using ethanol solution.17,18 Briefly, crushed L. gmelinii bark (30 g) and 70% (v/v) aqueous ethanol (300 mL) were refluxed for 3 h in a water bath held at 80 °C and then filtered. The filtrate was extracted with an equal volume of petroleum ether (boiling range 60–90 °C) to remove the resin from the extract phase. After removal of resin, the ethanol and petroleum ether were evaporated at 45 ± 5 °C under reduced pressure using a rotary evaporator. An insoluble red material was removed by filtration, and the resulting aqueous solution was extracted three times with equal volumes of ethyl acetate until the ethyl acetate layer was colorless to provide an aqueous solution of PPCs and an organic solution of OPCs.3 The volume of the aqueous solution was reduced to 50 mL using a rotary evaporator at 55 ± 5 °C, and the PPCs (4.103 g) were finally obtained by drying at 45 ± 5 °C in a vacuum oven.
4.3. Catalytic Hydrogenolysis of PPCs
Experiments to determine the effects of catalyst loading, temperature, and reaction time on the hydrogenolysis were carried out using solutions of L. gmelinii PPCs (0.1 g) in 70% (v/v) aqueous ethanol (20 mL). Solutions were treated with different amounts of 5% Ru/C catalyst, and reactions were carried out under 3 MPa hydrogen and19 stirred at 500 rpm in a high pressure reactor (type GCF-1, China First Heavy Industries Dalian Hydrogenation Reactor Co., Ltd., Dalian, China). Reactions were carried out at different temperatures and for different lengths of time. Temperature and pressure were held constant during the reaction using the temperature controller and inlet and outlet valves, respectively, of the high pressure reactor. When the reactions were complete, the catalyst was removed by filtration through a filter membrane with a pore size of 0.45 μm. The filtrates were then dried at 45 ± 5 °C in a vacuum oven to give the OPCs.
4.4. Characterization of Polymerization Degree of Proanthocyanidins
4.4.1. Principle of Determination of Average Polymerization Degree of Proanthocyanidins by the Vanillin-Hydrochloric Acid Method
When the reaction between vanillin-hydrochloric acid solution and proanthocyanidins is carried out in acetic acid, vanillin reacts only with flavanol units at the end of the proanthocyanidins, and the absorbance is approximately proportional to the concentration of flavanol end groups, providing conditions for quantitative detection.20 Whereas the traditional vanillin-hydrochloric acid method, which is carried out in methanol, can be used to determine the quality of proanthocyanidins,21 the reaction in acetic acid can be used to determine the molar amount of the proanthocyanidin. The average polymerization degree of proanthocyanidins can be determined using a combination of these two methods.22,23 This test method can be used to measure the change of polymerization degree before and after depolymerization of proanthocyanidins. The UV–vis absorption spectra of proanthocyanidins, catechins, and vanillin-hydrochloric acid solution have no obvious absorption peak at 500 nm. When the proanthocyanidins or catechins are reacted with vanillin-hydrochloride solution, however, a maximum absorption peak appears at 500 nm.24,25 Selecting 500 nm as the detection wavelength thus effectively avoids interference by other absorption peaks.
4.4.2. Determination of Mass Concentration of Proanthocyanidins by the Vanillin-Hydrochloric Acid Method: Establishment of Catechin Mass Concentration–Absorbance Curve
An initial solution was prepared by accurately diluting catechin (20.4 mg) to 50 mL with methanol in a volumetric flask. Aliquots (1.0, 2.0, 4.0, 6.0, and 8.0 mL) of this solution were transferred to 10 mL volumetric flasks and accurately diluted to 10 mL with methanol to provide standard solutions. The mass concentrations of these standard solutions were 40.8, 81.6, 163.2, 244.8, and 326.4 μg/mL, respectively. Aliquots (1.0 mL) of solutions with different mass concentrations were placed in 10 mL light-proof tubes and reacted with a solution of vanillin (0.5% w/v) and hydrochloric acid (4% v/v) in methanol (5 mL) at 30 °C for 30 min. Using methanol as a blank control, the absorbance was measured at 500 nm using an UV–vis dual-beam UV–vis spectrophotometer (Beijing Puxi General Instrument Co., Ltd., Beijing, China) to establish a catechin mass concentration–absorbance curve.22,26 Over the linear range of 0–350 μg/mL, the relationship between the proanthocyanidin mass concentration y (μg/mL) and the absorbance Abs was: y = 2.68x + 0.0038, with a linear relationship R2 = 0.9998.
4.4.3. Determination of Molar Concentration of Proanthocyanidins by Vanillin-Hydrochloric Acid Method: Establishment of Catechin Molar Concentration–Absorbance Curve
An initial solution was prepared by accurately diluting a solution of catechin (3.2 mg) in methanol (1 mL) to 50 mL with acetic acid in a volumetric flask. Aliquots (1, 2, 4, 6, and 8 mL) of this solution were transferred to 10 mL volumetric flasks and accurately diluted to 10 mL with acetic acid to provide standard solutions. The molar concentrations of these standard solutions were 0.022, 0.056, 0.111, 0.167, and 0.223 μmol/mL, respectively. Aliquots (1.0 mL) of standard solutions with different molar concentrations were placed in 10 mL light-proof tubes and reacted with a solution of hydrochloric acid (4% v/v) and vanillin (0.5% w/v) in acetic acid (5 mL) at 20 °C for 5 min. Using acetic acid as a blank control, the absorbance was measured at 500 nm using a UV–vis spectrophotometer to establish a catechin molar concentration–absorbance curve.25,27 Over the linear range of 0–0.25 μmol/mL, the relationship between the proanthocyanidin molar concentration y (μmol/mL) and the absorbance Abs was: y = 4.753x + 0.007, with a linear relationship R2 = 0.9986.
4.4.4. Determination of Polymerization Degree of Proanthocyanidins
An initial solution was prepared by accurately diluting proanthocyanidins (0.0109 g) to 25 mL with methanol in a volumetric flask. An aliquot (0.5 mL) of this solution was diluted to 10 mL with methanol in a volumetric flask. An aliquot (1 mL) of the diluted solution was removed using a pipette and the absorbance was measured as described in Section 4.4.2. The mass concentration of proanthocyanidins was then calculated using the catechin mass concentration–absorbance curve. A second aliquot (0.5 mL) of the initial solution was diluted to 10 mL with acetic acid in a volumetric flask. An aliquot (1 mL) of the diluted solution was removed using a pipette, and the absorbance was measured as described in Section 4.4.3. The molar concentration of proanthocyanidins was then calculated using the catechin molar concentration–absorbance curve.23,28−30
The average polymerization degree (DP) of the proanthocyanidins was calculated31,32 by formula 1
| 1 |
In formula 1, m is the mass concentration of proanthocyanidins, μg/mL; n is the molar concentration of proanthocyanidins, μmol/mL; M is the relative molecular mass of monomeric catechin, 290.27.
The extent of proanthocyanidin depolymerization is generally expressed as the depolymerization rate,33,34 calculated according to formula 2
| 2 |
In formula 2, DP0 is the polymerization degree of undepolymerized proanthocyanidins and DPx is the polymerization degree of proanthocyanidins after depolymerization.
4.5. Characterization of Proanthocyanidins
4.5.1. UV–Vis Absorption Spectra
Proanthocyanidin samples were dissolved in 70% (v/v) aqueous ethanol at a concentration of 40 μg/mL. Spectra were recorded over the wavelength range 200–800 nm using a TU-1950 dual-beam UV–vis spectrophotometer (Beijing Puxi General Instrument Co., Ltd., Beijing, China). Aqueous ethanol [70% (v/v)] was used as the blank.
4.5.2. FTIR Spectroscopy
FTIR spectra were recorded using the KBr method. Mixtures of proanthocyanidins (2 mg) and KBr (200 mg) were thoroughly ground together in an agate mortar under infrared light and then pressed into discs. Spectra were recorded using an FTIR-650 spectrometer (Tianjin Gangdong Technology Development Co., Ltd., Tianjin, China), over the wavenumber range 400–4000 cm–1, at 2 cm–1 resolution and with 16 scans.
4.5.3. 1H NMR Spectroscopy
Proanthocyanidins (30 mg) were dissolved in DMSO-d6 (0.6 mL), and 1H NMR spectra were recorded using an AVANCE III HD 500 MHz spectrometer [Bruker (Beijing) Scientific Technology Co., Ltd., Beijing].
4.5.4. Determination of Molecular Weight of Proanthocyanidins
Proanthocyanidins (25 mg) were dissolved in 50% (v/v) aqueous methanol (10 mL), and the solution was filtered through a filter membrane with a pore size of 0.45 μm. The molecular weight distribution of proanthocyanidins was measured using an Agilent 1100 Series HPLC system (Agilent Technologies, Inc., Santa Clara, CA, USA), equipped with two gel columns (types 79911GF-084 and 79911GF-083) and a diode array detector. The operating parameters were: injection volume, 50 μL; column temperature, 30 °C; and detection wavelength, 270 nm. The mobile phase was 50% (v/v) aqueous methanol with a flow rate of 1.0 mL/min. The monodispersed standard is polyoxyethylene standard, and the molecular weight is 106, 194, 400, 620, 1010, 4020, 1900, 6450, 11 840, and 22 450.
4.5.5. Characterization Using XPS
XPS spectra of proanthocyanidins were recorded using a K-Alpha X-ray photoelectron spectrometer (Thermo Fisher Scientific, USA), with the following conditions: Ag 3d5/2 resolution, 0.85 eV half peak width, 0–1350 eV binding energy range, Al target, X-ray maximum 12 kV, and 30 mA.
4.5.6. Characterization Using ICP-MS
Proanthocyanidins (100 mg) and HNO3 (3 mL) were mixed in a pressure digestion tank and covered overnight. The stainless steel jacket was then screwed into place, and the samples were digested in a constant temperature oven at 80, 120 or 160 °C for 2 h, until the solutions were clear and transparent. After cooling, the solutions were removed from the digestion tank, heated on a 100 °C hot plate for 30 min, and then diluted to 10 mL with pure water. A blank test was necessary.
The heavy metal content of the digested solutions was measured using a NexION 350D ICP-MS instrument (Thermo Fisher Scientific). The operating conditions were as follows: RF power, 1600 W; plasma gas flow, 18.00 L/min; auxiliary gas flow, 1.20 L/min; nebulizer flow, 0.92 mL/min; sample cone, 1.1 mm; intercepting cone, 0.8 mm; amu (10% peak height) resolution, 0.6–0.7; acquisition mode, jump peak data; analysis time, 3 min; and number of repeat measurements, 3.
4.6. Antioxidant Properties of Proanthocyanidins
Initial solutions were prepared by accurately diluting proanthocyanidins (10 mg) to 10 mL with 70% (v/v) aqueous ethanol in a volumetric flask. Sample solutions were prepared by transferring aliquots (0.25, 0.5, 1.0, 1.5, and 2.0 mL) of the initial solution by pipette to 10 mL volumetric flasks and diluting with 70% (v/v) aqueous ethanol. The sample solutions prepared in this way had mass concentrations of 0.025, 0.05, 0.10, 0.15, and 0.20 mg/mL.
4.6.1. Reducing Ability
Aliquots (1.0 mL) of proanthocyanidin sample solutions with different mass concentrations were placed in centrifuge tubes. The samples were treated with 0.2 M sodium phosphate buffer (2.5 mL, pH 6.6) and 1% (w/v) potassium ferricyanide solution (2.5 mL) and allowed to react in a water bath at 50 °C for 20 min. A solution of 10% (w/v) trichloroacetic acid (2.5 mL) was then added, and the mixtures were centrifuged at 3000 rpm for 10 min. An aliquot (2.5 mL) of the supernatant was placed in a light-proof tube and mixed thoroughly with deionized water (2.5 mL) and 0.1% (w/v) ferric chloride solution (1 mL). After standing for 10 min, the absorbance was measured at 700 nm using a UV–vis spectrophotometer.35−37 The reducing ability of BHT was measured using the same method for comparison.
4.6.2. DPPH•-scavenging capacity
DPPH• (20 mg) was accurately diluted to 500 mL with ethanol in a volumetric flask, and the resulting solution was stored in the dark. Solutions of proanthocyanidins (0.25 mL) with different mass concentrations were placed in light-proof tubes and thoroughly mixed with DPPH• solution (4.75 mL). After standing at room temperature for 30 min in the dark, absorbance was measured at 517 nm using a UV–vis spectrophotometer, with 70% (v/v) aqueous ethanol as the blank control.38,39 The DPPH•-scavenging capacity of BHT was measured using the same method for comparison. The DPPH• scavenging rate was calculated according to formula 3
| 3 |
In formula 3, A0 is the absorption of the control solution at 517 nm and Ax is the absorption of the sample solution at 517 nm.
4.6.3. ABTS•+-Scavenging Capacity
A solution of ABTS (38.5 mg) in deionized water (10 mL) was treated with potassium persulfate (6.6 mg) and allowed to stand at 30 °C for 12 h in the dark to form a blue-green solution of the radical cation ABTS•+. The ABTS•+ solution was diluted with sodium acetate solution (20 mM, pH 4.5) to give an absorbance of 0.70 ± 0.02 at a wavelength of 734 nm.
Aliquots (0.25 mL) of proanthocyanidin solutions with different mass concentrations were mixed with ABTS•+ (4.75 mL) in light-proof tubes. After standing at room temperature for 6 min in dark, absorbance was measured at 734 nm using a UV–vis spectrophotometer, with 70% (v/v) aqueous ethanol as the blank sample.40,41 The ABTS•+-scavenging capacity of BHT was measured using the same method for comparison.
The ABTS•+-scavenging rate was calculated according to formula 4
| 4 |
In formula 4, A0 is the absorption of the control solution at 734 nm and Ax is the absorption of the sample solution at 734 nm.
This work was supported by The National Key Technology R&D Program of Thirteen Five-year Plan Period (grant no. 2016YFD0600806) and the Natural Science Foundation of Heilongjiang Province of China (LH2019C009).
The authors declare no competing financial interest.
References
- An L.; Si C.; Wang G.; Sui W.; Tao Z. Enhancing the solubility and antioxidant activity of high-molecular-weight lignin by moderate depolymerization via in situ ethanol/acid catalysis. Ind. Crops Prod. 2019, 128, 177–185. 10.1016/j.indcrop.2018.11.009. [DOI] [Google Scholar]
- Tudor E. M.; Barbu M. C.; Petutschnigg A.; Réh R. Added-value for wood bark as a coating layer for flooring tiles. J. Cleaner Prod. 2018, 170, 1354–1360. 10.1016/j.jclepro.2017.09.156. [DOI] [Google Scholar]
- Ni L.; Zhao F.; Li B.; Wei T.; Guan H.; Ren S. Antioxidant and Fluorescence Properties of Hydrogenolyzised Polymeric Proanthocyanidins Prepared Using SO(4)(2-)/ZrO(2) Solid Superacids Catalyst. Molecules 2018, 23, 2445. 10.3390/molecules23102445. [DOI] [PMC free article] [PubMed] [Google Scholar]
- Denev P.; Číž M.; Kratchanova M.; Blazheva D. Black chokeberry (Aronia melanocarpa) polyphenols reveal different antioxidant, antimicrobial and neutrophil-modulating activities. Food Chem. 2019, 284, 108–117. 10.1016/j.foodchem.2019.01.108. [DOI] [PubMed] [Google Scholar]
- Fraser K.; Harrison S. J.; Lane G. A.; Otter D. E.; Hemar Y.; Quek S.-Y.; Rasmussen S. HPLC–MS/MS profiling of proanthocyanidins in teas: A comparative study. J. Food Compos. Anal. 2012, 26, 43–51. 10.1016/j.jfca.2012.01.004. [DOI] [Google Scholar]
- Longo E.; Rossetti F.; Merkyte V.; Boselli E. Disambiguation of Isomeric Procyanidins with Cyclic B-Type and Non-cyclic A-Type Structures from Wine and Peanut Skin with HPLC-HDX-HRMS/MS. J. Am. Soc. Mass Spectrom. 2018, 29, 2268–2277. 10.1007/s13361-018-2044-5. [DOI] [PubMed] [Google Scholar]
- El Gharras H. Polyphenols: food sources, properties and applications - a review. Int. J. Food Sci. Technol. 2009, 44, 2512–2518. 10.1111/j.1365-2621.2009.02077.x. [DOI] [Google Scholar]
- Takagi K.; Mitsunaga T. Tyrosinase inhibitory activity of proanthocyanidins from woody plants. J. Wood Sci. 2003, 49, 461–465. 10.1007/s10086-002-0496-4. [DOI] [Google Scholar]
- Zhang A.; Li J.; Zhang S.; Mu Y.; Zhang W.; Li J. Characterization and acid-catalysed depolymerization of condensed tannins derived from larch bark. RSC Adv. 2017, 7, 35135–35146. 10.1039/c7ra03410e. [DOI] [Google Scholar]
- Li X.; He C.; Song L.; Li T.; Cui S.; Zhang L.; Jia Y. Antimicrobial activity and mechanism of Larch bark procyanidins against Staphylococcus aureus. Acta Biochim. Biophys. Sin. 2017, 49, 1058–1066. 10.1093/abbs/gmx112. [DOI] [PubMed] [Google Scholar]
- Chai W.-M.; Lin M.-Z.; Wang Y.-X.; Xu K.-L.; Huang W.-Y.; Pan D.-D.; Zou Z.-R.; Peng Y.-Y. Inhibition of tyrosinase by cherimoya pericarp proanthocyanidins: Structural characterization, inhibitory activity and mechanism. Food Res. Int. 2017, 100, 731–739. 10.1016/j.foodres.2017.07.082. [DOI] [PubMed] [Google Scholar]
- Zhong H.; Xue Y.; Lu X.; Shao Q.; Cao Y.; Wu Z.; Chen G. The Effects of Different Degrees of Procyanidin Polymerization on the Nutrient Absorption and Digestive Enzyme Activity in Mice. Molecules 2018, 23, 2916. 10.3390/molecules23112916. [DOI] [PMC free article] [PubMed] [Google Scholar]
- He Q.; Yao K.; Sun D.; Shi B. Biodegradability of tannin-containing wastewater from leather industry. Biodegradation 2007, 18, 465–472. 10.1007/s10532-006-9079-1. [DOI] [PubMed] [Google Scholar]
- Luo L.; Cui Y.; Cheng J.; Fang B.; Wei Z.; Sun B. An approach for degradation of grape seed and skin proanthocyanidin polymers into oligomers by sulphurous acid. Food Chem. 2018, 256, 203–211. 10.1016/j.foodchem.2018.02.097. [DOI] [PubMed] [Google Scholar]
- Li Z.; Zeng J.; Tong Z.; Qi Y.; Gu L. Hydrogenolytic depolymerization of procyanidin polymers from hi-tannin sorghum bran. Food Chem. 2015, 188, 337–342. 10.1016/j.foodchem.2015.05.021. [DOI] [PubMed] [Google Scholar]
- Deng W.; Wang Y.; Zhang Q.; Wang Y. Development of Bifunctional Catalysts for the Conversions of Cellulose or Cellobiose into Polyols and Organic Acids in Water. Catal. Surv. Asia 2012, 16, 91–105. 10.1007/s10563-012-9136-1. [DOI] [Google Scholar]
- Ravber M.; Knez Ž.; Škerget M. Isolation of phenolic compounds from larch wood waste using pressurized hot water: extraction, analysis and economic evaluation. Cellulose 2015, 22, 3359–3375. 10.1007/s10570-015-0719-7. [DOI] [Google Scholar]
- Bianchi S.; Kroslakova I.; Janzon R.; Mayer I.; Saake B.; Pichelin F. Characterization of condensed tannins and carbohydrates in hot water bark extracts of European softwood species. Phytochemistry 2015, 120, 53–61. 10.1016/j.phytochem.2015.10.006. [DOI] [PubMed] [Google Scholar]
- Liang Y.; Zhu M.; Ma J.; Tang Y.; Chen Y.; Lu T. Highly dispersed carbon-supported Pd nanoparticles catalyst synthesized by novel precipitation–reduction method for formic acid electrooxidation. Electrochim. Acta 2011, 56, 4696–4702. 10.1016/j.electacta.2011.03.019. [DOI] [Google Scholar]
- Saminathan M.; Tan H.; Sieo C.; Abdullah N.; Wong C.; Abdulmalek E.; Ho Y. Polymerization degrees, molecular weights and protein-binding affinities of condensed tannin fractions from a Leucaena leucocephala hybrid. Molecules 2014, 19, 7990–8010. 10.3390/molecules19067990. [DOI] [PMC free article] [PubMed] [Google Scholar]
- Lerma-Herrera M. A.; Núñez-Gastélum J. A.; Ascacio-Valdés J.; Aguilar C. N.; Rodrigo-García J.; Díaz-Sánchez A. G.; Alvarez-Parrilla E.; de la Rosa L. A. Estimation of the Mean Degree of Polymerization of Condensed Tannins from the Kernel and Shell of Carya illinoinensis by HPLC/MS and Spectrophotometric Methods. Food Anal. Methods 2017, 10, 3023–3031. 10.1007/s12161-017-0866-6. [DOI] [Google Scholar]
- Muchuweti M.; Ndhlala A. R.; Kasiyamhuru A. Estimation of the degree of polymerization of condensed tannins of some wild fruits of Zimbabwe (Uapaca kirkiana andZiziphus mauritiana) using the modified vanillin-HCl method. J. Sci. Food Agric. 2005, 85, 1647–1650. 10.1002/jsfa.2163. [DOI] [Google Scholar]
- Bordiga M.; Travaglia F.; Locatelli M.; Coïsson J. D.; Arlorio M. Characterisation of polymeric skin and seed proanthocyanidins during ripening in six Vitis vinifera L. cv. Food Chem. 2011, 127, 180–187. 10.1016/j.foodchem.2010.12.141. [DOI] [Google Scholar]
- Boudesocque L.; Dorat J.; Pothier J.; Gueiffier A.; Enguehard-Gueiffier C. High performance thin layer chromatography-densitometry: a step further for quality control of cranberry extracts. Food Chem. 2013, 139, 866–871. 10.1016/j.foodchem.2013.02.002. [DOI] [PubMed] [Google Scholar]
- Lu Y.; Liu X.; Liu S.; Yue Y.; Guan C.; Liu Z. A simple and rapid procedure for identification of seed coat colour at the early developmental stage of Brassica juncea and Brassica napus seeds. Plant Breed. 2012, 131, 176–179. 10.1111/j.1439-0523.2011.01914.x. [DOI] [Google Scholar]
- A. AL Jahdaly B. Inhibition Efficiency of Some Amino Acids in the Presence of Vanillin for the Corrosion of Mild Steel in HCl Solution. Int. J. Electrochem. Sci. 2018, 13, 5284–5293. 10.20964/2018.06.50. [DOI] [Google Scholar]
- Lingua::EN::Titlecase T. A.; Martinez T.; Bae H. D.; Muir A. D.; Yanke L. J.; Jones G. A. Characterization of condensed tannins purified from legume forages: chromophore production, protein precipitation, and inhibitory effects on cellulose digestion. J. Chem. Ecol. 2005, 31, 2049–2068. 10.1007/s10886-005-6077-4. [DOI] [PubMed] [Google Scholar]
- Vazquez-Flores A. A.; Wong-Paz J. E.; Lerma-Herrera M. A.; Martinez-Gonzalez A. I.; Olivas-Aguirre F. J.; Aguilar C. N.; Wall-Medrano A.; Gonzalez-Aguilar G. A.; Alvarez-Parrilla E.; de la Rosa L. A. Proanthocyanidins from the kernel and shell of pecan (Carya illinoinensis): Average degree of polymerization and effects on carbohydrate, lipid, and peptide hydrolysis in a simulated human digestive system. J. Funct. Foods 2017, 28, 227–234. 10.1016/j.jff.2016.11.003. [DOI] [Google Scholar]
- Ozdal T.; Capanoglu E.; Altay F. A review on protein–phenolic interactions and associated changes. Food Res. Int. 2013, 51, 954–970. 10.1016/j.foodres.2013.02.009. [DOI] [Google Scholar]
- Travaglia F.; Bordiga M.; Locatelli M.; Coïsson J. D.; Arlorio M. Polymeric proanthocyanidins in skins and seeds of 37 Vitis vinifera L. cultivars: a methodological comparative study. J. Food Sci. 2011, 76, C742–C749. 10.1111/j.1750-3841.2011.02194.x. [DOI] [PubMed] [Google Scholar]
- Bindon K. A.; Kennedy J. A. Ripening-induced changes in grape skin proanthocyanidins modify their interaction with cell walls. J. Agric. Food Chem. 2011, 59, 2696–2707. 10.1021/jf1047207. [DOI] [PubMed] [Google Scholar]
- Engström M. T.; Pälijärvi M.; Fryganas C.; Grabber J. H.; Mueller-Harvey I.; Salminen J.-P. Rapid qualitative and quantitative analyses of proanthocyanidin oligomers and polymers by UPLC-MS/MS. J. Agric. Food Chem. 2014, 62, 3390–3399. 10.1021/jf500745y. [DOI] [PubMed] [Google Scholar]
- Locock K. E. S.; Meagher L.; Haeussler M. Oligomeric cationic polymethacrylates: a comparison of methods for determining molecular weight. Anal. Chem. 2014, 86, 2131–2137. 10.1021/ac403735n. [DOI] [PubMed] [Google Scholar]
- Melone F.; Saladino R.; Lange H.; Crestini C. Tannin structural elucidation and quantitative (3)(1)P NMR analysis. 2. Hydrolyzable tannins and proanthocyanidins. J. Agric. Food Chem. 2013, 61, 9316–9324. 10.1021/jf401664a. [DOI] [PubMed] [Google Scholar]
- Ouchemoukh S.; Hachoud S.; Boudraham H.; Mokrani A.; Louaileche H. Antioxidant activities of some dried fruits consumed in Algeria. LWT–Food Sci. Technol. 2012, 49, 329–332. 10.1016/j.lwt.2012.07.022. [DOI] [Google Scholar]
- Chen X.-X.; Liang G.; Chai W.-M.; Feng H.-L.; Zhou H.-T.; Shi Y.; Chen Q.-X. Antioxidant and antityrosinase proanthocyanidins from Polyalthia longifolia leaves. J. Biosci. Bioeng. 2014, 118, 583–587. 10.1016/j.jbiosc.2014.04.015. [DOI] [PubMed] [Google Scholar]
- Li Q.; Wang X.; Chen J.; Liu C.; Li T.; McClements D. J.; Dai T.; Liu J. Antioxidant activity of proanthocyanidins-rich fractions from Choerospondias axillaris peels using a combination of chemical-based methods and cellular-based assay. Food Chem. 2016, 208, 309–317. 10.1016/j.foodchem.2016.04.012. [DOI] [PubMed] [Google Scholar]
- Baldan V.; Sut S.; Faggian M.; Dalla Gassa E.; Ferrari S.; De Nadai G.; Francescato S.; Baratto G.; Dall’Acqua S. Larix decidua Bark as a Source of Phytoconstituents: An LC-MS Study. Molecules 2017, 22, 1974. 10.3390/molecules22111974. [DOI] [PMC free article] [PubMed] [Google Scholar]
- Zhai Y.; Wang J.; Wang H.; Song T.; Hu W.; Li S. Preparation and Characterization of Antioxidative and UV-Protective Larch Bark Tannin/PVA Composite Membranes. Molecules 2018, 23, 2073. 10.3390/molecules23082073. [DOI] [PMC free article] [PubMed] [Google Scholar]
- González-Centeno M. R.; Jourdes M.; Femenia A.; Simal S.; Rosselló C.; Teissedre P.-L. Proanthocyanidin composition and antioxidant potential of the stem winemaking byproducts from 10 different grape varieties (Vitis vinifera L.). J. Agric. Food Chem. 2012, 60, 11850–11858. 10.1021/jf303047k. [DOI] [PubMed] [Google Scholar]
- Oldoni T. L. C.; Melo P. S.; Massarioli A. P.; Moreno I. A. M.; Bezerra R. M. N.; Rosalen P. L.; da Silva G. V. J.; Nascimento A. M.; Alencar S. M. Bioassay-guided isolation of proanthocyanidins with antioxidant activity from peanut (Arachis hypogaea) skin by combination of chromatography techniques. Food Chem. 2016, 192, 306–312. 10.1016/j.foodchem.2015.07.004. [DOI] [PubMed] [Google Scholar]
- To C. T.; Chan K. S. Catalytic carbon-carbon sigma-bond hydrogenolysis. Tetrahedron Lett. 2016, 57, 4664–4669. 10.1016/j.tetlet.2016.09.045. [DOI] [Google Scholar]
- Yang L.; Sun X.; Yang F.; Zhao C.; Zhang L.; Zu Y. Application of ionic liquids in the microwave-assisted extraction of proanthocyanidins from Larix gmelini bark. Int. J. Mol. Sci. 2012, 13, 5163–5178. 10.3390/ijms13045163. [DOI] [PMC free article] [PubMed] [Google Scholar]
- Jing Y.; Huang J.; Yu X. Preparation, characterization, and functional evaluation of proanthocyanidin-chitosan conjugate. Carbohydr. Polym. 2018, 194, 139–145. 10.1016/j.carbpol.2018.04.037. [DOI] [PubMed] [Google Scholar]
- Grigsby W. J. Simulating the protective role of bark proanthocyanidins in surface coatings: Unexpected beneficial photo-stabilisation of exposed timber surfaces. Prog. Org. Coat. 2017, 110, 55–61. 10.1016/j.porgcoat.2017.03.007. [DOI] [Google Scholar]


