

Abstract
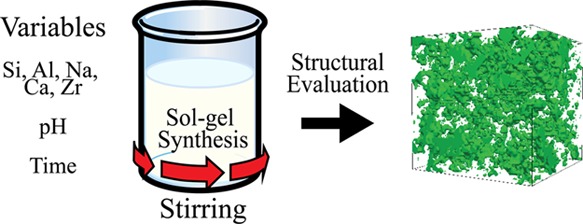
During the processes associated with glass corrosion, porous hydrated glass alteration layers typically form upon exposure to aqueous conditions for extended time periods. The impacts of the alteration layer on glass durability have not been agreed upon in the glass science community. In particular, the formation mechanisms of hydrated glass alteration layers are still largely unknown and require further investigation, but these layers often require months to years to develop and are often too thin to adequately characterize. Meanwhile, sol–gel-derived silicate gels are relatively easy to synthesize in bulk with custom compositions relevant to hydrated glass alteration layers. If alteration layers and synthetic silicate gels demonstrate physical and chemical properties that are sufficiently similar, synthetic silicate gels could be used as analogues for hydrated glass alteration layers in future studies. However, synthetic gels must first be prepared and evaluated before comparisons between glass alteration layers and synthetic silicate gels can be made. This work focuses entirely on the synthesis and observed physical properties of synthetic silicate gels. A future work will compare the characteristics of synthetic gels described in this work with altered waste glass formed in similar pH environments. In this study, synthetic gels were made with custom compositions at various pH values to evaluate the effect of pH on gel structure and morphology. Several other variables were examined also, such as composition, drying, and aging. Gels were produced by sequential additions of organometallic precursors in a single container. Gels were analyzed with several techniques including small-angle X-ray scattering, gas adsorption, and He pycnometry to determine the effects of the variables on physical properties. Results show that gels prepared at pH 3 consistently contained fewer primary particles with diameters larger than 7.2 nm and fewer pores with diameters larger than 30 nm compared to gels synthesized at pH 7 and 9. Composition was shown to have no discernable effect on primary particle and pore sizes at any pH.
1. Introduction
The durability of glasses is vital to several fields including medicine, optics, and nuclear waste disposal and needs to be understood for the glasses to be reliable in their respective fields.1−5 Before the glass durability lifetime can be determined for a given glass, glass alteration behavior must be adequately understood.4,6,7 Prior research into the durability of these materials, and the mechanisms that control it, has shown that porous hydrated alteration gel layers typically form at the surface of glass upon exposure to static aqueous conditions for extended time periods.7−16 Although the properties of the alteration gel layers have been investigated, the mechanisms behind their formation and their role in glass alteration mechanisms are not well understood and require more data from the community to optimize predictive models.8,11,15−17 Formation of glass alteration layers often requires long-term experiments (months to years), and the resulting alteration gel layer is often too thin for adequate characterization.
Hydrated alteration gel layers are typically more porous than the original glass, but their porosities are often dependent on several variables including glass composition and solution pH.17−20 Alteration gel layers are composed mostly of silica but can also contain varying amounts of other elements such as Al, Ca, Na, and Zr. Alteration gel layers have proven to be challenging to characterize, mainly because they are thin, difficult to isolate, and occasionally nonuniform.8,16,21,22 Silicate gels synthesized via the sol–gel method, however, are relatively straightforward to synthesize in bulk and thus are much more straightforward to characterize. Because of this, formation mechanisms under various conditions are relatively well understood for simple silica gels synthesized via the sol–gel method.23−29 While comparisons of similar composition gels have not yet been done, the similarities in basic properties such as composition range, specific surface area, and amorphous nature suggest that parallels could be drawn between the formation and evolution of the two systems.8,20,24,27,28 If the formation mechanisms of complicated, multicomponent gels could be better understood as well as the formation mechanisms of simple silica gels, the knowledge gained could potentially be applied to studying the formation of alteration gel layers in corroded glasses.
International Simple Glass (ISG), a six oxide borosilicate glass developed as a reference glass for studying nuclear waste glass alteration mechanisms as part of an international collaboration, was chosen as the starting glass composition for the current study due to its simplicity and relevance.4 Previously, alteration layers of ISG altered in aqueous conditions of varying pH have been produced.21 The constituent ratios of the composition of these alteration layers of altered ISG were chosen as target compositions for synthetic gels. However, the interpretation of data obtained from sol–gel materials synthesized based on the compositions of the alteration layers of ISG may present some difficulties due to the large number of components. Simplified versions of ISG have been prepared and altered in aqueous conditions by Gin et al.30 Two of these glasses, termed CJ2 and CJ3, have identical elemental molar ratios to ISG, but CJ3 excludes Zr and CJ2 excludes Zr and Ca from their respective compositions as presented with Table 1. Preparation of synthetic gels with compositions equivalent with the alteration layers of ISG, CJ2, and CJ3 will lead to a better understanding of the effects of adding Ca and Zr to the compositions on the gel structure and properties.
Table 1. Elemental Mole Ratios of Unaltered CJ2, CJ3, and ISG Glasses in Relation to Si from Gin et al.30a.
| glass | Al | B | Ca | Na | Si | Zr |
|---|---|---|---|---|---|---|
| CJ2 | 0.13 | 0.53 | NA | 0.42 | 1 | NA |
| CJ3 | 0.13 | 0.53 | 0.09 | 0.42 | 1 | NA |
| ISG | 0.13 | 0.53 | 0.1 | 0.42 | 1 | 0.03 |
Nonapplicable entries are indicated as NA.
2. Background
Silica gels can be prepared from the sol–gel polymerization of silicon alkoxides such as tetraethyl orthosilicate (TEOS or Si(OC2H5)4), as seen in the procedure outlined in the literature.24,25,31,32 When TEOS and water are mixed in a mutual solvent (usually ethanol), hydrolysis occurs to create silanols23−25
However, complete hydrolysis does not occur if the amount of water is limited as shown above. Rather condensation occurs between either two silanols or a silanol and an ethoxy group to form a bridging oxygen or a siloxane group, that is, Si–O–Si. A water or ethanol molecule is then eliminated as seen in the following reaction
The hydrolysis and polycondensation reactions occur throughout the solution to form colloidal particles (sol), which form into a gel with time.
When additional cations are incorporated into a sol, the hydrolysis and condensation reactions have different kinetics requiring organometallic precursors to be added sequentially to the reaction mixture to avoid coprecipitation.24,33−36 An in-depth literature search was conducted for sol–gel processes with similar compositions to the current study to determine the optimal order of precursors for making a gel with a composition identical to alteration layers of borosilicate glasses, particularly glasses relevant to nuclear waste disposal. Unfortunately, nothing could be found containing all the components of an alteration layer of ISG (i.e., Si, Al, Na, Ca, and Zr). However, guidelines for the synthesis of simpler gels were found. For instance, in sol–gel syntheses used in Irwin et al. and Riley et al., the Si precursor was added to the reaction mixture first followed by Al and then Na precursors.33,37 In the bioglass community, glasses are made with Ca where the synthesis involves the addition of a Ca precursor to the reaction mixture before a Na precursor.38,39 For previous works where Zr was added to reactions also containing Si and Na, it was not indicated when Zr was added.40,41 However, as long as Zr is added after Si, the small amount of added Zr should incorporate itself easily (and not coprecipitate) into the silica matrix since both Si and Zr are tetravalent.42
Several variables are important to consider for sol–gel synthesis such as aging times, composition, pH, and drying. Solution pH is among the most important variables in terms of the impact to pore and particle sizes.23,24,26,27 Under acid-catalyzed conditions, silica gels tend to consist of linear chains that entangle and form additional branches, resulting in gelation, whereas under basic conditions, more highly branched clusters form and link to create the gel network.23−25,32,43,44 Because of these differences, gels synthesized under acidic conditions are typically composed of smaller particles and smaller pore diameters compared to gels prepared under basic conditions.
3. Experimental Procedure
3.1. Sol–Gel Synthesis
Sol–gel-derived gels were synthesized using compositions comparable to those of alteration layers produced from the static corrosion of glasses CJ2 and CJ3 from Gin et al.30 and ISG from Kaspar et al.21 as shown in Table 2. Since elemental molar ratios of Si, Al, and Na are identical in the CJ2, CJ3, and ISG original glass compositions (Table 1), synthetic gels based on altered CJ2, CJ3, and ISG have similar compositions.30 Additionally, each composition was made at target pH values of 3, 7, and 9.
Table 2. Cation Composition (mol %) for Alteration Layers from CJ2, CJ3, ISG.3, ISG.7, and ISG.9 Samples and Gels CJ2.9.A-7, CJ2.9.A-15, CJ3.7.A-17, ISG.3.B-7, ISG.3.B-15, ISG.7.A-47, and ISG.9.B-45a.
| sample type | sample ID | Al | Ca | Na | Si | Zr | method |
|---|---|---|---|---|---|---|---|
| glass alteration layer | CJ2 | 9.9 | NA | 13.8 | 76.3 | NA | from Gin et. al.30 |
| CJ3 | 10.7 | 7.9 | 4.6 | 76.8 | NA | ||
| ISG.3 | 10 ± 1 | 3 ± 1 | 11 ± 3 | 74 ± 3 | 2 ± 1 | SEM/EDS analysis for glasses featured in Kaspar et. al.21 | |
| ISG.7 | 9 ± 1 | 3 ± 1 | 13 ± 3 | 73 ± 4 | 2 ± 1 | ||
| ISG.9 | 16 ± 4 | 7 ± 2 | 8 ± 4 | 65 ± 5 | 4 ± 1 | ||
| synthetic gels | CJ2.9.A-7 | 11 ± 1 | NA | 27 ± 3 | 62 ± 6 | NA | solution analysis by ICP-OES |
| CJ2.9.A-15 | 11 ± 1 | NA | 22 ± 2 | 67 ± 7 | NA | ||
| CJ3.7.A-17 | 14 ± 1 | 6.4 ± 0.6 | 14 ± 1 | 66 ± 7 | NA | ||
| ISG.3.B-7 | 14 ± 1 | 4.5 ± 0.4 | 20 ± 2 | 60 ± 6 | 1.2 ± 0.2 | ||
| ISG.3.B-15 | 14 ± 1 | 5.4 ± 0.5 | 20 ± 2 | 59 ± 6 | 1.2 ± 0.2 | ||
| ISG.7.A-47 | 10 ± 1 | 5.5 ± 0.6 | 20 ± 2 | 63 ± 6 | 1.5 ± 0.1 | ||
| ISG.9.B-45 | 15 ± 1 | 9.3 ± 0.9 | 15 ± 2 | 58 ± 6 | 2.8 ± 0.3 |
Errors are given as 10% for gel samples, and nonapplicable entries are indicated as NA.
The general stepwise synthesis is presented with Figure 1. TEOS (Aldrich), deionized water (H2O), and ethanol (EtOH, 100%, Decon Labs, Inc.) were initially mixed in a mole ratio of 1:4:8 into 60 mL Savillex vials. Mixing times were targeted to be 5–8 h to ensure the components had time to react properly but were increased as needed.
Figure 1.

Schematic representation of synthesis steps for sol–gel batches (specific details for individual batches for steps a–i are explained in Table 3).
After adding TEOS, the pH of the mixture was adjusted with 0.1 M HNO3 at pH 3, a mixture of 2.7 M NH4OH and 0.4 M NH4F (NH4OH/NH4F) at pH 7,45 and concentrated NH4OH or NH4OH/NH4F at pH 9. The pH values were determined using pH strips (Hydrion). After mixing, aluminum-tri-sec-butoxide (Al(OBus)3) (Aldrich), zirconium(IV) propoxide (Zr(IV) prop) (Acros Organics), and more EtOH were added to the mixture. The pH values for all the mixtures dropped significantly (pH 1.5–2) for batches measured after Al(OBus)3, Zr(IV) prop, and EtOH were added and mixed. Sodium ethoxide (NaOEt) (Sigma-Aldrich) and calcium 2-methoxyethoxide (CaMeEt) (Gelest, Inc.) followed, causing the pH to increase (pH 8–11). Aliquots of 0.1 M HNO3 were added to ISG mixtures at originally pH 3 and 7 instead of H2O to try to lower pH, but no change in pH occurred (as observed by pH strips).
Following the addition of H2O or 0.1 M HNO3 to the sol–gel mixtures and final mixing, the batches were cast into multiple smaller capped polypropylene vials and set aside for gelation, as shown in Figure 1. After gelation, samples were aged for various time periods. Because of the assortment of experimental conditions, various times were utilized for aging. This resulted in dozens of samples being made since each batch was divided into five samples to age for various durations. After the samples had completed the aging process, they were placed in 50/50 mixtures of EtOH and H2O (EtOH/H2O) to fully hydrolyze any remaining unhydrolyzed organometallic precursors. EtOH/H2O solvents were exchanged daily until pH strips indicated that the pH was identical to pure EtOH/H2O, which has a pH of roughly 6.5. Following EtOH/H2O exchanges, the samples were placed in 100% EtOH and exchanged daily with fresh EtOH to remove residue waters. After five or more exchanges, the samples were either left immersed in EtOH as alcogels or supercritically dried (SCD) with CO2 to prevent gel structure collapse into aerogels.46
Batches are denoted as their composition of the altered glass they are based on followed by their target pH and chorological identification in alphabetical order. Thus, the first batch made with the CJ2 composition at target pH 9 is referred to as CJ2.9.A. Samples are referred to as the batch name followed by their aging time in days, as indicated in Figure 1 and Table 3. For example, a sample aged for 15 days from batch CJ2.9.A is referred to as CJ2.9.A-15. Finally, samples immersed in EtOH feature a superscripted “E” at the end of the name, whereas SCD samples have no superscript. For example, CJ2.3.B-45E is immersed in EtOH, and CJ2.3.B-45 has been SCD.
Table 3. Description of Synthesis Steps for Synthetic Gel Batches Corresponding to Steps a–i in Figure 1a.
| |
CJ2 |
CJ3 |
ISG |
|||||||||
|---|---|---|---|---|---|---|---|---|---|---|---|---|
| label | synthesis steps | CJ2.3.B | CJ2.3.E | CJ2.7.B | CJ2.9.A | CJ2.9.B | CJ3.3.B | CJ3.7.A | CJ3.9.A | ISG.3.B | ISG.7.A | ISG.9.B |
| a | ethanol (mL) | 5.50 | 5.50 | 5.50 | 5.50 | 5.50 | 5.50 | 5.50 | 5.50 | 5.50 | 5.50 | 5.50 |
| H2O (mL) | 0.424 | 0.424 | 0.424 | 0.424 | 0.424 | 0.424 | 0.424 | 0.424 | 0.424 | 0.424 | 0.424 | |
| TEOS (mL) | 5.00 | 5.00 | 5.00 | 5.00 | 5.00 | 5.00 | 5.00 | 5.00 | 5.00 | 5.00 | 5.00 | |
| catalyst | 0.22 mL of 0.1 M HNO3 | 0.25 mL of 0.1 M HNO3 | NA | NA | NA | 0.44 mL of 0.1 M HNO3 | 18 μL of 0.1 M NH4OH/NH4F | NA | 0.22 mL of 0.1 M HNO3 | 18 μL of 0.1 M NH4OH/NH4F | 40 μL of conc. NH4OH | |
| pH | 4 | 3.5 | NA | 5 | NA | 3 | 7 | NA | 3 | 6.5–7 | 8–8.5 | |
| mixing time (h) | 5.5 | 6.5 | 5.5 | 7 | 7 | 22.5 | ∼6 | 7 | 24 | 8 | 5 | |
| b | ethanol (mL) | 5.50 | 5.50 | 5.50 | 5.50 | 5.50 | 5.50 | 5.50 | 5.50 | 5.50 | 5.50 | 5.50 |
| Al(OBus)3 (mL) | 0.801 | 0.801 | 0.801 | 0.800 | 0.800 | 0.860 | 0.860 | 0.860 | 0.842 | 0.814 | 1.544 | |
| Zr(IV) prop (mL) | NA | NA | NA | NA | NA | NA | NA | NA | 0.240 | 0.288 | 0.580 | |
| c | mixing time (h) | 18 | 6.5 | 18 | 18 | 19 | 21 | 11.25 | 18 | 23 | 18.75 | 17 |
| pH after mixing | NA | NA | NA | NA | NA | 1 | NA | NA | 1–1.5 | 2 | 1.5 | |
| d | CaMeEt (mL) | NA | NA | NA | NA | NA | 2.90 | 2.290 | 2.290 | 0.906 | 0.906 | 2.438 |
| NaOEt (mL) | 1.586 | 1.586 | 1.586 | 1.586 | 1.586 | 0.528 | 0.528 | 0.528 | 1.358 | 1.598 | 0.878 | |
| e | mixing time (h) | 6 | 12.15 | 6 | 5.5 | 5.75 | 5.5 | 21.75 | 22.25 | 27 | 7.5 | 31 |
| pH after mixing | NA | NA | NA | NA | NA | 8 | NA | 6.25 | 8 | 11 | 11 | |
| f | gelling agent | 0.19 mL of 0.10 M HNO3, 0.8 mL of conc HNO3, 1.271 mL of H2O | 1.020 mL of H2O | 17 μL of NH4OH/NH4F | 0.3 mL of NH4OH/NH4F, 1.271 mL of H2O | 1.270 mL of H2O | 1.251 mL of H2O | 1.271 mL of H2O | 1.10 mL of NH4OH/NH4F, 1.271 mL of H2O | 1.271 mL of 0.1 M HNO3 | 1.254 mL of 0.1 M HNO3 | 1.572 mL of H2O |
| g | pH after gelling agent addition | 3.25 | 7 | 11 | 10 | 8.5 | 8 | 7 | 8.75 | 8 | 10.5 | 9 |
| h | gelation time (days) | 19 | 5 | 7.25 | 0 | 0 | 2 | 7 | 9 | 1 | 10.5 | 1 |
| i | aging time (days) | |||||||||||
| i.1 | 7 | 7 | 1 | 3 | 14 | 7 | 17 | 3 | 7 | 15 | 30 | |
| i.2 | 31 | 30 | 3 | 7 | 30 | 15 | 17 | 7 | 15 | 49 | 45 | |
| i.3 | 45 | 61 | 15 | 15 | 45 | 45 | 17 | 15 | 47 | 60 | 75 | |
| i.4 | 60 | 75 | 60 | 30 | 76 | 60 | 30 | 30 | 60 | 75 | 90 | |
| 1.5 | NA | NA | NA | NA | NA | NA | 45 | 90 | NA | NA | NA | |
Nonapplicable entries are indicated as NA.
3.2. ICP-OES Measurements
Portions of CJ2.9.A-7, CJ2.9.A-15, CJ3.7.A-17, ISG.3.B-7, ISG.3.B-15, ISG.7.A-47, and ISG.9.B-45 were mixed with KOH and melted at 600 °C. The resulting potassium silicate was dissolved in deionized water at 90 °C and acidified to determine the composition of the samples. Aliquots of these solutions were diluted with 0.1 to 0.3 M HNO3 and analyzed for Al, Ca, K, Na, Si, and Zr concentrations using PerkinElmer Optima 8300 dual-view inductively coupled plasma optical emission spectrometry (ICP-OES) with an Elemental Scientific SC4 DX FAST auto-sampler interface. The instrument was calibrated using standards made by the High-Purity Standards Corporation to generate calibration plots ranging from 50 ppb to 50 ppm. This calibration was verified immediately with initial calibration verification and during sample analysis with a continuous calibration verification run every 10 samples at a minimum as per Hanford Analytical Quality Assurance Requirements Document requirements.47 Calibration blanks were also analyzed after each calibration verification to ensure that background signals and potential carryover effects were not a factor. The calibration was independently verified using standards made by Inorganic Ventures. Mass fractions were calculated using ICP-OES concentrations, known initial masses, and dilution volumes.
3.3. Density Measurements via Pycnometry
Skeletal densities of SCD gels were measured using helium pycnometry on a Micromeritics AccuPyc II 1340 Gas Pycnometer. Ten density measurements were performed and averaged, providing a confidence error interval greater than 99%. Masses were measured on an analytical balance, and then densities were calculated from these values along with a standard deviation.
3.4. SAXS Measurements
Synthetic gels were analyzed using ultrasmall-angle X-ray scattering (USAXS) and small-angle X-ray scattering (SAXS) experiments conducted on beamline 9-ID, station C, at the Advanced Photon Source (Argonne National Laboratory, Argonne, IL, USA). The setup is described elsewhere.48,49 Beamline 9-ID-C is equipped with an advanced-design Bonse–Hart camera for USAXS analysis integrated with fixed-length pinhole SAXS (500 mm) cameras.50 The camera is capable of recording SAXS profiles with an angular resolution of ∼8 × 10⁻⁵ Å–1 in q (scattering vector) ranging from 10–4 to 1.2 Å–1. The scattering vector q (Å–1) is defined in eq 1 and is typically used in small-angle scattering communities to relate to the diffraction angle (2θ)
| 1 |
where λ is wavelength in Å. Using Bragg’s law, the scattering distance d can be determined from q using eq 2 as follows
| 2 |
Incident photons with energy of 21 keV with a corresponding wavelength of 0.5904 Å were used in this study. The USAXS instrument runs a slit-smeared Bonse–Hart setup, and in this experiment, the slit length was 0.027843 Å–1. Slit smearing is included in data analysis models. Three separate analysis locations were analyzed per sample for 5 min each. USAXS and SAXS data were completely corrected for instrumental variations, reduced, and analyzed with Igor Pro (v.7.0.5.2) from WaveMetrics, Inc. (Oswego, OR, USA), coupled with Nika (v.1.74) and Irena (v.2.61) packages.51,52
Data obtained from SAXS represent scattering from the minority phase of a sample or a mixture of scattering from both phases when the phases are in comparable quantities, as defined by Babinet’s principle. SAXS is unable to identify a single phase. Pore fractions are taken as guidelines for what is likely being analyzed, but the true pore fractions at a particular scattering distance remain unknown. Typically, SAXS profiles of samples with pore fractions greater than ∼80% and less than ∼20% are considered to represent exclusively the minority phases, whereas SAXS profiles of samples with all other pore fractions are considered mix. Due to pore fraction analysis by nitrogen gas adsorption techniques on multiple aerogels (see Sections 3.5 and 4.1), the SAXS measurements are considered to represent the skeletal phase for each sol–gel synthesized sample.
Many samples were analyzed with the unified method developed by Beaucage and Schafer.53,54 The unified method models the SAXS distribution intensity I as a hierarchical structure where the small structures build into larger structures. The unified equation for a hierarchical structure with multiple levels is given as follows53
| 3 |
where n is the structure levels, Rgi is the radius of gyration of the ith level, Pi is the power-law exponent, Gi is the Guinier prefactor, and Bi is the prefactor specific to the type of power-law scattering fails. All samples were analyzed using the unified method using one to three structural levels where structure level one begins at the highest q region. From this model, Rg characterizes the size of the scattered material regardless of shape.55 However, Rg relates to the dimension of the scattered material differently, depending on the shape of the particle.
The shape of the scattering material is unknown, and Rg values are presented rather than r values of a predetermined shape. For this study, the Rg value was the most important parameter evaluated from the unified equation. The other values of the other parameters (P, G, and B) can be found in the Supporting Information.
SAXSMorph56 was used to generate three-dimensional representations (cubes) of structures for the samples featured in Figure 4 using known pore fractions and SAXS profiles (see Section 4.4.1). Because the infinite number of structures provides the same SAXS profile, representations produced through SAXSMorph are potential microstructures and are not guaranteed to match the real structure. The structures created are random examples that fit the SAXS data that present structures similar to the real structure. Dimensions of the constructed cubes were defined to be 1000 Å (100 nm) to see small feature changes; input minimum and maximum q values were 0.0005–1.0 Å–1 for each sample. Minimum and maximum q values were chosen to include all relevant features seen on SAXS plots. All other input parameters were left in their default settings. Output files consisted of coordinates for three-dimensional (3D) representations and two-dimensional (2D) cross sections of the 3D representations. Persistence of Vision (POV) free software is used to visualize the representations.57 The samples selected for this analysis fit all of the requirements required for the software as the samples are isotropic, nonperiodic two-phase systems and the q range of the data approaches q–4 at high q.56
Figure 4.

SAXS profile for various samples of compositions (a) CJ2 (CJ2.3.E-61, CJ2.7.E-15, and CJ2.9.B-15), (b) CJ3 (CJ3.3.B-15, CJ3.7.A-17, and CJ3.9.A-15), and (c) ISG (ISG.3.B-15, ISG.7.A-60, and ISG.9.B-45). Locations of Rg values are indicated, and the Rg values are given in Table 6.
3.5. Nitrogen Gas Adsorption Measurements
Nitrogen gas (at 77 K) desorption isotherms of SCD gels were determined using a Micromeritics ASAP 202 Surface Area Analyzer. Pore size distributions (PSD) were determined using the Barrett, Joyner, and Halenda (BJH) method for nitrogen on desorption data.
The data obtained from BJH was similar to the SAXS data in that the data are obtained as differential pore volumes (d(Vp/m)/dD) in cm3·g–1·Å–1 presented as a function of diameter in Å to account for various bin sizes in log scale. Errors of 10% are given to account for instrumental variations based on multiple analyzes on a silica-alumina standard (Micromeritics).
Additionally, the BJH method determined total pore volumes per sample mass (Vp/m in cm3·g–1), which can be used to calculate pore fraction (Φ)
| 4 |
where Vs is the skeletal volume in cm3, and ρs is the skeletal density in g·cm–3.
4. Results and Discussion
4.1. Synthesis Observations and Physical Descriptions of Successful Gels
Table 3 describes synthesis details including reactant volumes, mixing times, and pH values for each successful batch that corresponds to the steps a–i in Figure 1. The goal of the synthesis was to produce viable gels, knowing that multiple additions of various precursor materials could lead to difficulties in maintaining a consistent synthesis method for each pH condition. Many batches failed to gel using initial synthesis conditions, requiring variables such as mixing times and catalyst addition placement to be adjusted. Mixing times were initially targeted to be 5–8 h, but longer mixing durations were required for most batches for at least some of the synthesis steps to form a gel, especially after the addition of Al(OBus)3 in step b.
Because the gels produced in this study are composed of several oxides, catalyst addition placement (whether the catalyst added near the beginning or end) seemed to heavily influence whether a batch would form a gel. Gels at pH 3 were only formed when the catalyst was added after the TEOS addition (step a), and gels at pH 9 formed when NH4OH/NH4F was used as a catalyst after all components were added to the batch (step f). Gels at pH 7 were made when the catalyst was added after TEOS (step a) for CJ3 and ISG gels and, at the end (step f), for CJ2. No ISG gels were created using a catalyst at the end of the experiment.
Throughout the synthesis of the various batches, the measured pH fluctuated from the target pH as more components were added. Attempts were made to control the pH in many batches, especially batches prepared at pH 3, but numerous batches failed due to the formation of precipitates. Only batch CJ2.3.B (which includes samples CJ2.3.B-7 and CJ2.3.B-15) produced a gel after pH was adjusted to its target pH at the end of the synthesis (step f in Table 3) where the gel was yellow-white in color and more mechanically robust than the other gels once SCD. Table 4 lists physical descriptions of color, opacity, and texture for SCD gels, which shows that most samples appeared white and opaque and had textures that were either stiff and brittle or soft and fragile (similar to chalk). Other batches adjusted at the end did not produce a gel but produced precipitates. CJ2.3.B-7 and CJ2.3.B-15 may include precipitates within the gel or may be precipitates themselves and were not compared with the other samples. All other batches, especially those made at pH 3, were not adjusted at the end of the synthesis to avoid precipitates.
Table 4. Physical Observations of Aerogel Samples.
| sample ID | color | opacity | texture |
|---|---|---|---|
| CJ2.3.B-7,15 | yellow-white | mostly opaque | hard and robust |
| CJ2.3.E-61 | white | moderately clear | stiff and brittle |
| CJ2.7.B-15 | white | mostly opaque | stiff and brittle |
| CJ2.9.A-3,7,15,30 | white | opaque | soft and fragile |
| CJ2.9.B-30 | white | opaque | soft and fragile |
| CJ3.3.B-15 | white | opaque | soft and fragile |
| CJ3.7.A-17 | white | opaque | soft and fragile |
| CJ3.9.A-3,15 | white | opaque | soft and fragile |
| ISG.3.B-7,15 | white | mostly clear | stiff and brittle |
| ISG.7.A-15,60 | white | opaque | soft and fragile |
| ISG.9.B-30,45 | white | opaque | soft and fragile |
Selected synthetic gel compositions determined by digestion followed by solution analysis are shown in Table 2 for CJ2.9.A-7, CJ2.9.A-15, CJ3.7.A-17, ISG.3.B-7, ISG.3.B-15, ISG.7.A-47, and ISG.9.B-45. The compositions of the specimens indicate that there was more sodium and less silicon than expected, regardless of the experimental conditions, that is, solution pH and composition. The TEOS may not have fully incorporated into the gel during synthesis, and some residual silicon could have been removed during the washing steps. Although not tested, stirring batches are longer in step a, while increasing reaction heat may improve silicon retention as most of the silicon network is made during step a. Future works could verify this hypothesis to allow for complete TEOS incorporation.
Table 5 shows skeletal density and pore fraction for aerogels representing each composition and pH combination (CJ2.3.E-61, CJ2.7.B-15, CJ2.9.B-15, CJ3.3.B-15, CJ3.7.A-17, CJ3.9.A-15, ISG.3.B-15, ISG.7.A-60, and ISG.9.B-45). The skeletal densities from most of the samples were similar to or slightly higher than the density of amorphous silica (2.2 g·cm–3),58 with the exception of ISG.3.B-15, which had a density of 1.86 ± 0.02 g·cm–3. Skeletal density values (especially ISG.3.B-15) could be lower than actual values due to closed porosities, which were unable to be analyzed with He pycnometry.
Table 5. Skeletal Densities and Pore Fractions for Aerogelsa.
| sample | skeletal density (g·cm–3) | pore fraction |
|---|---|---|
| CJ2.3.E-61 | 2.19 ± 0.02 | 0.81 ± 0.08 |
| CJ2.7.B-15 | 2.16 ± 0.04 | 0.78 ± 0.08 |
| CJ2.9.B-30 | 2.8 ± 0.1 | 0.83 ± 0.08 |
| CJ3.3.B-15 | 2.32 ± 0.05 | 0.76 ± 0.08 |
| CJ3.7.A-17 | 2.31 ± 0.05 | 0.86 ± 0.09 |
| CJ3.9.A-15 | 2.86 ± 0.20 | 0.86 ± 0.09 |
| ISG.3.B-15 | 1.86 ± 0.02 | 0.81 ± 0.08 |
| ISG.7.A-60 | 2.49 ± 0.08 | 0.83 ± 0.08 |
| ISG.9.B-45 | 2.16 ± 0.03 | 0.79 ± 0.08 |
Errors are given as two standard deviations after multiple analyzes.
4.2. Structural Comparisons of Alcogels and Aerogels
Gel structures of alcogels (samples immersed in EtOH, designated by superscript E following their names) were compared with aerogels from the same sample to compare gel structures. In Figure 2a–e, SAXS profiles are shown for CJ2.3.E-61E and CJ2.3.E-61, CJ2.7.B-15E and CJ2.7.B-15, CJ3.3.B-15E and CJ2.7.B-15, CJ3.7.A-17E and CJ3.7.A-17, ISG.3.B-15E and ISG.B.A-15, and ISG.9.B-45E and ISG.9.B-45, respectively, where the alcogels are indicated in red, and aerogels are indicated in blue. For q values greater than 0.2 Å–1 in Figure 2a–f, the intensities of the alcogels deviate from the intensities of their corresponding aerogel. This observation is consistent with previous studies such as those by Perissinotto et al. and Vollet et al., which concluded electronic density fluctuations caused by imperfect solvent exchange at the molecular level could be an explanation for the change in the slope for the SCD samples.59,60
Figure 2.

SAXS profile showing intensity and q values for alcogel and aerogel samples from the sample batch including (a) CJ2.3.E-61 and CJ2.3.E-61E, (b) CJ2.7.B-15 and CJ2.7.B-15E, (c) CJ3.3.B-15 and CJ3.3.B-15E, (d) CJ3.7.A-17 and CJ3.7.A-17E, (e) ISG.3.B-15 and ISG.3.B-15E, and (f) ISG.9.B-45 and ISG.9.B-45E. All alcogel samples (denoted by superscript E at the end of the sample name) are indicated by red lines, and aerogel samples are indicated by blue lines.
4.3. Influence of Sample Aging on the Aerogel Structure
Gel structures of samples from the same batch aged for different durations were analyzed with SAXS to examine aging effects on the pore structure. CJ2.9 was chosen for analysis because CJ2 is the simplest composition and pH 9 samples were the most straightforward samples to synthesize. Figure 3 shows the SAXS profiles for CJ2.9.A-3, CJ2.9.A-7, CJ2.9.A-15, and CJ2.9.A-30, with important Rg locations indicated. Table 6 shows the Rg values fitted for Figure 3. All samples in this series exhibit similar scattering behavior with minor variations in Rg parameters for most of the q range. In the highest q region of Figure 3 (q > 1 Å–1), atomic structural features associated with amorphous silica become less defined as aging time increases. Although the large structural components (q < 1 Å–1) of the samples remain relatively unchanged as time changes, the structures on the atomic level are becoming more amorphous. Previous studies have shown that condensation reactions continue long after gelation in silica gels due to the large concentration of hydroxyl groups in a process known as polymerization.24,61−63 Variations between samples observed in Figure 3 are likely due to polymerization of labile hydroxyl groups within the gel structure, although the large components of the structure remain unchanged.
Figure 3.
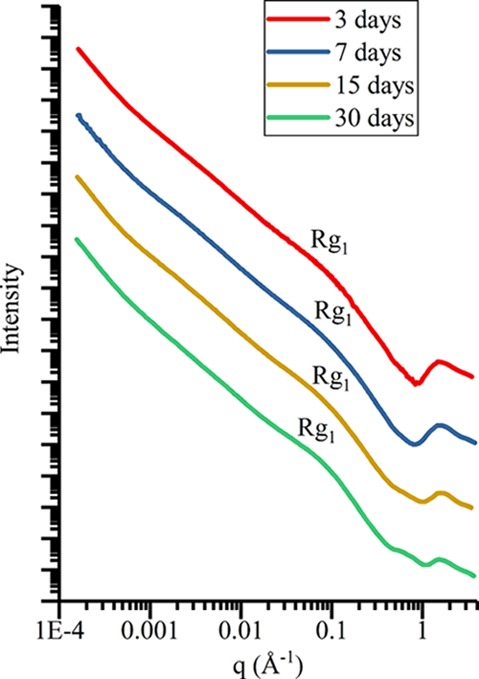
SAXS profiles for samples aged for various times (3, 7, 15, and 30 days) in batch CJ2.9.A (i.e., CJ2.9.A-3, CJ2.9.A-7, CJ2.9.A-15, and CJ2.9.A-30). Locations of significant Rg features are indicated, and the Rg values are given in Table 6.
Table 6. SAXS Rg Values of CJ2.9.A-3, CJ2.9.A-7, CJ2.9.A-15, and CJ2.9.A-30 To Accompany Figure 3 and CJ2.3.E-61, CJ2.7.B-15, CJ2.9.B-30, CJ3.3.B-15, CJ3.7.A-17, CJ3.9.A-15, ISG.3.B-15, ISG.7.A-60, and ISG.9.B-45 To Accompany Figure 4a.
| figure | sample | Rg1 (Å) | Rg2 (Å) | Rg3 (Å) |
|---|---|---|---|---|
| 3 | CJ2.9.A-3 | 18.9 ± 0.9 | ||
| CJ2.9.A-7 | 18 ± 4 | |||
| CJ2.9.A-15b | 33.2 ± 0.1 | |||
| CJ2.9.A-30b | 29.68 ± 0.06 | |||
| 4 | CJ2.3.E-61b | 19.05 ± 0.07 | 117.9 ± 0.2 | 987 ± 2 |
| CJ2.7.B-15b | 6.200 ± 0.001 | 149.6 ± 0.1 | ||
| CJ2.9.B-30 | 25.4 ± 0.2 | 5000 ± 3000 | ||
| CJ3.3.B-15 | 29 ± 3 | |||
| CJ3.7.A-17 | 16 ± 2 | 260 ± 50 | ||
| CJ3.9.A-15b | 28.0 ± 0.8 | 1943 ± 8 | ||
| ISG.3.B-15 | 8 ± 1 | 74 ± 2 | ||
| ISG.7.A-60 | 16 ± 2 | |||
| ISG.9.B-45 | 15 ± 4 | 430 ± 40 |
Errors for Rg values are reported as two standard derivations of fits of multiple replicates of the each sample, unless otherwise indicated.
Error is due to fitting uncertainties because of lack of duplicates.
4.4. Influences of Elemental Composition and pH
To investigate composition and pH effects on gel and pore structures, aerogels featured in Table 5 were examined with SAXS and gas absorption analyses since each composition and pH combination are represented. The samples investigated consist of CJ2.3.E-61, CJ2.7.B-15, CJ2.9.B-15, CJ3.3.B-15, CJ3.7.A-17, CJ3.9.A-15, ISG.3.B-15, ISG.7.A-60, and ISG.9.B-45. Although the samples were aged for various times, aging was shown to have little to no impact (Section 4.3).
4.4.1. Gel Structure Investigations Using SAXS Analysis
Figure 4a–c shows the SAXS profiles for compositions CJ2 (CJ2.3.E-61, CJ2.7.E-15, and CJ2.9.B-15), CJ3 (CJ3.3.B-15, CJ3.7.A-17, and CJ3.9.A-15), and ISG (ISG.3.B-15, ISG.7.A-60, and ISG.9.B-45), respectively, and locations of Rg knees. Table 6 shows the Rg values associated with the samples in Figure 4. The SAXS profiles of all the samples exhibit similar scattering behavior in the high q regions (approximately q > 0.1 Å–1), showing faint Rg1 knees, which may represent small dimer or trimer species as their Rg1 values are within the range of 5–30 Å, which are incorporated in larger primary particles. However, the SAXS profiles of the samples vary in the mid q region (approximately 0.1 Å–1 > q > 0.001 Å–1) and the low q region (approximately q < 0.0001 Å–1).
4.4.1.1. pH Effects for CJ2 Aerogels
In Figure 4a, SAXS profiles of CJ2.3.E-61 and CJ2.7.B-15 each have distinct Rg2 knees in the mid q range, which represent primary particles whose sizes are indicated in Table 6. In the lower q region adjacent to the Rg2 curve, the CJ2.7.B-15 profile shows stagnation in intensity (which is evidenced by a “shelf” in the profile) before the intensity increases, indicating that the Rg2 curve represents a distinct maximum primary particle size and the increase in intensity in the q < 0.001 Å–1 range represents scattering of multiple primary particles analyzed at larger scattering distances.
The intensity stagnation shelf following the Rg2 curve of CJ2.3.E-61 is smaller as the intensity increases at a higher q than in the CJ2.7.B-15 SAXS profile. Another Rg curve (Rg3) for CJ2.3.E-61 is present, although no visible intensity stagnation shelf is present as intensity continues to increase as q decreases. This implies that Rg2 represents a major primary particle size and Rg3 could either represent a larger primary particle size or scattering of multiple smaller primary particles. Because the intensity stagnation shelf between the Rg2 and Rg3 knees is so small, determining which option is more likely is difficult.
The fitting of the Rg2 curve on the CJ2.9.B-30 profile has high uncertainty (as seen in Table 6) and shows no intensity stagnation shelf. Because the Rg2 value is so large, it likely represents the scattering of multiple primary particles rather than a single particle. Since there are no Rg knees detected before Rg2, the primary particles in CJ2.9.B-30 appear to have a distinct maximum size as in CJ2.7.B-15 but vary greatly in sizes across several decades of q.
Out of the samples analyzed in Figure 4a, only CJ2.7.B-15 showed one definitive maximum primary particle size (defined by the Rg2 curve). While CJ2.3.E-61 showed a major primary particle size (also defined by the Rg2 curve), the Rg3 curve brings forward questions about whether a larger primary particle size exists in CJ2.3.E-61. If the Rg3 curve of the CJ2.3.E-61 represents scattering of multiple smaller primary particles, then the Rg2 curve could represent the maximum primary particle size. If that is the case, then the maximum particle size of CJ2.7.B-15 would be larger than the maximum primary particle size of CJ2.3.E-61, which is consistent with trends in primary particle sizes for simple sol–gel synthesized aerogels in that gels made at lower pH have smaller primary particles.
4.4.1.2. pH Effects for CJ3 Aerogels
In Figure 4b, the CJ3.3.B-15 profile shows that a small intensity stagnation shelf following its Rg1 could be a specific small structure (dimer or trimer species) that incorporates itself into structures with sizes ranging across several decades of q instead of forming larger distinct maximum primary particles. Like CJ2.3.E-61 and CJ2.7.B-15 in Figure 4a, the CJ3.7.A-17 SAXS profile exhibits an Rg2 curve followed by an intensity stagnation shelf representing a maximum primary particle size for the sample. Although a faint Rg2 curve is indicated on the CJ3.9.A-15, the certainty of its existence is suspicious as Rg curve fitting could only be performed on one of the three SAXS profile replicates of CJ3.9.A-15 and the uncertainty given in Table 6 is attributed only to fitting uncertainty in Irena. If the Rg2 curve of CJ3.9.A-15 is real, then it could represent a large structure composed of smaller primary particles of various sizes. Without knowing the true uncertainty of the Rg2 curve for CJ3.9.A-15, any proposed explanation is highly speculative.
4.4.1.3. pH Effects for ISG Aerogels
In the mid q region of Figure 4c, SAXS profiles of ISG.3.B-15 and ISG.9.B-45 each have distinct Rg2 knees followed by intensity stagnation shelves (again representing maximum primary particles sizes), with Rg values indicated in Table 6. Like CJ3.3.B-15 in Figure 4b, no Rg knees could be assigned to the ISG.7.A-60 profile in the mid and low q ranges, so the primary particles may not have a distinct maximum size but vary greatly in sizes across several decades of q. Based on Rg2 values given in Table 6, ISG.9.B-45 has larger primary particles than ISG.3.B-15, which is consistent with the trend expected with simple sol–gel synthesized aerogels, although ISG.7.A-60 shows no distinct primary particle size to compare to.
4.4.1.4. Composition Effects on Aerogels Synthesized at pH 3
Considering the samples of various compositions made at pH 3 in Figure 4, ISG.3.B-15 has a smaller maximum primary particle size (Rg2 value) in comparison to the primary particle sizes in CJ2.3.E-61. ISG.3.B-15 and CJ2.3.E-61 have similar compositions where ISG.3.B-15 was made with less Na than CJ2.3.E-61 to account for the addition of Zr and Ca. The pH recorded in step a in ISG.3.B synthesis in Table 3 is slightly lower than the pH recorded for CJ2.3.E-61 in synthesis step a, which could explain the difference in Rg2 values rather than significant composition changes. Large amounts of Ca and lower amounts of Na in CJ3.3.B-15 likely affected the gel structure in comparison to CJ2.3.B-15 and ISG.3.B-15, which could explain the lack of a maximum primary particle size for CJ3.3.B-15 at pH 3.
4.4.1.5. Composition Effects on Aerogels Synthesized at pH 7
For gels in Figure 4 prepared at a targeted pH 7, CJ3.7.A-17 shows a larger maximum primary particle size (Rg2) than the maximum primary particle size for CJ2.7.B-15 (see Table 6). Initial pH was not measured for CJ2.7.B, resulting in difficulty in understanding how the primary particles were influenced by addition of a catalyst. However, synthesis step a in Table 3 of batch CJ2.9.A is identical to that of CJ2.7.B except that the pH of the batch was measured in CJ2.9.A. The pH measured for CJ2.9.A was 5 in synthesis step a, so the pH for CJ2.7.B in synthesis step a is likely pH 5 also. Meanwhile, Table 3 also shows that CJ3.7.A had a pH value of 7 during step a. Primary particles would be expected to be larger in simple silica gels made at higher pH, which suggests that initial pH likely impacted the difference in maximum primary particle sizes between CJ2.7.B-15 and CJ3.7.A-17 rather than the composition effect of Ca addition at pH 7. No maximum primary particle size was determined for ISG.7.A-60.
The addition of Zr may have caused the discrepancy between ISG.7.A-60 and CJ3.7.A-17. The catalyst was added in synthesis step a for both CJ3.7.A-17 and ISG.7.A-60, which allowed the pH to be near pH 7 in each synthesis batch, eliminating any initial pH effects. Previous work has shown that increasing Zr/Si ratios in gels synthesized via the sol–gel method lead to larger pores and decreased surface areas,64 which suggests that Zr would have an effect on the gel structure. A future study may be conducted on gels of increasing Zr concentration relevant to this system to further observe the effects of Zr on the gel structure.
4.4.1.6. Composition Effects on Aerogels Synthesized at pH 9
Out of the samples in Figure 4 prepared at pH 9, only ISG.9.B-45 had its catalyst added in the beginning of the synthesis (step a in Table 3) as opposed to the end (step f in Table 3), which may have greatly impacted the formation of primary particles in the gel. ISG.9.B-45 shows a significant intensity stagnation shelf following the Rg2, whereas CJ2.9.B-30 and CJ3.9.A-15 do not. CJ2.9.B-30 and CJ3.9.A-30 have similar SAXS profiles despite CJ3.9.A-30 containing Ca and significantly less Na than CJ2.9.B-30, implying that mixture pH may have a greater impact in gel structure formation than composition at pH 9.
4.4.2. Physical Representations of Gel Structures
Figure 5a–c shows 3D representations with dimensions of 1000 Å × 1000 Å × 1000 Å and 2D cross sections of the 3D structures (1000 Å × 1000 Å) of sol–gel synthesized gels for compositions CJ2 (CJ2.3.E-61, CJ2.7.E-15, and CJ2.9.B-15), CJ3 (CJ3.3.B-15, CJ3.7.A-17, and CJ3.9.A-15), and ISG (ISG.3.B-15, ISG.7.A-60, and ISG.9.B-45), respectively. As described in Section 3.4, the 3D structures are generated from SAXS data, and known pore fractions for which Figure 5 was generated using the SAXS profiles in Figure 4 and the pore fractions in Table 5. The relationships between Rg knees and maximum primary particle described in Section 4.4.1 are clearly illustrated in Figure 5. For example, Figure 5a shows that the primary particles in CJ2.9.B-30 are larger than those in CJ2.3.E-61 and CJ2.7.B-15, which is expected based on the Rg2 knees in Figure 5a. However, the primary particle differences between CJ2.3.E-61 and CJ2.7.B-15 are more difficult to see due to the existence of Rg3 in CJ2.3.E-61.
Figure 5.
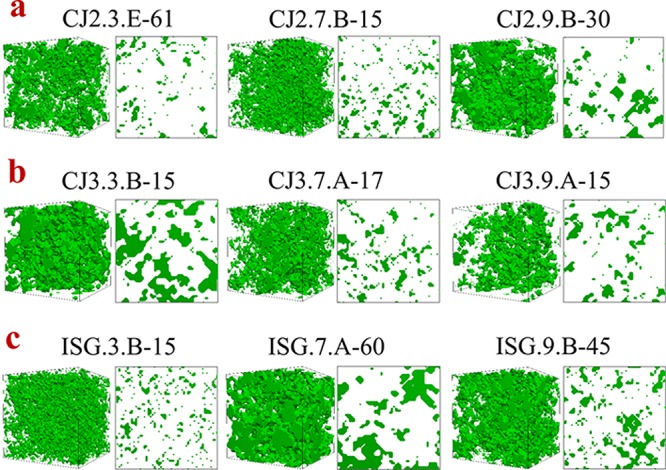
SAXSMorph 3D representations with dimensions of 1000 Å × 1000 Å × 1000 Å and 2D cross sections of the 3D structures (1000 Å × 1000 Å) of sol–gel synthesized gels for compositions (a) CJ2 (CJ2.3.E-61, CJ2.7.E-15, and CJ2.9.B-15), (b) CJ3 (CJ3.3.B-15, CJ3.7.A-17, and CJ3.9.A-15), and (c) ISG (ISG.3.B-15, ISG.7.A-60, and ISG.9.B-45). Green represents a solid material, whereas white represents pores.
Rg values (especially Rg2 values) are good indicators for the maximum primary particle size, although there are limitations that can be seen in Figure 5 for CJ3.3.B-15 and ISG.7.A-60. In Section 4.4.1, the SAXS profiles CJ3.3.B-15 and ISG.7.A-60 did not have Rg knees beyond Rg1, which indicated that there were no maximum primary particles. Instead, the samples were composed of primary particles that spanned several decades of sizes. The 3D structures in Figure 5 for CJ3.3.B-15 and ISG.7.A-60 illustrate what this effect looks like physically, which is not intuitive when simply evaluating Rg values.
4.4.3. Pore Analysis of Synthetic Gels
To investigate composition and pH effects on the pores of the samples, the BJH gas adsorption method was used to analyze the pores of samples in Table 5. Figure 6a–c shows BJH distribution plots for samples of compositions CJ2 (CJ2.3.E-61, CJ2.7.E-15, and CJ2.9.B-15), CJ3 (CJ3.3.B-15, CJ3.7.A-17, and CJ3.9.A-15), and ISG (ISG.3.B-15, ISG.7.A-60, and ISG.9.B-45) with 10% error, respectively. These measurements only reflect open pores, so they may not reflect the true pore sizes within the gels.
Figure 6.

Barrett, Joyner, and Halenda (BJH) pore size distribution plots for samples of compositions (a) CJ2 (CJ2.3.E-61, CJ2.7.E-15, and CJ2.9.B-15), (b) CJ3 (CJ3.3.B-15, CJ3.7.A-17, and CJ3.9.A-15), and (c) ISG (ISG.3.B-15, ISG.7.A-60, and ISG.9.B-45) with 10% error.
In all compositions, the samples made at pH 3 had the narrowest distribution compared to the samples made at pH 7 and 9, which had broader distributions across the measurable range of 20 to 1200 Å. The samples made at pH 9 (CJ2.9.B-30, CJ3.9.A-15, and ISG.9.B-45) have more large pores (pores > 400 Å) than the samples made at pH 3 (CJ2.3.E-61, CJ3.3.B-15, and ISG.3.B-15) and pH 7 (CJ2.7.B-15, CJ3.7.A-17, and ISG.7.A-60). ISG.7.A-60 has close to the same amount of large pores as ISG.9.B-45 but has more large pores (pores > 400 Å) than in CJ2.7.B-15 and CJ3.7.A-17. For CJ2 and ISG samples, the same pore size (∼200 Å for CJ2 and ∼150 Å for ISG) is the most abundant size measured. The most abundant pore size for CJ3.3.B-15 is less than the most abundant pore sizes for CJ3.7.A-17 and CJ3.9.A-15. The most abundant pore size for CJ3.7.A-17 is larger than that for CJ3.9.A-15, but the distribution for CJ3.9.A-15 is broader and extends to larger pore sizes. No systemic correlation was observed between pH and composition for these samples. Batch pH affected pore sizes differently for each composition, and composition did not appear to uniformly affect pore sizes for samples made under similar pH environments.
5. Summary and Conclusions
In this study, synthetic gels with custom compositions relevant to altered nuclear waste glasses were successfully made by sequential additions of organometallic precursors to a single reaction vessel. This study focused entirely on the synthesis and characterizations of the synthetic gels alone, while a separate study will compare the gels produced in this work with glass alteration layers of similar compositions formed under comparable conditions. Other studies have determined pore sizes of alteration layers ranging from <1 to 8 nm8,15,65−68 where the large variability in pore sizes is due to multiple compositions of pristine glasses being altered in various conditions. In general, the pore sizes of the aerogels in this study (<1 to >10 nm) are consistent with the pore sizes seen for glass alteration layers. Further pore analysis of glass alteration layers relevant to the aerogels in this study would reduce the large pore size variability of alteration layers.
The pH throughout aerogel synthesis proved very difficult to control. Most batches would form a gel only if the pH was allowed to freely fluctuate throughout the synthesis. Although the gel structures were likely affected by fluctuating pH, the pH during the initial mixing of the batch (after TEOS is added but before Al(OBus)3) seemed to vary with primary particle sizes more consistently than any other variable evaluated. Literature shows that simple silicate gels made under basic conditions are composed of polymeric clusters, whereas samples synthesized under acid conditions values are composed of entangled linear or randomly branched polymers, which imply that the basic synthesized gels are composed of particles larger than those in acid synthesized gels.25,32,44,69 This trend was seen for compositions CJ2 and ISG at lower pH where gels made at target pH 3 (where pH was ∼3 during the initial step in batch synthesis) had smaller primary particle sizes than other gels made at target pH values 7 and 9 and gels with CJ2 and CJ3 compositions at higher pH where gels made at target pH 9 had larger primary particles sizes than the gels made at target pH 7.
No consistent trends were observed for composition variances for particle and pore sizes. Because CJ3 and ISG samples contain more components in the composition than CJ2, the additional components of Ca and Zr likely influenced the gel structure more than Si, Al, and Na. Although studies have discussed the effects of Zr and Ca on gels with Si,24,70−72 no studies have been found to discuss the effects of Zr and Ca within a matrix containing Al and Na also. Thus, Zr and Ca coordination with gel structures is difficult to predict. Future studies could be done to determine these effects.
Aging appeared to cause little to no difference in primary particle size distributions, whereas SCD samples (aerogels) had fewer small primary particles compared to EtOH-immersed samples (alcogels).
Acknowledgments
This research used resources of the Advanced Photon Source, a U.S. Department of Energy (DOE) Office of Science User Facility operated for the DOE Office of Science by Argonne National Laboratory under contract no. DE-AC02-06CH11357. The authors would like to thank Jan Ilavsky and the staff at beamline 9ID-B,C for their assistance with instrumentation and data analysis. Additionally, the authors would like to thank Brian Riley, Jared Kroll, and Jacob Peterson for the use of their laboratory and their assistance during the synthesis and SCD portions of this work. This work was jointly funded by the U.S. Department of Energy Office of Nuclear Energy (Materials Recovery and Waste Form Development) and the Office of Environmental Management (Tank Waste Management, EM-21). Pacific Northwest National Laboratory is a multiprogram national laboratory operated for the U.S. Department of Energy by Battelle Memorial Institute under contract no. DE-AC06-76RLO 1830.
Supporting Information Available
The Supporting Information is available free of charge on the ACS Publications website at DOI: 10.1021/acsomega.9b00491.
The authors declare no competing financial interest.
Supplementary Material
References
- Erol-taygun M.; Zheng K.; Boccaccini A. R. Nanoscale Bioactive Glasses in Medical Applications. Int. J. Appl. Glas. Sci. 2013, 4, 136–148. 10.1111/ijag.12029. [DOI] [Google Scholar]
- Hench L. L.; Day D. E.; Höland W.; Rheinberger V. M Glass and Medicine. Int. J. Appl. Glas. Sci. 2010, 1, 104–117. 10.1111/j.2041-1294.2010.00001.x. [DOI] [Google Scholar]
- Ferrari M.; Righini G. C. Glass-Ceramic Materials for Guided-Wave Optics. Int. J. Appl. Glas. Sci. 2015, 6, 240–248. 10.1111/ijag.12129. [DOI] [Google Scholar]
- Gin S.; Abdelouas A.; Criscenti L. J.; Ebert W. L.; Ferrand K.; Geisler T.; Harrison M. T.; Inagaki Y.; Mitsui S.; Mueller K. T.; et al. An International Initiative on Long-Term Behavior of High-Level Nuclear Waste Glass. Mater. Today 2013, 16, 243–248. 10.1016/j.mattod.2013.06.008. [DOI] [Google Scholar]
- Vienna J. D.; Ryan J. V.; Gin S.; Inagaki Y. Current Understanding and Remaining Challenges in Modeling Long-Term Degradation of Borosilicate Nuclear Waste Glasses. Int. J. Appl. Glas. Sci. 2013, 4, 283–294. 10.1111/ijag.12050. [DOI] [Google Scholar]
- Grambow B. Nuclear Waste Glasses- How Durable. Elements 2006, 2, 357–364. 10.2113/gselements.2.6.357. [DOI] [Google Scholar]
- Poinssot C.; Gin S. Long-Term Behavior Science: The Cornerstone Approach for Reliably Assessing the Long-Term Performance of Nuclear Waste. J. Nucl. Mater. 2012, 420, 182–192. 10.1016/j.jnucmat.2011.09.012. [DOI] [Google Scholar]
- Gin S.; Collin M.; Jollivet P.; Fournier M.; Minet Y.; Dupuy L.; Mahadevan T.; Kerisit S.; Du J. Dynamics of Self-Reorganization Explains Passivation of Silicate Glasses. Nat. Commun. 2018, 9, 2169. 10.1038/s41467-018-04511-2. [DOI] [PMC free article] [PubMed] [Google Scholar]
- Geisler T.; Dohmen L.; Lenting C.; Fritzsche M. B. K. Real-time in Situ Observations of Reaction and Transport Phenomena during Silicate Glass Corrosion by Fluid-Cell Raman Spectroscopy. Nat. Mater. 2019, 18, 342. 10.1038/s41563-019-0293-8. [DOI] [PubMed] [Google Scholar]
- Conradt R. Chemical Durability of Oxide Glasses in Aqueous Solutions: A Review. J. Am. Ceram. Soc. 2008, 91, 728–735. 10.1111/j.1551-2916.2007.02101.x. [DOI] [Google Scholar]
- Gin S.; Guittonneau C.; Godon N.; Neff D.; Rebiscoul D.; Cabíe M.; Mostefaoui S. Nuclear Glass Durability: New Insight into Alteration Layer Properties. J. Phys. Chem. C 2011, 115, 18696–18706. 10.1021/jp205477q. [DOI] [Google Scholar]
- Gin S. Open Scientific Questions about Nuclear Glass Corrosion. Procedia Mater. Sci. 2014, 7, 163–171. 10.1016/j.mspro.2014.10.022. [DOI] [Google Scholar]
- Gin S.; Frugier P.; Jollivet P.; Bruguier F.; Curti E. New Insight into the Residual Rate of Borosilicate Glasses: Effect of s/v and Glass Composition. Int. J. Appl. Glas. Sci. 2013, 4, 371–382. 10.1111/ijag.12048. [DOI] [Google Scholar]
- Gin S.; Gordon N.; Ribet I.; Jollivet P.; Minet Y.; Frugier P.; Vernaz E.; Cavedon J. M.; Bonin B.; Do Quang R. Long-Term Behavior of R7T7-Type Nuclear Glass : Current State of Knowledge and Outlook. Mater. Res. Soc. Symponisum Proc. 2004, 824, 1–6. 10.1557/PROC-824-CC5.7. [DOI] [Google Scholar]
- Rebiscoul D.; Van der Lee A.; Rieutord F.; Né F.; Spalla O.; El-Mansouri A.; Frugier P.; Ayral A.; Gin S. Morphological Evolution of Alteration Layers Formed during Nuclear Glass Alteration: New Evidence of a Gel as a Diffusive Barrier. J. Nucl. Mater. 2004, 326, 9–18. 10.1016/j.jnucmat.2003.10.015. [DOI] [Google Scholar]
- Gin S.; Ryan J. V.; Schreiber D. K.; Neeway J.; Cabié M. Contribution of Atom-Probe Tomography to a Better Understanding of Glass Alteration Mechanisms: Application to a Nuclear Glass Specimen Altered 25years in a Granitic Environment. Chem. Geol. 2013, 349-350, 99–109. 10.1016/j.chemgeo.2013.04.001. [DOI] [Google Scholar]
- Lenting C.; Plümper O.; Kilburn M.; Plümper O.; Guagliardo P.; Klinkenberg M.; Geisler T. Towards a Unifying Mechanistic Model for Silicate Glass Corrosion. npj Mater. Degrad. 2018, 2, 28. 10.1038/s41529-018-0048-z. [DOI] [Google Scholar]
- Geisler T.; Nagel T.; Kilburn M. R.; Janssen A.; Icenhower J. P.; Fonseca R. O. C.; Grange M.; Nemchin A. A. The Mechanism of Borosilicate Glass Corrosion Revisited. Geochim. Cosmochim. Acta 2015, 158, 112–129. 10.1016/j.gca.2015.02.039. [DOI] [Google Scholar]
- Angeli F.; Gaillard M.; Jollivet P.; Charpentier T. Influence of Glass Composition and Alteration Solution on Leached Silicate Glass Structure: A Solid-State NMR Investigation. Geochim. Cosmochim. Acta 2006, 70, 2577–2590. 10.1016/j.gca.2006.02.023. [DOI] [Google Scholar]
- Arab M.; Cailleteau C.; Angeli F.; Devreux F.; Girard L.; Spalla O. Aqueous Alteration of Five-Oxide Silicate Glasses: Experimental Approach and Monte Carlo Modeling. J. Non-Cryst. Solids 2008, 354, 155–161. 10.1016/j.jnoncrysol.2007.06.095. [DOI] [Google Scholar]
- Kaspar T. C.; Reiser J. T.; Ryan J. V; Wall N. A. Non-Destructive Characterization of Corroded Glass Surfaces by Spectroscopic Ellipsometry. J. Non-Cryst. Solids 2018, 481, 260–266. 10.1016/j.jnoncrysol.2017.10.054. [DOI] [Google Scholar]
- Gin S.; Jollivet P.; Fournier M.; Berthon C.; Wang Z.; Mitroshkov A.; Zhu Z.; Ryan J. V. The Fate of Silicon during Glass Corrosion under Alkaline Conditions: A Mechanistic and Kinetic Study with the International Simple Glass. Geochim. Cosmochim. Acta 2015, 151, 68–85. 10.1016/j.gca.2014.12.009. [DOI] [Google Scholar]
- Iler R. K.The Chemistry of Silica: Solubility, Polymerization, Colloid and Surface Properties, and Biochemistry, 1st ed.; John Wiley & Sons, Inc.: New York, 1979. [Google Scholar]
- Brinker C. J.; Scherer G. W.. Sol-Gel Science: The Physics and Chemistry of Sol-Gel Processing, 1st ed.; Academic Press, Inc.: San Diego, 1990. [Google Scholar]
- Buckley A.; Greenblatt M. The Sol-Gel Preparation of Silica Gels. J. Chem. Ed. 1994, 71, 599–602. 10.1021/ed071p599. [DOI] [Google Scholar]
- Klein L. C. Sol-Gel Processing of Silicates. Annu. Rev. Mater. Sci. 1985, 15, 227–248. 10.1146/annurev.ms.15.080185.001303. [DOI] [Google Scholar]
- Soleimani Dorcheh A.; Abbasi M. H. Silica Aerogel; Synthesis, Properties and Characterization. J. Mater. Process. Technol. 2008, 199, 10–26. 10.1016/j.jmatprotec.2007.10.060. [DOI] [Google Scholar]
- Gesser H. D.; Goswami P. C. Aerogels and Related Porous Materials. Chem. Rev. 1989, 89, 765–788. 10.1021/cr00094a003. [DOI] [Google Scholar]
- Woignier T.; Despetis F.; Alaoui A.; Etienne P.; Phalippou J. Mechanical Properties of Gel-Derived Materials. J. Sol-Gel Sci. Technol. 2000, 19, 163–169. 10.1023/A:1008763616716. [DOI] [Google Scholar]
- Gin S.; Beaudoux X.; Angéli F.; Jégou C.; Godon N. Effect of Composition on the Short-Term and Long-Term Dissolution Rates of Ten Borosilicate Glasses of Increasing Complexity from 3 to 30 Oxides. J. Non-Cryst. Solids 2012, 358, 2559–2570. 10.1016/j.jnoncrysol.2012.05.024. [DOI] [Google Scholar]
- Livage J.; Sanchez C. Sol-Gel Chemistry. J. Non-Cryst. Solids 1992, 145, 11–19. 10.1016/S0022-3093(05)80422-3. [DOI] [Google Scholar]
- Brinker C. J.; Keefer K. D.; Schaefer D. W.; Assink R. A.; Kay B. D.; Ashley C. S. Sol-Gel Transition in Simple Silicates II. J. Non-Cryst. Solids 1984, 63, 45–59. 10.1016/0022-3093(84)90385-5. [DOI] [Google Scholar]
- Irwin A. D.; Holmgren J. S.; Jonas J. 27Al and 29Si NMR Study of Sol-Gel Derived Aluminosilicates and Sodium Aluminosilicates. J. Mater. Sci. 1988, 23, 2908–2912. 10.1007/BF00547467. [DOI] [Google Scholar]
- Yoldas B. E. Monolithic Glass Formation by Chemical Polymerization. J. Mater. Sci. 1979, 14, 1843–1849. 10.1007/BF00551023. [DOI] [Google Scholar]
- Yoldas B. E. Preparation of Glasses and Ceramics from Metal-Organic Compounds. J. Mater. Sci. 1977, 12, 1203–1208. 10.1007/PL00020396. [DOI] [Google Scholar]
- Thomas I. M.Method for Producing Glass Ceramics. 3,791,808, 1971.
- Riley B. J.; Kroll J. O.; Peterson J. A.; Matyáš J.; Olszta M. J.; Li X.; Vienna J. D. Silver-Loaded Aluminosilicate Aerogels As Iodine Sorbents. Appl. Mater. Interfaces 2017, 9, 32907–32919. 10.1021/acsami.7b10290. [DOI] [PubMed] [Google Scholar]
- Carta D.; Pickup D. M.; Knowles J. C.; Smith M. E.; Newport R. J. Sol–gel Synthesis of the P2O5–CaO–Na2O–SiO2 System as a Novel Bioresorbable Glass. J. Mater. Chem. 2005, 15, 2134–2140. 10.1039/b414885a. [DOI] [Google Scholar]
- Adams L. A.; Essien E. R.; Shaibu R. O.; Oki A. Sol-Gel Synthesis of SiO2-CaO-Na2O-P2O5 Bioactive Glass Ceramic from Sodium Metasilicate. New J. Glas. Ceram. 2013, 03, 11–15. 10.4236/njgc.2013.31003. [DOI] [Google Scholar]
- Kamiya K.; Sakka S.; Tatemichi Y. Preparation of Glass Fibres of the ZrO2-SiO2 and Na2O-ZrO2-SiO2 Systems from Metal Alkoxides and Their Resistance to Alkaline Solution. J. Mater. Sci. 1980, 15, 1765–1771. 10.1007/BF00550596. [DOI] [Google Scholar]
- Guizard C.; Cygankiewicz N.; Larbot A.; Cot L. Sol-Gel transition in Zirconia Systems Using Physical and Chemical Processes. J. Non-Cryst. Solids 1986, 82, 86–91. 10.1016/0022-3093(86)90114-6. [DOI] [Google Scholar]
- Abou-El-Sherbini K. S.; Weidler P. G.; Schiel D.; Amr M. H.; Niemann H.; El-dafrawy S.; Höll W. H.. Stabilization of Silica Gel against Hydrolysis by Doping with F – or Zr ( IV ). 2014, 2014 ( (February), ), 24–32, 10.4236/gsc.2014.41005. [DOI]
- Brinker C. J.; Roth E. P.; Scherer G. W.; Tallant D. R. Structural Evolution during the Gel to Glass Conversion. J. Non-Cryst. Solids 1985, 71, 171–185. 10.1016/0022-3093(85)90286-8. [DOI] [Google Scholar]
- Brinker C. J.; Keefer K. D.; Schaefer D. W.; Assink R. A.; Kay B. D.; Ashley C. S. Sol-Gel Transition in Simple Silicates. J. Non-Cryst. Solids 1982, 48, 47–64. 10.1016/0022-3093(82)90245-9. [DOI] [Google Scholar]
- Silica Aerogel (TEOS, Base-Catalyzed), http://www.aerogel.org/?p=1027 (accessed 1 January 2016).
- Tewari P. H.; Hunt A. J.; Lofftus K. D. Ambient-Temperature Supercritical Drying of Transparent Silica Aerogels. Mater. Lett. 1985, 3, 363–367. 10.1016/0167-577X(85)90077-1. [DOI] [Google Scholar]
- Hanford Analytical Services Quality Assurance Requirements Document; Richland W. A., Ed.; U.S. Department of Energy: Richland, Washington, 2014; Vol. 4. [Google Scholar]
- Ilavsky J.; Jemian P. R.; Allen A. J.; Zhang F.; Levine L. E.; Long G. G. Ultra-Small-Angle X-Ray Scattering at the Advanced Photon Source. Appl. Crystallogr. 2009, 42, 469–479. 10.1107/S0021889809008802. [DOI] [Google Scholar]
- Ilavsky J.; Zhang F.; Allen A. J.; Levine L. E.; Jemian P. R.; Long G. G Ultra-Small-Angle X-Ray Scattering Instrument at the Advanced Photon Source : History , Recent Development , and Current Status. Metall. Mater. Trans. A 2013, 44A, 68–76. 10.1007/s11661-012-1431-y. [DOI] [Google Scholar]
- Small Angle X-Ray Scattering; Glatter O., Kratky O., Eds.; Academic Press, Inc.: London, 1982. [Google Scholar]
- Ilavsky J. Nika : Software for Two-Dimensional Data Reduction. J. Appl. Crystallogr. 2012, 45, 324–328. 10.1107/S0021889812004037. [DOI] [Google Scholar]
- Ilavsky J.; Jemian P. R. Irena: Tool Suite for Modeling and Analysis of small-angle Scattering. J. Appl. Crystallogr. 2009, 42, 347–353. 10.1107/S0021889809002222. [DOI] [Google Scholar]
- Beaucage G.; Schaefer D. W. Structural Studies of Complex Systems Using Small-Angle Scattering: A Unified Guinier/Power-Law Approach. J. Non-Cryst. Solids. 1994, 172-174, 797–805. 10.1016/0022-3093(94)90581-9. [DOI] [Google Scholar]
- Beaucage G. Approximations Leading to a Unified Exponential/Power-Law Approach to Small-Angle Scattering. J. Appl. Crystallogr. 1995, 28, 717–728. 10.1107/S0021889895005292. [DOI] [Google Scholar]
- Roon R. J.Methods of X-Rays and Neutron Scattering in Polymer Science; Oxford University Press: New York, 2004. [Google Scholar]
- Ingham B.; Li H.; Allen E. L.; Toney M. F. SAXSMorph: A Program for Generating Representative Morphologies for Two-Phase Materials from Small-Angle X-Ray and Neutron Scattering Data. J. Appl. Crystallogr. 2011, 44, 221–224. 10.1107/S0021889810048557. [DOI] [Google Scholar]
- POV-Ray - The Persistence of Vision Raytracer; The Persistence of Vision Pty. Ltd., 2018.
- Handbook of Chemistry and Physics; 90th ed.; Lide D. R.; Haynes W. M., Eds.; CRC Press: Boca Raton, FL, 2009. [Google Scholar]
- Perissinotto A. P.; Awano C. M.; Donatti D. A.; de Vicente F. S.; Vollet D. R. Mass and Surface Fractal in Supercritical Dried Silica Aerogels Prepared with Additions of Sodium Dodecyl Sulfate. Langmuir 2015, 31, 562–568. 10.1021/la504272g. [DOI] [PubMed] [Google Scholar]
- Vollet D. R.; Donatti D. A.; Ruiz A. I.; de Castro W. C. Structural Evolution of Aerogels Prepared from TEOS Sono-Hydrolysis upon Heat Treatment up to 1100 ° C. J. Non-Cryst. Solids 2003, 332, 73–79. 10.1016/j.jnoncrysol.2003.09.003. [DOI] [Google Scholar]
- Vega A. J.; Scherer G. W. Study of Structural Evolution of Silica Gel Using 1H and 29Si NMR. J. Non-Cryst. Solids 1989, 111, 153–166. 10.1016/0022-3093(89)90276-7. [DOI] [Google Scholar]
- Zerda T. W.; Artaki I.; Jonas J. Study of Polymerization Processes in Acid and Base Catalyzed Silica Sol-Gels. J. Non-Cryst. Solids 1986, 81, 365–379. 10.1016/0022-3093(86)90503-X. [DOI] [Google Scholar]
- Orcel G.; Hench L. L.; Artaki I.; Jonas J.; Zerda T. W. Effect of Formamide Additive on the Chemistry of Silica Sol-Gels II. Gel Structure. J. Non-Cryst. Solids 1988, 105, 223–231. 10.1016/0022-3093(88)90311-0. [DOI] [Google Scholar]
- Akkari R.; Ghorbel A.; Essayem N.; Figueras F. Mesoporous Silica Supported Sulfated Zirconia Prepared by a SolGel Process. J. Sol-Gel Sci. Technol. 2005, 33, 121–125. 10.1007/s10971-005-6712-0. [DOI] [Google Scholar]
- Gin S.; Frugier P. SON68 Glass Dissolution Kinetics at High Reaction Progress: Experimental Evidence of the Residual Rate. MRS Online Proc. Libr. 2002, 757, 757. 10.1557/PROC-757-II5.9. [DOI] [Google Scholar]
- Cailleteau C.; Devreux F.; Spalla O.; Angeli F.; Gin S. Why Do Certain Glasses with a High Dissolution Rate Undergo a Low Degree of Corrosion?. J. Phys. Chem. C 2011, 115, 5846–5855. 10.1021/jp111458f. [DOI] [Google Scholar]
- Gin S.; Jollivet P.; Fournier M.; Angeli F.; Frugier P.; Charpentier T. Origin and Consequences of Silicate Glass Passivation by Surface Layers. Nat. Commun. 2015, 6, 6360. 10.1038/ncomms7360. [DOI] [PMC free article] [PubMed] [Google Scholar]
- Briman I. M.; Rébiscoul D.; Diat O.; Jollivet P.; Zanotti J. M.; Gin S. Dynamics of Water Confined in Gel Formed During Glass Alteration at a Picosecond Scale. Procedia Earth Planet. Sci. 2013, 7, 733–737. 10.1016/j.proeps.2013.03.208. [DOI] [Google Scholar]
- Brinker C. J.; Scherer G. W. Sol → Gel → Glass: I. Gelation and Gel Structure. J. Non-Cryst. Solids 1985, 70, 301–322. 10.1016/0022-3093(85)90103-6. [DOI] [Google Scholar]
- de Lange R. S. A.; Hekkink J. H. A.; Keizer K.; Burggraaf A. J. Polymeric-Silica-Based Sols for Membrane Modification Applications: Sol-Gel Synthesis and Characterization with SAXS. J. Non-Cryst. Solids 1995, 191, 1–16. 10.1016/0022-3093(95)00291-X. [DOI] [Google Scholar]
- Livage J.; Henry M.; Sanchez C. Sol-Gel Chemistry of Transition Metal Oxides. Prog. Solid State Chem. 1988, 18, 259–341. 10.1016/0079-6786(88)90005-2. [DOI] [Google Scholar]
- Chrysafi R.; Perraki T.; Kakali G. Sol-Gel Preparation of 2CaO·SiO2. J. Eur. Ceram. Soc. 2007, 27, 1707–1710. 10.1016/j.jeurceramsoc.2006.05.004. [DOI] [Google Scholar]
Associated Data
This section collects any data citations, data availability statements, or supplementary materials included in this article.