

Abstract

Several parameters, including specific surface area, morphology, crystal size, and dopant concentration, play a significant role in improving the photocatalytic performance of ZnO. However, it is still unclear which of these parameters play a significant role in enhancing the photocatalytic activity. Herein, undoped and Mn-, Co-, and Cu-doped platelet-like zinc oxide (ZnO) nanostructures were synthesized via a facile microwave synthetic route, and their ultraviolet (UV) and visible-light-induced photocatalytic activities, by monitoring the gaseous acetaldehyde (CH3CHO) degradation, were systematically investigated. Both the pure and doped ZnO nanostructures were found to be UV-active, as the CH3CHO oxidation photocatalysts with the Cu-doped ZnO one being the most UV-efficient photocatalyst. However, upon visible light exposure, all ZnO-nanostructured samples displayed no photocatalytic activity except the Co-doped ZnO, which showed a measurable photocatalytic activity. The latter suggests that Co-doped ZnO nanostructures are potent candidates for several indoor photocatalytic applications. Various complementary techniques were utilized to improve the understanding of the influence of Mn-/Co-/Cu-doping on the photocatalytic performance of the ZnO nanostructures. Results showed that the synergetic effects of variation in morphology, surface defects, that is, VO, high specific surface areas, and porosity played a significant role in modulating the photocatalytic activity of ZnO nanostructures.
1. Introduction
Photocatalysis is regarded as the most exceptional oxidation approach to resolve environmental issues associated with air pollution and textile industrial wastewater.1 Semiconductors have been demonstrated to be the most effective photocatalysts for the degradation of pollutants in various forms, such as volatile organic compounds and organic dyes, because of their well-defined electronic band structure with occupied valence and unoccupied conduction bands (CBs).2,3 Currently, several semiconductors, including ZnO, TiO2, Fe2O3, and WO3, have been widely investigated as ultraviolet (UV) and visible light response photocatalysts in several photocatalytic applications, such as hydrogen production from water splitting and environmental pollution mitigation, because of their unique properties.2−4 As a wide band gap (3.4 eV) n-type semiconductor,5−7 ZnO has attracted tremendous attention as a potent photocatalyst because of its simplicity in fabrication, high electrochemical stability, high optical and electrical properties, and low toxicity.8−10 Several research efforts have been made to demonstrate the advantages of ZnO as an efficient photocatalyst, in particular for the fabrication of novel building coatings that are able to degrade organic pollutants. Nonetheless, its poor efficiency associated with its wide energy band gap, as well as the fast recombination of photoinduced electron–hole pairs, practically restricts its exploitation. Further, the wide band gap of ZnO restricts its photocatalytic activity only when exposed to UV light.3 Therefore, it is challenging to extend ZnO response into the visible light region and to develop surface-modified ZnO nanostructures with advantageous properties for indoor applications.11 Among the strategies that have been proposed to modify a ZnO photocatalyst, transition-metal ions, doping has recently become a hot topic of research because it further reduces the recombination rate, thus enhancing its photocatalytic performance by creating traps for holes and/or electrons and immobilizing the charge carriers.2
Other parameters that have been demonstrated to have a significant impact on the photocatalytic performance include specific surface area, morphology, crystal sizes, and defect concentration.2 Several research groups have studied the photocatalytic effectiveness of ZnO nanomaterials.12,13 Previous findings have revealed that nanostructured catalysts play a significant role in assisting produced electrons in reaching the surface and reacting with electron acceptors in a shorter transfer distance.2 On the other hand, the ability to produce, manipulate, and optimize the desired uniform architecture/morphology of nano-sized ZnO exhibiting desired properties is of paramount importance and has gained a lot of interest. As a result, various nanostructured ZnO materials, in various forms, such as nanofibers, nanorods, nanospheres, and nanosheets, have been developed using several synthetic approaches.14−17 Furthermore, surface defects, such as oxygen vacancies (VO), are considered to be the dominant reactive sites of semiconductor photocatalyst surface, for small molecule activation. It is also essential to note that previous findings, in which VO defects on the semiconductor photocatalyst surface were well controlled, have demonstrated that electron mobility, visible light absorption, and target air pollutant enrichment can be improved to affect the photocatalyst reactivity substantially.
In this context, it has been reported, herein, that the utilization of a microwave-assisted hydrothermal synthesis approach aimed to produce undoped and Mn-, Co-, and Cu-doped ZnO nanostructures for indoor applications. ZnO hierarchical nanostructures, whose platelet-like structure arrangement was shown to vary with the introduction of different types of transition-metal dopant ions, were achieved. A detailed comparison study was conducted using various techniques including scanning electron microscopy (SEM), Brunauer–Emmett–Teller (BET), photoluminescence (PL) spectroscopy, and X-ray photoelectron spectroscopy (XPS) to gain more insight into the dependence of morphological, textural, and the surface defects, tailored by various types of dopant ions on the photocatalytic performance of ZnO nanostructures.
2. Results and Discussion
2.1. Structural Analysis Using X-ray Diffraction and SEM
The X-ray diffraction (XRD) patterns of the undoped and Mn-, Co-, and Cu-doped ZnO nanostructures (Figure 1) showed sharp and intense diffraction peaks corresponding to the hexagonal wurtzite structure of ZnO (JCPDS card no. 36: 1451). No evidence of extra phases was provided, indicating that the dopant ions of Mn2+/Co2+/Cu2+ have been successfully doped into the ZnO lattice. However, a shift toward lower 2θ as well as an increase of diffraction peaks intensity with the introduction of various dopant ions (i.e., Mn, Co, and Cu) into the ZnO lattice was observed. The insets of Figure 1 depict the high-resolution diffraction peaks of both undoped and doped ZnO that correspond to the (101) plane where a noticeable shift to lower 2θ angles with the addition of various dopant ions can be clearly seen. The observed shift of the diffraction peak positions toward lower 2θ angles indicates partial substitution of Mn2+ (0.8 Å), Co2+ (0.74 Å), and Cu2+ (0.73 Å) into the Zn2+ lattice with an ionic radii of 0.74 Å, which leads to lattice expansion.18−21 The average crystallite sizes of both the undoped and metal-doped ZnO samples were also determined by measuring the full width at half-maximum of the intense diffraction peak associated with the (101) plane using the Debye–Scherer formula.22 As mentioned in Table 1, the average crystallite sizes were found to increase from 14.71 nm of undoped ZnO to 16.53, 21.59, and 24.61 nm of Co-, Mn-, and Cu-doped ZnO, respectively. The lattice distortions formed after adding dopant ions with different ionic radii into ZnO lattice are the main causes of the observed increase in the average crystallite size.18 On the basis of the observed results, the effect of Mn-, Co-, and Cu-doping on the crystallite structure of ZnO was further investigated, and the lattice parameters for all the ZnO products were calculated using eq 1.22
| 1 |
where h, k, and l are the Miller indices; a and c are the lattice constants; and d is the interplanar spacing, which can be determined from Bragg’s law
| 2 |
Figure 1.

XRD patterns of undoped and Mn-, Co-, and Cu-doped ZnO nanostructures.
Table 1. Crystallite Size (D) and Lattice Constants (a and c) for the Undoped and Co-, Mn-, and Cu-Doped ZnO Nanostructures.
| lattice
parameters |
|||||
|---|---|---|---|---|---|
| sample | 2θ (deg) | d (101) (Å) | D (nm) | a | c |
| undoped ZnO | 36.58 | 2.454 | 14.71 | 3.249 | 5.206 |
| 0.25 at. % Co | 36.55 | 2.455 | 16.53 | 3.261 | 4.962 |
| 0.25 at. % Mn | 36.45 | 2.461 | 21.59 | 3.263 | 5.005 |
| 0.25 at. % Cu | 36.14 | 2.482 | 24.61 | 3.262 | 5.192 |
The calculated lattice parameters calculated for undoped, Mn-, Co-, and Cu-doped ZnO are listed in Table 1, where it is apparent that the lattice parameter a increased upon addition of different types of dopant ions, while the lattice parameter c decreased under similar conditions. Such variations in lattice parameters, with the addition of Mn2+/Co2+/and Cu2+ as dopant ions, can be attributed to complex formation defects in Co-, Mn-, and Cu-doped ZnO nanostructures and to the substantial differences between the ionic radii of the foreign/dopant ions and those on the ZnO host lattice.22 In addition, the observed increase of lattice parameter a after the addition of different dopant ions confirms the incorporation of Mn2+ (0.8 Å), Co2+ (0.74 Å), and Cu2+ (0.73 Å) ions into the interstitial sites in the ZnO host lattice.19−21
The morphologies were also determined before and after the addition of the different transition metals as dopant ions, by employing SEM, and are presented in Figure 2. For undoped ZnO, numerous thin-layered porous platelet-like structures consisting of many small uniform particles assembled into hierarchical nanostructures were observed. Upon addition of Co into the ZnO lattice, the thin-layered platelet-like hierarchical structure was still maintained, but a more random pore distribution in the platelets was observed. For both the Mn- and Cu-doped ZnO samples, SEM observations revealed that the thin-layered platelet morphology was still preserved; however, these platelets were closely packed to each other as roselike cross-linked. In this case, the porous hierarchical architecture obtained in those ZnO nanostructures plays a significant role in enhancing the accessible surface area. The latter would further lead to an increase in both active sites and sorption capacity and thus would improve the photocatalytic performance of the sample.
Figure 2.
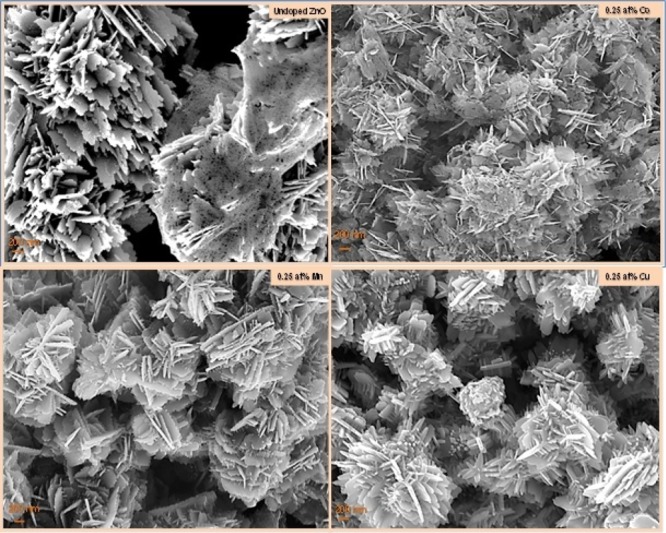
SEM images of undoped ZnO and Mn- Co-, and Cu-doped ZnO nanostructures.
2.2. Textural Analysis Using BET
To improve our understanding of the textural nature of the undoped and Mn-, Co-, and Cu-doped ZnO nanostructures, N2 adsorption–desorption measurements were conducted. In Figure 3, N2 adsorption–desorption isotherms and Barret–Joyner–Halenda pore-size distribution plots (see the insets of Figure 3) are shown for undoped and Mn-, Co-, and Cu-doped ZnO nanostructures. It is well demonstrated that the nature of dopant ions is significant, affecting both the BET-specific surface area and the pore-size distribution. For both the undoped and the metal-doped ZnO nanostructures, the gas sorption measurement revealed a type-IV curve, according to the IUPAC classification showing a characteristic hysteresis loop indicating the presence of mesopores. The only exception to the latter behavior was the Mn-doped sample, which exhibited a substantially higher N2 sorption compared to the remaining ZnO nanostructures, studied herein. Such differences could be associated with the alteration in the platelet structure arrangements, as observed by SEM when different types of dopants are introduced into the ZnO lattice. Also, high surface area values were determined for both undoped and Co-doped ZnO nanostructures (see the inset table in each figure) that can be associated with the porous thin-layered platelet-like structures consisting of nanoparticles assembled into hierarchical nanostructures. Higher specific surface area values allude to a large number of reactive sites, while higher pore diameter and pore volume indicate higher sorption capacity.
Figure 3.
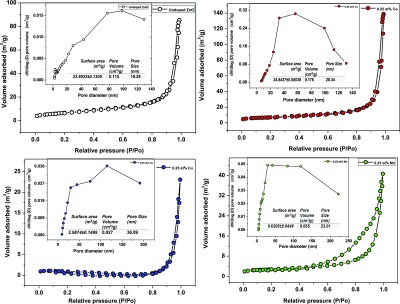
N2 adsorption–desorption isotherms of undoped and Mn-, Co-, and Cu-doped ZnO nanostructures.
2.3. Optical Properties
2.3.1. Optical Absorption
The investigation of the optical absorption properties of the ZnO nanostructures before and after the introduction of dopant ions was performed through the measurement of the UV–visible diffuse reflectance spectra. The optical reflectance spectra of both the undoped and Mn-, Co-, and Cu-doped ZnO nanostructures are shown in the inset of Figure 4. As depicted in Figure 4, low reflectance and high reflectance in the UV and visible regions were observed for all ZnO nanostructures. It should be mentioned here that low reflectance corresponds to high absorbance. In this context, all doped ZnO nanostructures displayed high absorption both in the UV and visible regions. It is also well established that the initial process of semiconductor-based photocatalysis involves the excitation of electrons from the valence band (VB) to the CB, upon light irradiation. Thus, the observed high absorption in the UV and visible regions of the doped samples may enhance their photocatalytic performance upon UV and visible light exposure.23
Figure 4.

[F(R∞)hν]2 vs (hν) curves of undoped and Mn-, Co-, and Cu-doped ZnO nanostructures. The inset shows the reflectance spectra of both undoped and doped ZnO nanostructures.
Furthermore, the optical band gap values for both
the undoped and
doped ZnO nanostructures were determined based on optical spectral
absorption using the equation  , where
  is
the Kubelka–Munk function.24,25R∞ is the ratio between the diffuse
reflectance from the sample and the reference material, A is a constant, hν is the incident photon
energy, and n is 1/2 or 2 for indirect and direct
transitions, respectively. The optical band gap values of the samples
were obtained by extrapolating the linear part of the plot of [F(R∞)hν]2 versus (hν) (see Figure 4) to hν equal to zero and were found to be 3.19, 3.16, 3.11, and
3.13 eV for undoped, Co-, Mn-, and Cu-doped ZnO nanostructures, respectively.
It is worth noting that the extrapolated values are comparable to
those for bulk ZnO (3.34 eV).26 Importantly
though, a band gap red shift observed for all the doped ZnO nanostructures
compared to the undoped ones can be attributed to band edge bending
induced by doping.27 Therefore, the observed
energy band gap narrowing with doping can be related to sp–d
exchange interactions between the localized d-electrons and the electrons
of the dopant ions of Mn2+, Co2+, and Cu2+ that substitute Zn2+ ions.28 Such exchange interaction resulted in negative and positive
corrections to the VB and CB edges, respectively, leading to an absorbance
and energy band gap red shift. This band gap shrinkage could also
be explained by the increased defects on the ZnO surface, when dopants
are introduced, which is also consistent with the observations from
XRD. Similar Eg trend was also reported
by Sangeetha et al.,27 while Bylsma et
al.29 employed second-order perturbation
theory to demonstrate that the red shift of the band gap was due to
the sp–d exchange interaction. As mentioned, the observed narrowing
of the energy band gap is also associated with a red shift of the
absorption features (see Figure 4) of the doped samples, suggesting that their photocatalytic
properties might also be shifted toward the visible region.
is
the Kubelka–Munk function.24,25R∞ is the ratio between the diffuse
reflectance from the sample and the reference material, A is a constant, hν is the incident photon
energy, and n is 1/2 or 2 for indirect and direct
transitions, respectively. The optical band gap values of the samples
were obtained by extrapolating the linear part of the plot of [F(R∞)hν]2 versus (hν) (see Figure 4) to hν equal to zero and were found to be 3.19, 3.16, 3.11, and
3.13 eV for undoped, Co-, Mn-, and Cu-doped ZnO nanostructures, respectively.
It is worth noting that the extrapolated values are comparable to
those for bulk ZnO (3.34 eV).26 Importantly
though, a band gap red shift observed for all the doped ZnO nanostructures
compared to the undoped ones can be attributed to band edge bending
induced by doping.27 Therefore, the observed
energy band gap narrowing with doping can be related to sp–d
exchange interactions between the localized d-electrons and the electrons
of the dopant ions of Mn2+, Co2+, and Cu2+ that substitute Zn2+ ions.28 Such exchange interaction resulted in negative and positive
corrections to the VB and CB edges, respectively, leading to an absorbance
and energy band gap red shift. This band gap shrinkage could also
be explained by the increased defects on the ZnO surface, when dopants
are introduced, which is also consistent with the observations from
XRD. Similar Eg trend was also reported
by Sangeetha et al.,27 while Bylsma et
al.29 employed second-order perturbation
theory to demonstrate that the red shift of the band gap was due to
the sp–d exchange interaction. As mentioned, the observed narrowing
of the energy band gap is also associated with a red shift of the
absorption features (see Figure 4) of the doped samples, suggesting that their photocatalytic
properties might also be shifted toward the visible region.
2.3.2. Photoluminescence
Because half of the tetrahedral voids of the wurtzite structure of ZnO are not filled, its structure is relatively open and therefore can have inherent defects. This offers one an opportunity to control or tune its properties through the addition of reasonably small amounts of dopant ions to suit specific needs and applications because doping can cause significant changes in electronic, optical, structural, and even magnetic properties by changing the electronic structure of ZnO. On the other hand, the changes in the morphological and structural features of ZnO have a significant influence on PL analysis. Therefore, to provide reasonable explanations of various photocatalytic behaviors (to be discussed in the upcoming section) observed in this work with the addition of different types of dopant ions, the PL technique was employed to gain more understanding of intrinsic defects of ZnO. Previous findings have demonstrated that the defects found in nanostructured ZnO include VO and Zni with different charged states, as well as VZn.9 The emission bands occurring as a result of the aforementioned defects usually appear near the blue-green, yellow, and orange-red regions in the ranges between 480 and 550, 550–610, and 610–750 nm, respectively.21 In some instances, coexistence of various types of defects may occur for the same sample, and this often results in the generation of a nonsymmetrical broad emission band which can then be deconvoluted into multiple bands equivalent to various emissions associated with oxygen- and zinc-related defects. Figure 5 shows the comparison between the PL spectra for the undoped, Mn-, Co-, and Cu-doped ZnO nanostructures using a 350 nm excitation light. All samples exhibited a single broad asymmetric band with intensified UV emission. Such asymmetric features indicate the superposition of multiple emission bands. A red shift in the high intensity of UV emission from 383 nm in the undoped ZnO to 391, 392, and 394 nm in Co-, Cu-, and Mn-doped ZnO was also observed. This shift on the UV emission toward visible light is consistent with the observed energy band gap red shift in all doped samples.30 To further investigate the origin of the broad emission, the PL spectra of undoped ZnO were fitted into five emission peaks using a Gaussian multipeak fit function. The most intense peak at the lowest wavelength of 383 nm corresponds to the characteristic emission of ZnO and can be assigned to the band edge emission or the exciton transition.31−33 Theoretical predictions have revealed that the Zni (neutral), Zni (single charged), and Zni (double-charged) shallow donor levels are positioned slightly below the CB at 0.22–0.5 eV.9,21 Therefore, emission bands in the violet-blue region at 402 and 422 nm arise from the transition of electrons from zinc interstitials (Zni) with different charges, including both neutral and single charge.9 Regarding the cause of the broad green emission from ZnO, it is strongly believed that it may not be assigned to a single source of luminescence. As widely reported, VO-related defects are considered to be the origin of the broad green emission, which are commonly reported oxygen vacancy (VO) defects in ZnO nanostructures. These defects exist in three different charge states, namely, double-charged (VO++), single-charged (VO), and neutral oxygen vacancies (VO).9,21,31,33 In this case, the recombination of single charged (VO+) states with holes in the VB resulted in green emission at 480 nm.9,21 This results in the emission peaks to be located at 450 nm and therefore can be associated with VZn.9,21
Figure 5.

Comparison of the PL spectra of undoped and Mn-, Co-, Cu-doped ZnO nanostructures using 350 nm excitation wavelengths light.
The increase of the band edge emission intensity with the addition of various transition metals as dopant ions might be due to the enhanced crystallinity of the doped ZnO. The latter is also in agreement with the XRD results. Similar observations have also been reported previously.34 Also, the PL properties have been found to strongly rely on the type and density of the defects in the ZnO nanostructures. On the other hand, the defects can be trapped and act as recombination centers for charge carriers. In a case where the density of defects does not reach a limit or not high enough, the defects will contribute mainly to the PL emission, resulting in the increase of the PL emission intensity with an increasing density of defects. On the other hand, if the density of defects is high enough, the defects will mainly behave as the recombination centers and lead to the PL intensity decrease with the increase of defect density.9 In the current study, the increment of the broad violet-blue emission band upon addition of Co into ZnO lattice associated with the increase in the concentration or density of VO defects in ZnO resulted in the creation of specific active sites for activation of few molecules on the photocatalyst surface. In fact, VO defects offer specific sites to strongly bind small molecules, thus enabling the subsequent molecule activation by photogenerated electron injection because they possess excess localized electrons.35 Therefore, because the higher the VO, the higher the number of photocatalytic reactive centers, it is expected that the photocatalytic activity for the Co-doped ZnO will be further improved.35
2.4. Chemical State Analysis
Detailed surface chemical state analysis was conducted on the synthesized ZnO nanostructures using XPS. High-resolution XPS spectra of O 1s, Cu, Mn, and Co 2p core levels for undoped, Mn-, Co-, and Cu-doped ZnO were acquired, in order to gain more insight into the way doping affects the oxygen formed on the ZnO nanostructure surface, as well as to confirm the presence of the dopant ions and probe their chemical state. Figure 6 shows the high-resolution XPS spectra of the O 1s core level and their deconvoluted results. As depicted in Figure 6a–d, the asymmetric O 1s feature present in the undoped and Co-, Mn-, and Cu-doped ZnO indicates the existence of several oxygenated chemical species in the near-surface region. The results were fitted using three Gaussian components located at 528.9 eV (O1), 530.4 eV (O2), and 532.2 eV (O3). A slight shift in the peak position for the fitted components was observed for all the doped samples (see Table 2). The component at low binding energy of 528.9 eV can be ascribed to the O2– ions in the Zn–O bonding of the ZnO wurtzite structure.36−38 The peak positioned at 530.4 eV corresponds to O2– ions and in particular to the oxygen-deficient regions of the ZnO matrix. Finally, the last peak located at the highest binding energy, 532.2 eV, could be due to chemisorbed oxygenated species on the surface, such as hydroxyl anions or adsorbed O2 and H2O.5,9 As shown in Table 2, the binding energy peak positions, when Co, Mn, and Cu ions were introduced into the ZnO lattice, were shifted. Also, the observed variations in the intensity of the O2 can be associated with changes in the concentration of oxygen vacancies (VO) defects, while the changes in this intensity of the O3 could be associated with the photocatalytic behavior.6,9 As it is very well demonstrated in Table 2, the Co-doped ZnO nanostructure exhibited the highest content of VO, as well as chemisorbed oxygen forms, compared to the rest of the nanostructures studied herein. Figure 7 shows the high resolution of (a) Cu, (b) Mn, and (c) Co 2p core levels, which revealed two binding energy peaks at 932 and 950, 655 and 640, and 780 and 800 eV owing to the spin–orbit splitting of Cu 2p3/2 and Cu 2p1/2,38 Mn 2p3/2 and Mn 2p1/2, and Co 2p3/2 and Co 2p1/2,39 respectively. These results suggest that Cu, Mn, and Cu ions were all in the +2 valence state, when they were added into the ZnO lattice.
Figure 6.

High-resolution XPS spectra for O 1s Gaussian fitted peaks of (a) undoped, (b) Co-doped ZnO, (c) Mn-doped ZnO, and (d) Cu-doped ZnO nanostructures.
Table 2. High Resolution of O 1s Core-Level Values for the (a) Undoped, Co-, Mn-, and Cu-Doped ZnO Nanostructures.
| O1 |
O2 |
O3 |
Olattice/Osurface | ||||
|---|---|---|---|---|---|---|---|
| sample | binding energy (eV) | area (%) | binding energy (eV) | area (%) | binding energy (eV) | area (%) | O1/O2 |
| pure ZnO | 528.9 | 17.2 | 530.4 | 12.3 | 532.2 | 1.3 | 1.4 |
| ZnO:Co | 528.9 | 14.5 | 530.9 | 14.2 | 532.9 | 2.7 | 0.9 |
| ZnO:Mn | 529.8 | 21.3 | 531.3 | 13.1 | 532.8 | 1.2 | 1.6 |
| ZnO:Cu | 529.0 | 20.4 | 530.9 | 12.6 | 532.9 | 1.2 | 1.6 |
Figure 7.

High-resolution X-ray photoelectron spectra of (a) Cu 2p, (b) Mn 2p, and (c) Co 2p.
2.5. Photocatalytic Activity of the Mn-, Cu-, and Co-Doped ZnO Nanostructures
In this section, the UV and visible (Vis) light-induced photocatalytic reactivity of pure and Mn-, Co-, and Cu-doped ZnO nanostructures toward gaseous CH3CHO are presented. CH3CHO photocatalytic degradation products are also reported. Finally, the CO product yield is given in the case of Co–ZnO photocatalyst and discussed because of its potent application for indoor (Vis-activated) use.
Figure 8 shows a typical experiment using undoped ZnO as a photocatalyst, where CH3CHO loss was monitored as a function of time under dark conditions (adsorption–desorption) and after sequential exposure cycles of the optical cell to Vis and UV light. Each spectrum, in the CH3CHO temporal loss plot, was measured with 64 co-added scans, at 1 cm–1 resolution, which corresponds to 10 min of irradiation. A double-exponential fit very well represents the experimental data through the whole experimental duration, indicating that the competitive adsorption–desorption processes were dominating under all the employed conditions (i.e., in the absence of artificial light, as well as under both UV and Vis light exposure) and no CH3CHO photocatalytic degradation was observed within the precision of the measurements. Also, no product formation was detected within the detection sensitivity of the method both under dark or visible light irradiation conditions, justifying the minor effect of the title processes. However, UV light irradiation resulted in CO and CO2 production, centered at ∼2144 and ∼2350 cm–1, respectively, revealing some photocatalytic activity of the undoped ZnO nanostructures in outdoor environments. It is worth to note that the photocatalytic efficiency of ZnO under UV light exposure was substantially lower compared to the commercially available P-25 TiO2 nanostructure that has been measured previously.40
Figure 8.
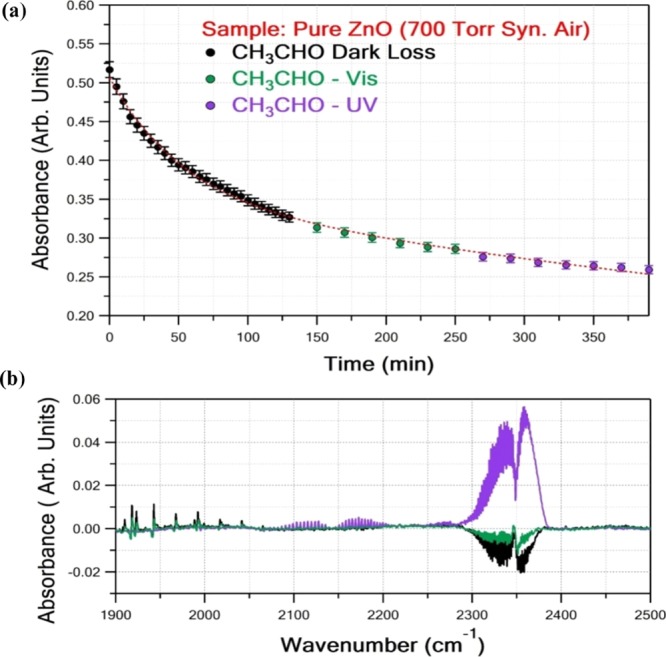
UV-induced photocatalytic reactivity of undoped ZnO. (a) Adsorption–desorption competitive processes under dark conditions (black circles), UV light-induced (purple circles) temporal loss of CH3CHO. (b) Typical variation of CO2 (centered at ∼2350 cm–1) and CO (centered at ∼2144 cm–1) levels under dark conditions (black line), Vis irradiation (green line), and UV exposure (purple line) of pure ZnO sample in CH3CHO balanced with synthetic air at 296 K and 700 Torr.
Mn and Cu addition, as dopant ions, into the ZnO lattice did not dramatically change the photocatalytic properties of the undoped ZnO nanostructures when it was irradiated with UV light, resulting mainly in CO2 and, to a lower extent, CO formation. Similarly, no photocatalytic activity was observed for Mn- and Cu-doped ZnO nanostructures when irradiated with visible light. Figure 9 shows CH3CHO loss under UV irradiation of the Mn-doped ZnO nanostructures, as well as the temporal profile of CO2 formation, verifying that it comprises a major UV-light-induced CH3CHO photocatalysis end product. Minor CO formation was also observed, at marginally higher levels compared to the method’s detection sensitivity (5 × 10¹³ molecule cm3).
Figure 9.

UV-induced photocatalytic reactivity of Mn–ZnO sample toward CH3CHO. (a) Upper panel: Dark (black circles) and UV (purple circles)-induced CH3CHO temporal loss. (b) Lower panel: CO2 levels under dark conditions (black circles) and UV irradiation (purple circles).
In the case of Cu-doped ZnO photocatalyst, pronounced UV-induced photocatalysis of CH3CHO, as well as increased and systematic CO formation, was displayed as shown in Figure 10. However, no photocatalytic activity was detected under Vis light irradiation for both 0.25% Mn- or Cu-doped ZnO nanostructures.
Figure 10.
UV-induced photocatalytic reactivity of Cu–ZnO sample toward CH3CHO. Upper panel: (a) Dark (black circles) and UV (purple circles)-induced CH3CHO temporal loss. Lower panel: (b) CO formation under sample UV irradiation (purple circles).
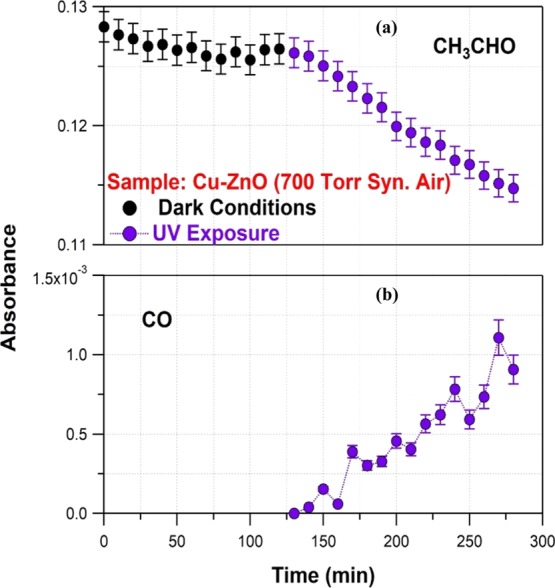
On the other hand, the introduction of Co into the ZnO lattice led to the measurable photocatalytic activity under Vis light irradiation, while UV photoactivation was substantially reduced (see Figure 11). The latter suggests that Co-doping red-shifts the absorption spectrum of ZnO toward the visible light region. Co2+ has a valence electronic configuration of [Ar]3d7 such that during the photocatalytic process, electron or hole trapping will result in [Ar]3d8 and [Ar]3d6 electron structures, respectively, both are unstable. The trapped electron will then be transferred to O2, so as Co to return to the most energetically stable electronic configuration, and H2O will be trapped in the positive holes producing O2– and OH radicals, respectively. The better Vis-induced photocatalytic performance of Co-doped ZnO compared to the nanostructures with Mn and Cu dopants in the visible region might be attributed to synergetic effects and that their impact has not been evaluated in detail herein. Theoretical calculations, such as density functional theory–time dependent, can be possibly utilized to study the energetics of the electronic states involved, though it was beyond the scope of this study. However, although all three dopants red-shift the spectrum to the visible region and can be potent Vis photocatalysts, Co-doping had the most significant effect on the lattice parameter change as well as on the Olattice/Osurface ratio. The latter, along with the increase of the surface adsorption sites, suggests that CH3CHO oxidation predominantly takes place on the surface, indicating that it might be the main reason for Co-doping to be superior compared to Mn- and Cu-doping. Notably, in the case of Cu-doping, where the highest increase of the adsorption sites was observed, the electron capturing results in a very stable electronic configuration, [Ar]3d10, that might prohibit photocatalytic reactivity. Therefore, Co-doping of ZnO might be an efficient way to synthesize photocatalysts for indoor applications. However, carbon monoxide (CO) formation was also observed under Vis light-induced photocatalytic degradation of CH3CHO at substantial levels.
Figure 11.
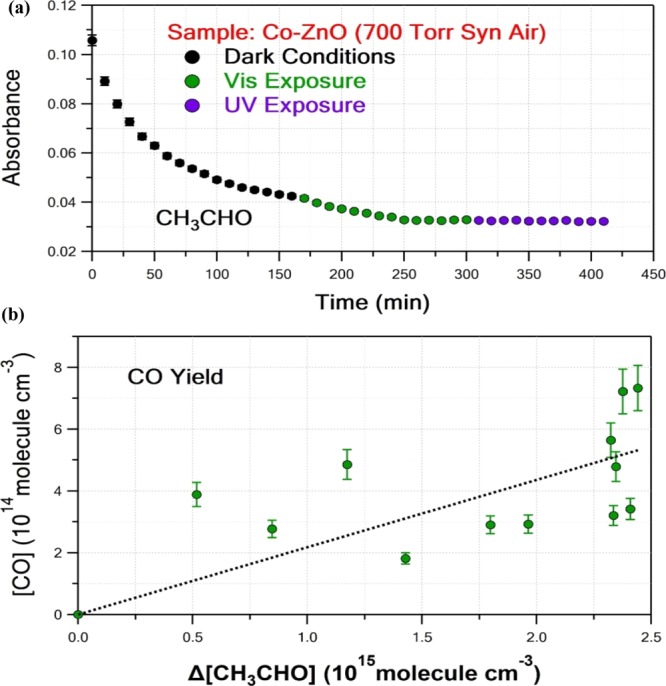
UV-induced photocatalytic reactivity of Co–ZnO sample toward CH3CHO. (a) Dark (black circles) and Vis (green circles) and UV (purple circles)-induced CH3CHO temporal loss. (b) Vis-induced CO product yield measurement (green circles) employing Beer–Lambert law for determining CH3CHO and CO concentrations. Linear least-squares analysis resulted in an yield of 0.22 ± 0.05, with the quoted uncertainty to be the 2σ of the fit.
Because CO is known to be toxic, especially in the indoor environment, the production yield was determined by measuring CH3CHO and CO IR cross sections as part of this work and employing the Beer–Lambert law. In particular, 4.19 × 10⁻¹⁹ and 8.23 × 10⁻²⁰ cm2 per molecule at 1745.54 and 2165.67 cm–1 were used for determination of CH3CHO and CO concentrations, as infrared cross-sectional values, respectively. Integrated band strengths were also used for determining the CO concentrations, and the results were consistent to each other, within the uncertainty of the measurements. CO product yield was determined to be (22 ± 5)%, that is, a high conversion factor of CH3CHO to an even more toxic end product, and it should be taken under consideration. The quoted error limit is 2σ (95% level of confidence) and does not include systematic uncertainties. Similarly, CO2 product yield was also measured to be (108 ± 32)%. The relatively high risk in CO2 measurements is mainly due to possible instabilities on background CO2 levels during the measurement time as well as possible adsorption of the products on the surface. Therefore, the formation of other minor intermediate outcomes, such as CH3C(O)OH, cannot be excluded and can amount for an ∼(70 ± 40)% lack of CH3CHO conversion to CO and CO2 mass balance.
It is worth to note that replicate experiments were also performed after using the photocatalyst to evaluate photocatalyst reusability. In the present study, we run three repeated cycles, in which a decrease of ∼3% of both CH3CHO on surface adsorption and photocatalytic efficiency of Co–ZnO nanostructure was observed after every cycle. Although the reusability should be evaluated after photocatalysts were spread on panels and under real indoor atmospheric conditions, the first results are promising for indoor environmental remediation applications.
On the basis of the above discussion, the observed variation in the photocatalytic activity for all the ZnO nanostructures (both undoped and doped) can, therefore, be elucidated. The photocatalytic activity is known to have a direct correlation with the lattice-to-surface ratio found on the surface of the material. Under light irradiation, surface defects, such as oxygen vacancies, promote the separation of electron–hole pairs, enhancing the activity during photocatalytic reactions.41
Under the ultra-high vacuum in the XPS chamber, the adsorbed hydroxyl groups are removed. Therefore, the observed hydroxyl groups were attributed to •OH and H2O, strongly bound to the surface defects of the nanomaterial. Many studies have demonstrated that the photocatalytic performance is related to both oxygen defect concentration and the type of that defect. For instance, surface hydroxyl groups facilitate the trapping of photoinduced electrons and holes, resulting in higher photocatalytic efficiency.42
It is also known that photocatalyst performance might be improved with the addition of metal dopants. The introduction of dopants affects the crystallite size, as well as porosity and surface area, and thus could alter both the energy band gap and the lifetime of the electron–hole pair. Higher oxygen vacancies lead to higher photocatalysis and more recombination centers.35 In this work, doping appears to increase the oxygen vacancies for all the studied samples. The absorption of photoenergy results in electrons transferring from the valence to the CB forming electron–hole pairs. In the absence of defects in the crystalline, these photogenerated electron–hole pairs have a speedy recombination rate both in bulk and on the surface. Photogenerated electrons and holes initiate photoredox reactions, on the surface, where electrons reducing electron acceptors and holes oxidizing electron donors. However, defects in the crystalline can trap the holes, acting as new recombination centers. These trapped holes react with electron donors, increasing the photocatalytic activity. Surface defects play an essential role in photocatalytic activity.41 From all measured XPS results, it is concluded that the higher photocatalytic performance (both under exposure to UV or Vis light) is achieved in the lower lattice/surface ratio. Overall, the amount of surface oxygen (oxygen vacancies and defect of hydroxyl radical) is recommended to be equal or higher to the oxygen found in the lattice.
3. Conclusions
In summary, the findings from the investigations conducted on the photocatalytic activity of the platelet-like ZnO hierarchical nanostructures doped with various transition-metal ions, such as Mn, Co, and Cu, at a low optimized concentration of 0.25% are presented. The photocatalytic studies performed in the present work revealed that Co-doped ZnO was the only photocatalyst that exhibited photocatalytic activity under Vis light irradiation. Therefore, Co-doped ZnO could be a potent photocatalyst that can be utilized for indoor applications. The remaining photocatalysts, including undoped, Mn-, and Cu-doped ZnO, were only UV light-responsive and displayed no photocatalytic activity under Vis light irradiation. Findings from different characterization techniques including XRD, SEM, BET, XPS, UV–Vis, and PL provide the information that can interpret the observed photocatalytic behavior when different types of dopants were added into the ZnO lattice. It was concluded that different dopant ions affecting different essential parameters, including morphology, surface defects, and specific surface area, are directly related to the photocatalytic activity of the studied ZnO nanostructures. For instance, the XRD results revealed the shift in diffraction peak positions toward low 2θ angles and the alteration in the lattice parameters between Co-, Mn-, and Cu-doped and undoped ZnO nanostructures, indicating ZnO lattice expansion and formation of complex defects on the ZnO surface. On the other hand, diffuse reflectance spectra displayed shrinkage in the band gap of the nanostructured ZnO with Mn-, Co-, and Cu-doped surface, which is correlated with the shift in the band edge to higher wavelengths, indicating the introduction of defects or impurity levels with addition of dopant ions. Indeed, PL and XPS measurements also demonstrated the increase in the content of surface defects with Mn-, Co-, and Cu-doping. However, BET-specific area analysis revealed high surface area values for the undoped and Co-doped ZnO nanostructures associated with the porous nature of the platelet-like hierarchical structures consisting of many nano-sized particles.
4. Experimental Procedure
4.1. Synthesis of Undoped and Mn-, Co-, and Cu-Doped ZnO Nanostructures
All chemicals used for the synthesis were purchased from Sigma-Aldrich. Undoped and Mn-, Co-, and Cu-doped ZnO nanostructures were synthesized using the microwave-assisted hydrothermal method. Solutions (0.1 M) of zinc nitrate hexahydrate (Zn(NO3)2·6H2O), which was used as the starting material along with hexamethylenetetramine, HMT (CH2)6N4, were dissolved into 250 mL of distilled water and stirred for 45 min. Solution pH was maintained at 13 by dropwise addition of hydroxide (NaOH) under constant stirring. The obtained milky solution was transferred into four Teflon vessels and subjected to microwave irradiation using an Anton PaarMultiwave 3000 oven at 220 °C for 15 min. The resulting white precipitate was then collected, centrifuged, and washed several times with a mixture of deionized water and ethanol.
Mn-, Co-, and Cu-doped ZnO nanostructures were prepared following the same experimental procedure used to prepare undoped ZnO by also adding into the zinc precursor solution stoichiometric amounts (0.25%) of manganese nitrate hexahydrate (Mn(NO3)2·6H2O, cobalt nitrate hexahydrate (Co(NO3)2·6H2O), and copper nitrate hexahydrate (Cu(NO3)2·6H2O), respectively. All products were kept at room temperature overnight and dried using an electric oven at 200 °C for 2 h. The experimental procedure used to prepare ZnO nanoparticles is schematically presented in Figure 12.
Figure 12.

Schematic representation of the synthetic procedure employed for the preparation of ZnO nanostructures.
4.2. Characterization Techniques
To study the phase purity and crystal structures of both undoped and Mn-, Co-, and Cu-doped ZnO products, a Panalytical X’Pert PRO PW 3040/60 diffractometer equipped with a Cu Kα (λ = 0.15405 nm) monochromatic radiation source was used. An Auriga ZEISS scanning electron microscope operated at 5 keV was also used to examine the morphology of the samples. The BET, the specific surface area of the ZnO products, was obtained using a Micrometirics TriStar 3000 surface area analyzer. Preceding the analysis, the samples were degassed at 200 °C for 1 h under a continuous flow of N2 gas to remove the adsorbed impurities. The optical absorption and PL spectra of ZnO samples were then collected using a PerkinElmer Lambda 950 UV/Vis/NIR and PerkinElmer LS-55 Fluorescence spectrophotometer following excitation at 325 nm. Finally, the chemical state analyses of both the undoped and metal-doped ZnO samples were carried out using a VG Escalab 220i XL X-ray photoelectron spectrometer equipped with monochromatic Al Kα radiation source (hν = 1486.6 eV).
4.3. Photocatalytic Reactivity Determination
The photocatalytic activity of undoped and 0.25% Mn-, Co-, and Cu-doped ZnO was measured toward gaseous acetaldehyde (CH3CHO) employing photochemical static reactor technique coupled with on-line Fourier transform infrared (FTIR) spectroscopy. Reactants and stable products were simultaneously detected under static conditions following photocatalysis progress. An experimental setup has been described in detail previously,42 and only information that is related to the present work is given herein. The experimental setup consisted of four main units: (a) a cylindrical Pyrex reactor of 16.3 cm optical length and 40 cm3 internal volumes equipped with detached IR-transparent NaCl windows at both ends. Gas inlets assorted with stop or needle valves designed for controlled supply of gases and evacuating the cell were attached at the top of the reactor, (b) distant-adjustable UV (300 W Osram Ultra Vitalux) and visible (Vis, 500 W Vito Halogen Projector, VT 364) light sources with emission spectra that satisfactorily simulate outdoor and indoor light conditions, respectively, (c) gas preparing and handling system that includes round storage bulbs and buffer volumes, differential pressure transducers for pressure measurements, and vacuum rotary pumps, and (d) FTIR spectrophotometer (JASCO FTIR-6300) that hosts the reactor cell and used for real-time, on-line monitoring of stable reactants and products.
First, CH3CHO photostability, under ambient laboratory light, and other potent losses, that is, heterogeneous and hydrolysis loss on the surface, were tested under dark conditions for long exposure time. CH3HO (1 Torr) was introduced into the reaction cell, and the total reactor pressure was adjusted to 700 Torr using synthetic air (N2/O2, 80/20%), as bath gas. The infrared spectrum was recorded at a resolution of R = 1 cm–1 between 500 and 4000 cm–1 using 64 coadded scans. Following that, in the absence of external irradiation and with the reaction cell covered with a black cloth, sequential spectra were recorded every 10 min for 2 h. No change on CH3CHO absorbance was observed (<0.5%) within the precision of the measurements, showing that acetaldehyde’s dark loss is negligible within the experimental detection sensitivity. Subsequently, the reactor was irradiated using both UV and Vis light sources, separately, for long exposure times (∼2 h). The IR spectra recorded at time intervals of 10 min revealed that CH3CHO photolytic loss under experimental conditions was insignificant. Once CH3CHO dark and photolytic loss was excluded as the potential CH3CHO sinks, the reactor was pumped out thoroughly and the photocatalyst was introduced inside the reactor’s volume. More specifically, 0.050 ± 0.001 g of undoped, Mn-, Co-, and Cu-doped ZnO nanopowder samples were homogeneously spread on a properly designed glass boat covering a geometric surface of approximately 4.5 cm2 and were inserted into the reactor via the detached NaCl windows. The sample thicknesses were estimated using the expression d = m/(ρ × A) to be 200 μm using a ZnO density ρ = 5.61 g cm–3. Then, 0.9–1.6 Torr of CH3CHO was introduced into the cell, and the reactor pressure was balanced to ∼700 Torr, with either N2 or N2/O2. The initial IR spectrum was recorded and CH3CHO adsorption on doped ZnO surfaces was monitored, recording the IR spectra every 10 min, in the absence of any artificial light. No further decrease of absorbance signal verified surface saturation at 1745.74 cm–1 (C=O stretch). Afterward, the reaction cell was irradiated with either UV or Vis light, and photocatalytically induced CH3CHO degradation was determined as a function of time. Simultaneously, the temporal profiles of stable photocatalytic products were also monitored. Both lamps were adjusted at 60 cm distance away from the photocatalyst surface, and the reaction cell was continuously fan-cooled during the irradiation to maintain the ambient temperature (296 ± 1 K) inside the reactor.
Acknowledgments
This work was supported by the Department of Science and Technology (CGERA8X), Council for Scientific and Industrial Research (CGER27S), and WIROX project (PIRSES-GA-2011-295216), a Marie Curie International Research Staff Exchange Scheme Fellowship within the 7th European Community Framework Programme and ″ORAMA”: Oxide Materials Towards a Matured Post-silicon Electronics ERA FP7-NMP—contract no: 246334. The authors are also thankful for the equipment supplied by the NCNSMs at CSIR in South Africa and EMT at INRS in Canada, Department of Chemistry in the University of Crete and FORTH/IESL Institute for all the analysis. F.R. acknowledges the Canada Research Chairs program for partial salary support and funding of this project.
Author Present Address
⧫ Department of Physics and Engineering, University of Zululand, Private Bag X1001, Kwadlangezwa 3886, South Africa.
The authors declare no competing financial interest.
References
- Miyauchi M.; Irie H.; Liu M.; Qiu X.; Yu H.; Sunada K.; Hashimoto K. Visible-light-sensitive photocatalysts: Nanocluster-grafted titanium dioxide for indoor environmental remediation. J. Phys. Chem. Lett. 2016, 7, 75–84. 10.1021/acs.jpclett.5b02041. [DOI] [PubMed] [Google Scholar]
- Shayegan Z.; Lee C.-S.; Haghighat F. TiO2 photocatalyst for removal of volatile organic compounds in gas phase: A review. Chem. Eng. J. 2018, 334, 2408–2439. 10.1016/j.cej.2017.09.153. [DOI] [Google Scholar]
- Pirhashemi M.; Habibi-Yangjeh A.; Rahim Pouran S. Review on the criteria anticipated for the fabrication of highly efficient ZnO-based visible-light-driven photocatalysts. J. Ind. Eng. Chem. 2018, 62, 1–25. 10.1016/j.jiec.2018.01.012. [DOI] [Google Scholar]
- Wang H.; Wu Z.; Liu Y.; Sheng Z. The characterization of ZnO–anatase–rutile three-component semiconductor and enhanced photocatalytic activity of nitrogen oxides. J. Mol. Catal. A: Chem. 2008, 287, 176–181. 10.1016/j.molcata.2008.03.010. [DOI] [Google Scholar]
- Cai J.-w.; Xu J.-p.; Zhang X.-s.; Niu X.-p.; Xing T.-y.; Ji T.; Li L. Defect-related visible luminescence of ZnO nanorods annealed in oxygen ambient. Optoelectron. Lett. 2012, 8, 4–8. 10.1007/s11801-012-1042-2. [DOI] [Google Scholar]
- Motaung D. E.; Kortidis I.; Papadaki D.; Nkosi S. S.; Mhlongo G. H.; Wesley-Smith J.; Malgas G. F.; Mwakikunga B. W.; Coetsee E.; Swart H. C.; Kiriakidis G.; Ray S. S. Defect-induced magnetism in undoped and Mn-doped wideband gap zinc oxide grown by aerosol spray pyrolysis. Appl. Surf. Sci. 2014, 311, 14–26. 10.1016/j.apsusc.2014.04.183. [DOI] [Google Scholar]
- Motaung D. E.; Mhlongo G. H.; Nkosi S. S.; Malgas G. F.; Mwakikunga B. W.; Coetsee E.; Swart H. C.; Abdallah H. M. I.; Moyo T.; Ray S. S. Shape-selective dependence of room temperature ferromagnetism induced by hierarchical ZnO nanostructures. ACS Appl. Mater. Interfaces 2014, 6, 8981–8995. 10.1021/am501911y. [DOI] [PubMed] [Google Scholar]
- Amin G.; Asif M. H.; Zainelabdin A.; Zaman S.; Nur O.; Willander M. Influence of pH, precursor concentration, growth time, and temperature on the morphology of ZnO nanostructures grown by the hydrothermal method. J. Nanomater. 2011, 2011, 269692. 10.1155/2011/269692. [DOI] [Google Scholar]
- Mhlongo G. H.; Motaung D. E.; Nkosi S. S.; Swart H. C.; Malgas G. F.; Hillie K. T.; Mwakikunga B. W. Temperature-dependence on the structural, optical, and paramagnetic properties of ZnO nanostructures. Appl. Surf. Sci. 2014, 293, 62–70. 10.1016/j.apsusc.2013.12.076. [DOI] [Google Scholar]
- Sameie H.; SabbaghAlvani A. A.; Naseri N.; Rosei F.; Mul G.; Mei B. T. Photocatalytic activity of ZnV2O6/reduced graphene oxide nanocomposite: from theory to experiment. J. Electrochem. Soc. 2018, 165, H353–H359. 10.1149/2.0601807jes. [DOI] [Google Scholar]
- Mahmoud F. A.; Kiriakidis G. Nanocrystalline ZnO thin film for gas sensor application. J. Ovonic Res. 2009, 5, 15–20. [Google Scholar]
- Singh A. K.; Nakate U. T. Photocatalytic properties of microwave-synthesized TiO2 and ZnOn anoparticles using malachite green dye. J. Nanopart. 2013, 2013, 310809. 10.1155/2013/310809. [DOI] [Google Scholar]
- Wang Y.; Li X.; Wang N.; Quan X.; Chen Y. Controllable synthesis of ZnO nanoflowers and their morphology-dependent photocatalytic activities. Sep. Purif. Technol. 2008, 62, 727–732. 10.1016/j.seppur.2008.03.035. [DOI] [Google Scholar]
- Berruet M.; Pereyra C. J.; Mhlongo G. H.; Dhlamini M. S.; Hillie K. T.; Vázquez M.; Marotti R. E. Optical and structural properties of nanostructured ZnO thin films deposited onto FTO/glass substrate by a solution-based technique. Opt. Mater. 2013, 35, 2721–2727. 10.1016/j.optmat.2013.08.018. [DOI] [Google Scholar]
- McCluskey M. D.; Jokela S. J. Defects in ZnO. J. Appl. Phys. 2009, 106, 071101. 10.1063/1.3216464. [DOI] [Google Scholar]
- Schmide-Mende L.; MacManus-Driscoll J. L. ZnO nanostructures, defects, and devices. Mater. Today 2007, 10, 40–48. 10.1016/s1369-7021(07)70078-0. [DOI] [Google Scholar]
- Barreto G. P.; Morales G.; Quintanilla M. L. L. Microwave assisted synthesis of ZnO nanoparticles: Effect of precursor reagents, temperature, irradiation time, and additives on nano-ZnO morphology development. J. Mater. 2013, 2013, 478681. 10.1155/2013/478681. [DOI] [Google Scholar]
- Shaaban E. R.; El-Hagary M.; Emam-Ismail M.; Matar A.; Yahia I. S. Spectroscopic ellipsometry and magneto-transport investigations of Mn-doped ZnO nanocrystalline films deposited by a non-vacuum sol-gel spin-coating method. Mater. Sci. Eng., B 2013, 178, 183–189. 10.1016/j.mseb.2012.11.005. [DOI] [Google Scholar]
- Chand P.; Gaur A.; Kumar A. Structural and optical properties of ZnO nanoparticles synthesized at different pH values. J. Alloys Compd. 2012, 539, 174–178. 10.1016/j.jallcom.2012.05.104. [DOI] [Google Scholar]
- Vijayaprasath G.; Murugan R.; Ravi G.; Mahalingam T.; Hayakawa Y. Characterization of dilute magnetic semiconducting transition metal doped ZnO thin films by sol-gel spin coating method. Appl. Surf. Sci. 2014, 313, 870–876. 10.1016/j.apsusc.2014.06.093. [DOI] [Google Scholar]
- Mhlongo G. H.; Shingange K.; Tshabalala Z. P.; Dhonge B. P.; Mahmoud F. A.; Mwakikunga B. W.; Motaung D. E. Room temperature ferromagnetism and gas sensing in ZnO nanostructures: Influence of intrinsic defects and Mn-, Co-, Cu doping. Appl. Surf. Sci. 2016, 390, 804–815. 10.1016/j.apsusc.2016.08.138. [DOI] [Google Scholar]
- Ashokkumar M.; Muthukumaran S. Enhanced room temperature ferromagnetism and photoluminescence behavior of Cu-doped ZnO co-doped with Mn. Phys. E 2015, 69, 354–359. 10.1016/j.physe.2015.02.010. [DOI] [Google Scholar]
- de Lima J. F.; Martins R. F.; Neri C. R.; Serra O. A. ZnO:CeO2-based nanopowders with low catalytic activity as UV absorbers. Appl. Surf. Sci. 2009, 255, 9006–9009. 10.1016/j.apsusc.2009.06.071. [DOI] [Google Scholar]
- Voi G.; Oprea O.; Vasile B. S.; Andrones E. Cu-Photolumunescence and photocatalytic activity of Mn-doped ZnO nanoparticles. Dig. J. Nanomater. Bios. 2013, 8, 667–675. [Google Scholar]
- Ai Z.; Lee S.; Huang Y.; Ho W.; Zhang L. Photocatalytic removal of NO and HCHO over nanocrystalline Zn2SnO4 microcubes for indoor air purification. J. Hazard. Mater. 2010, 179, 141–150. 10.1016/j.jhazmat.2010.02.071. [DOI] [PubMed] [Google Scholar]
- Ling C. C.; Cheung C. K.; Gu Q. L.; Dai X. M.; Xu S. J.; Zhu C. Y.; Luo J. M.; Zhu C. Y.; Tam K. H.; Djurišić A. B.; Beling C. D.; Fung S.; Lu L. W.; Brauer G.; Anwand W.; Skorupa W.; Ong H. C. Defect study in ZnO related structures-A multi-spectroscopic approach. Appl. Surf. Sci. 2008, 255, 58–62. 10.1016/j.apsusc.2008.05.309. [DOI] [Google Scholar]
- Sangeetha R.; Muthukumaran S.; Ashokkumar M. Structural, optical, dielectric and antibacterial studies of Mn doped Zn0.96Cu0.040 nanoparticles. Spectrochim. Acta A Mol. Biomol. Spectrosc. 2015, 144, 1–7. 10.1016/j.saa.2015.02.056. [DOI] [PubMed] [Google Scholar]
- Fabbiyola S.; Kennedy L. J.; Aruldoss U.; Bououdina M.; Dakhel A. A.; JudithVijaya J. Synthesis of Co-doped ZnO nanoparticles via co-precipitation: Structural, optical and magnetic properties. Powder Technol. 2015, 286, 757–765. 10.1016/j.powtec.2015.08.054. [DOI] [Google Scholar]
- Bylsma R. B.; Becker W. M.; Kossut J.; Debska U.; Yoder-Short D. Dependence of energy gap on x and T in Zn1–xMnxSe: The role of exchange interaction. Phys. Rev. B: Condens. Matter Mater. Phys. 1986, 33, 8207–8215. 10.1103/physrevb.33.8207. [DOI] [PubMed] [Google Scholar]
- Li W.; Wang G.; Feng Y.; Li Z. Efficient photocatalytic performance enhancement in Co-doped ZnO nanowires coupled with CuS nanoparticles. Appl. Surf. Sci. 2018, 428, 154–164. 10.1016/j.apsusc.2017.09.049. [DOI] [Google Scholar]
- Kundu T. K.; Karak N.; Barik P.; Saha S. Optical properties of ZnO nanoparticles prepared by chemical method using poly(vinyl alcohol) (PVA) as capping agent. Inter. J. Soft Comput. Eng. 2011, 1, 19–24. [Google Scholar]
- Vanheusden K.; Warren W. L.; Seager C. H.; Tallant D. R.; Voigt J. A.; Gnade B. E. Mechanisms behind green photoluminescence in ZnO phosphor powders. J. Appl. Phys. 1996, 79, 7983–7990. 10.1063/1.362349. [DOI] [Google Scholar]
- Zhang W. C.; Wu X. L.; Chen H. T.; Zhu J.; Huang G. S. Excitation wavelength dependence of the visible photoluminescence from amorphous ZnO granular films. J. Appl. Phys. 2008, 103, 093718. 10.1063/1.2924421. [DOI] [Google Scholar]
- Kabongo G. L.; Mhlongo G. H.; Mothudi B. M.; Hillie K. T.; Swart H. C.; Dhlamini M. S. Enhanced exciton emission from ZnO nano-phosphor induced by Yb3+ions. Mater. Lett. 2014, 119, 71–74. 10.1016/j.matlet.2013.12.076. [DOI] [Google Scholar]
- Zhang W. C.; Wu X. L.; Chen H. T.; Zhu J.; Huang G. S. Excitation wavelength dependence of the visible photoluminescence from amorphous ZnO granular films. J. Appl. Phys. 2008, 103, 093718–093722. 10.1063/1.2924421. [DOI] [Google Scholar]
- Wagner C. D.; Gale L. H.; Raymond R. H. Two-dimensional chemical state plots: a standardized data set for use in identifying chemical states by X-ray photoelectron spectroscopy. J. Anal. Chem. 1979, 51, 466–482. 10.1021/ac50040a005. [DOI] [Google Scholar]
- Al-Gaashani R.; Radiman S.; Daud A. R.; Tabet N.; Al-Douri Y. XPS and optical studies of different morphologies of ZnO nanostructures prepared by microwave methods. Ceram. Int. 2013, 39, 2283–2292. 10.1016/j.ceramint.2012.08.075. [DOI] [Google Scholar]
- Ganesh R. S.; Durgadevi E.; Navaneethan M.; Patil V. L.; Ponnusamy S.; Muthamizhchelvan C.; Kawasaki S.; Patil P. S.; Hayakawa Y. Tuning the selectivity of NH3 gas sensing response using Cu-doped ZnO nanostructures. Sens. Actuators, A 2018, 269, 331–341. 10.1016/j.sna.2017.11.042. [DOI] [Google Scholar]
- Goktas A. High-quality solution-based Co and Cu co-doped ZnO nanocrystalline thin films: Comparison of the effects of air and argon annealing environments. J. Alloys Compd. 2018, 735, 2038–2045. 10.1016/j.jallcom.2017.11.391. [DOI] [Google Scholar]
- Papadimitriou V. C.; Stefanopoulos V. G.; Romanias M. N.; Papagiannakopoulos P.; Sambani K.; Tudose V.; Kiriakidis G. Determination of photo-catalytic activity of un-doped and Mn-doped TiO2 anatase powders on acetaldehyde under UV and visible light. Thin Solid Films 2011, 520, 1195–1201. 10.1016/j.tsf.2011.07.073. [DOI] [Google Scholar]
- Yan J.; Wu G.; Guan N.; Li L.; Li Z.; Cao X. Understanding the effect of surface/bulk defects on the photocatalytic activity of TiO2: anatase versus rutile. Phys. Chem. Chem. Phys. 2013, 15, 10978–10988. 10.1039/c3cp50927c. [DOI] [PubMed] [Google Scholar]
- Zhang X.; Qin J.; Xue Y.; Yu P.; Zhang B.; Wang L.; Liu R. Effect of aspect ratio and surface defects on the photocatalytic activity of ZnO nanorods. Sci. Rep. 2014, 4, 4596. 10.1038/srep04596. [DOI] [PMC free article] [PubMed] [Google Scholar]