Abstract
Objective. To compare the mean national enrollment rates of underrepresented minority (URM) students in a pharmacy school with mean rates in California pharmacy schools, and identify barriers faced by URM students during the application process.
Methods. The American Association of Colleges of Pharmacy (AACP) enrollment data from 2005 to 2014 were used to compare the demographics of California pharmacy schools with the average enrollment of URM students in pharmacy schools nationally. A survey was administered to students in the 2017 and 2018 classes at Touro University California College of Pharmacy to identify common barriers that students faced in pursuing pharmacy education.
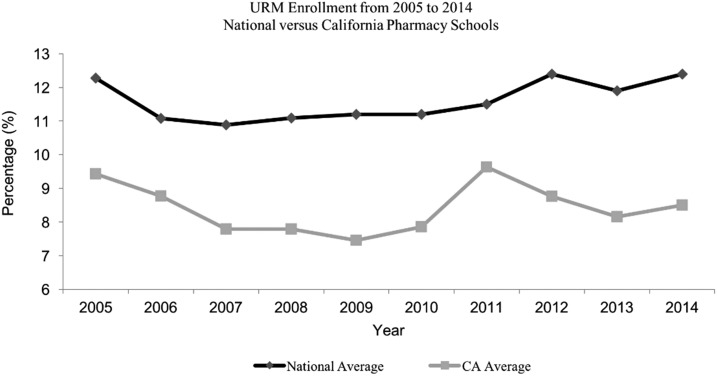
Results. The average enrollment of URM in pharmacy programs nationally was 12.3% in 2005, compared to 12.4% in 2014. The average enrollment of URM in California pharmacy schools was 9.4% in 2005 compared to 8.5% in 2014. The top barriers to pursuing pharmacy education that students reported included the cost of tuition (43.4%), prerequisite requirements (36.9%), and obtaining letters of recommendation (32.3%).
Conclusion. The average enrollment of URM students in pharmacy schools nationally has remained higher than that in California pharmacy schools across the years studied. California pharmacy programs should develop strategies to alleviate the barriers identified and further diversify pharmacy education.
Keywords: minority, pharmacy school, barriers, enrollment
INTRODUCTION
The state of California has experienced significant population growth over the past several decades. The population is projected to grow from 38.5 million in 2014 to 42.5 million by 2025.1,2 At the same time, the population of California has undergone significant shifts in its racial and ethnic makeup. Over the past decade, California’s non-Hispanic white population declined from 47% to 40%, while its Hispanic and Asian populations increased from 32% to 38% and 9% to 13%, respectively. The populations of African Americans and Native Americans in California have remained stable at 6% and 0.4%, respectively.1,2 As California grows and diversifies, there will be increasing demand for health care services to meet the needs of its residents.
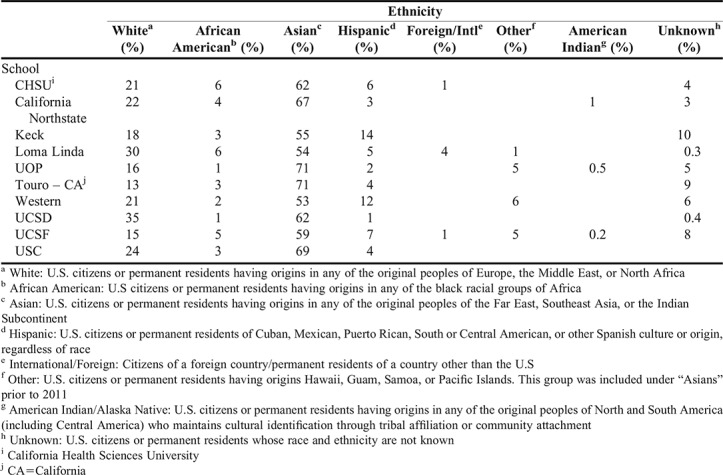
Traditionally, the underrepresented minority (URM) population in the United States included African Americans, Hispanic Americans, Native Americans, Puerto Ricans, and Asians.3 Asians were not included as URMs in our definition, as this population makes up over 50% of California pharmacy students as depicted in Appendix 3. Underrepresented minorities make up 30% of the United States population but are projected to increase to 54% by 2050.4 By 2060, an estimated 77% of the population in California will be nonwhite.4 However, the proportion of URMs in health care professions does not follow these projected trends.3,5,6 The United States Department of Health and Human Services report highlights the disparities that exists, particularly in the field of pharmacy. Between 2010 and 2012, 73.7% of pharmacists in the United States were white (non-Hispanic), 18% were Asian, 5.9% were African American, 4% were Hispanic, and 0.2% were American Indian or Alaska Native.7 These statistics highlight the need for greater diversity in the pharmacy workforce.
Diversity in the health care workforce enhances communication and trust between patients and practitioners, improves patient compliance with follow-up visits, and promotes access to health care services for URM populations.3,8 When given the choice, URM patients are more likely to select health care professionals of their own racial or ethnic background and to report higher satisfaction and better quality of care when seen by these professionals.9-12 Proper communication with health care providers allows patients to better understand their treatment options and results in improved adherence to therapy.11
The American Association of Colleges of Pharmacy (AACP) has stated that “diversity in the professional workforce can only be achieved through diversity in the classroom.”13 Moreover, URM pharmacy students are more likely to practice in underserved areas after graduating.14 Therefore, building a diverse pharmacy workforce starts with the matriculation of more URM applicants into pharmacy programs.
Students enrolled in California pharmacy schools do not reflect the state’s demographics, which in turn may affect the quality of care being delivered to patients and limits the options of available providers. This study aims to understand the trends in URM enrollment in California pharmacy schools as compared to national trends and to identify potential barriers for URMs pursuing a career in pharmacy. Although trends in URM enrollment in medical and dental schools have been studied, this is the first study of its kind in the field of pharmacy.15-17
METHODS
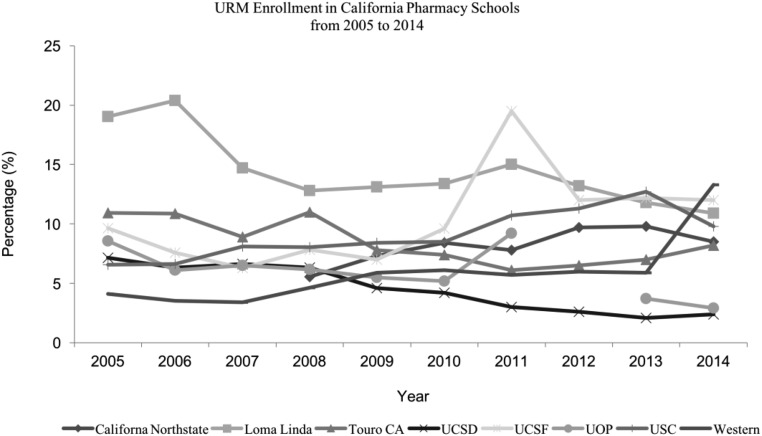
Data regarding California pharmacy school student enrollment from 2005 to 2014 were obtained from AACP. The AACP data were exhaustive and included applicant data, enrollment data, and data on degrees conferred. The data were further categorized by gender and ethnic background. Enrollment data for this 10-year period were extracted and converted into scatter plots. One scatter plot examined the average enrollment of URM pharmacy students nationally compared to the average enrollment of URM pharmacy students in California (Figure 1). The second scatter plot examined the average enrollment of URM students into each California pharmacy school (Figure 2). Both scatter plots were formatted as percent enrollment (y-axis) versus year (x-axis). Appendix 1 contains additional information regarding the demographics of each California pharmacy school in 2005, 2009, and 2014.
Figure 1.
Comparing National vs. California Pharmacy School Enrollment Patterns of URM Students from 2005-2014
Figure 2.
Comparison of URM Enrollment Patterns at Eight California Pharmacy Schools from 2005-2014
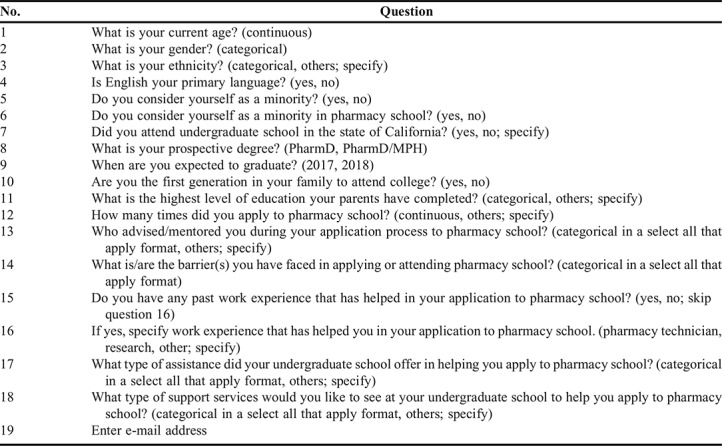
Additionally, a cross-sectional survey assessing barriers to pursuing pharmacy education was administered to first- and second-year pharmacy students at Touro University California College of Pharmacy (TUC COP) in May 2015 via the online survey website, Qualtrics (Provo, UT). Survey questions are listed in Table 1 and survey data were represented as percentages. Specific survey questions allowed participants to select “other” and enter text to elaborate on their response. Similar responses were then grouped and analyzed in the same manner as the designated response selections. Barriers reported were further analyzed with respect to each ethnicity. Significant barriers, defined as barriers reported by at least 50% of students of the same ethnic group when applying to pharmacy school, were identified. Each participant was asked to take the survey on a computer and, after completion of the survey, had the option to enter a a raffle for $10 gift card. The study was approved by Touro University California’s Institutional Review Board.
Table 1.
Survey Questions Asked to Assess Common Barriers That Applicants Face in Pursuing Pharmacy Education in California as Part of a Study of Underrepresented Minorities
RESULTS
Figure 1 depicts the average enrollment of URM students in California pharmacy schools compared to the national average. In 2005, URM enrollment in California was 9.4% vs the national average of 12.3%. In 2010, the URM enrollment in California was 7.9% vs the national average of 11.2%. Lastly, the URM enrollment in California in 2014 was 8.5% vs the national average of 12.4%.
Figure 2 illustrates the percentage of URM students enrolled in California Northstate University (CNU), Loma Linda University (LLU), TUC COP, Western University of Health Sciences (Western), University of California San Diego (UCSD), University of California San Francisco (UCSF), University of Southern California (USC), and University of the Pacific (UOP) from 2005 to 2014. The highest URM enrollment in 2005 was at LLU with 19%, while the lowest URM enrollment was at Western with 4.1%. In 2014, the highest URM enrollment was at Western with 13.3%, while the lowest URM enrollment was at UCSD with 2.4%. The 2012 minority enrollment data for UOP were unavailable. Also, two California pharmacy schools that did not start enrolling students until 2014, Keck Graduate Institute (KGI) and California Health Sciences University (CHSU), were excluded from the study.
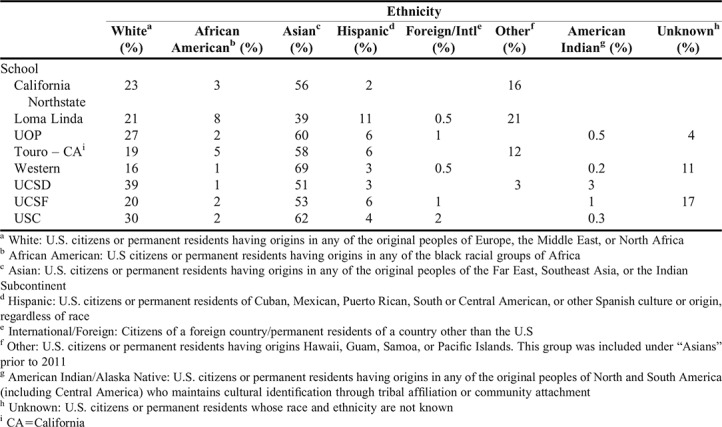
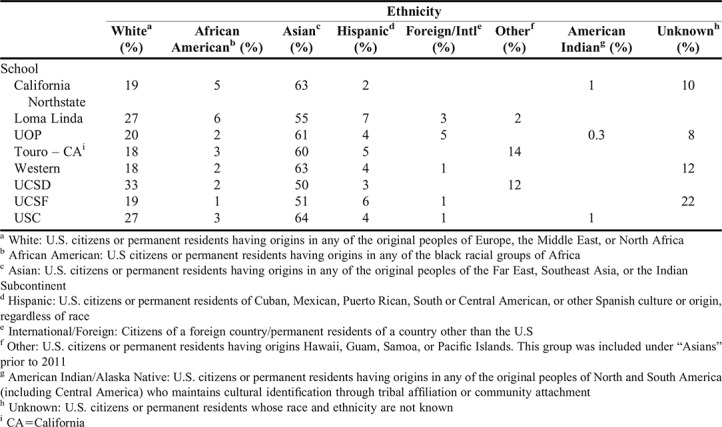
From 2005 to 2014, Asian/Native Hawaiian students were the highest represented ethnic group in all California pharmacy schools, comprising about 59% of the total number of pharmacy students enrolled each year. White students averaged about 23% of total enrollment. Students of unknown ethnicity or of two or more ethnic backgrounds averaged around 8% yearly. Hispanic and African American students comprised 4.5% and 3% of total enrollment, respectively. International students made up around 1%. American Indian and Alaska Native students were consistently the lowest represented ethnic group in all California pharmacy schools (Appendix 1).
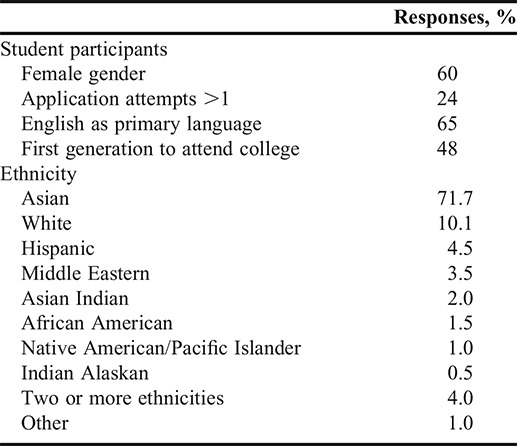
For the survey portion of this study, 210 students from the classes of 2017 and 2018 at TUC COP were recruited. After excluding five individuals who did not consent and seven individuals who submitted incomplete surveys, 198 responses were included in the analysis. The majority (60%) of the participants were female and had a mean age of 27±3.8 years. Over 70% of respondents had applied to pharmacy school only once, and approximately half were among the first generation in their family to attend college. The majority of the respondents were Asian (71.7%), followed by white (10.1%). The other groups represented, including Hispanic, Middle Eastern, Asian Indian, African American, Native American/Pacific Islander, Indian Alaskan, those of two or more ethnicities, and students who indicated “other,” each comprised less than 5% of the student population (Table 2).
Table 2.
Demographics of Participants in a Survey to Identify the Barriers That Underrepresented Minorities Face When Applying to Pharmacy School in California, (N=198)
Students reported that the rising cost of tuition (43.4%), prerequisite requirements (36.9%), obtaining letters of recommendation (32.3%), interview preparation (23.2%), and low undergraduate grade point average (GPA) (21.7%) were the most substantial barriers to applying to pharmacy school. The barriers that seemed to affect the least number of students (ie, had the lowest responses) included Pharmacy College Admission Test (PCAT) results, distance from home, inadequate college education preparation, and religious beliefs (Table 3).
Table 3.
Barriers That Pharmacy Students Enrolled in a California University Faced in Pursuing Pharmacy Education, N=198
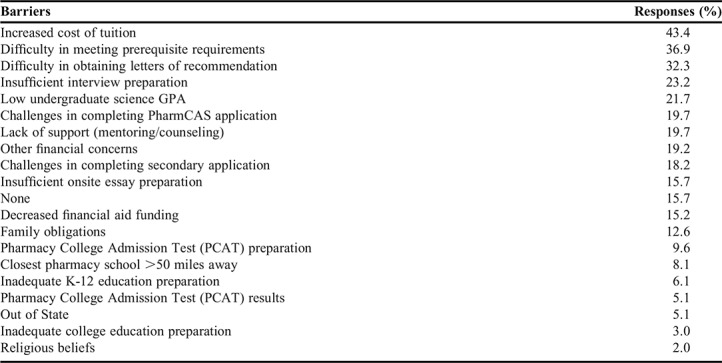
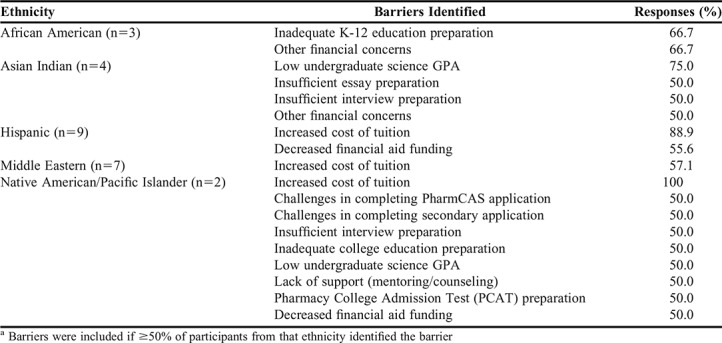
Table 4 highlights significant barriers faced by each ethnicity. All ethnic groups selected some type of financial barrier. African American students specifically expressed that inadequate academic preparation during grades K-12 was a barrier when applying. Asian Indian students selected insufficient essay and interview preparation, low undergraduate science GPA, and other financial concerns as barriers. Finally, barriers reported by students who were Native American/Pacific Islander included PCAT preparation, challenges in completing PharmCAS and secondary applications, inadequate college education preparation, low undergraduate science GPA, lack of support, increased cost of tuition, and decreased financial aid funding.
Table 4.
Major Barriers Faced by Pharmacy Students of Different Ethnicities
DISCUSSION
This study identified enrollment patterns of URMs in California pharmacy schools using data from AACP. This study was the first of its kind in that it focused on pharmacy students, while prior research primarily focused on diversity in medical and dental school admissions.
Race and ethnicity data obtained from AACP was compared with state-level data from the United States Census Bureau. Although the results did not evaluate significance, it is important to note overall trends. In California, the population in 2015 was 72.9% white, 38.8% Hispanic, 6.5% African American, 14.7% Asian, 1.7% American Indian and Alaska Native, and 0.5% Native Hawaiian and Other Pacific Islander.18 The AACP data on race and ethnicity collected on California pharmacy schools indicate average enrollment from 2005 to 2014 was 59.4% Asian, 23% White, 4.6% Hispanic, 3.1% African American, and 0.3% American Indian.19 Furthermore, the AACP data showed that 62% of students enrolled in California pharmacy schools were Asian, while only 14.7% of California’s population were Asian. In contrast, only 5% of students enrolled in California pharmacy schools were Hispanic despite that this ethnicity represented nearly 40% of the state population. African American and American Indian enrollment in California pharmacy schools combined has averaged below 5% each year.
The US Census Bureau reported that in 2015 the population of the United States was 77.1% white, 17.6% Hispanic, 13.3% African American, 5.6% Asian, 1.2% American Indian and Alaska Native, and 0.2% Native Hawaiian and Other Pacific Islander.18 Compared to California, the average enrollment of URMs in pharmacy programs nationally was higher during the study period (2005-2014), despite other states having lower percentage of URMs. These enrollment patterns over the past decade show a need to address the disparity in URM enrollment in California pharmacy programs.
Racial and ethnic disparities in enrollment have also been identified in nursing, dental, and medical schools. National enrollment in basic nursing programs in 2014 consisted of only 12.2% African American, 8.1% Hispanic, 5.9% Asian, and 1.5% American Indian.20 Dental schools also had low enrollment of URMs, with only 7.8% Hispanic, 4.4% African American, 0.3% American Indian, and 0.2% Native Hawaiian students enrolled from 2010 to 2011.21 Finally, medical schools had low enrollment of URM students nationally, with only 5.8% African American, 5.1% Hispanic, 0.1% American Indian/Alaskan Native, and 0% Native Hawaiian students enrolled in 2014.22 Underrepresented minority enrollment in nursing, dental, and medical schools is similar to enrollment trends at pharmacy schools nationwide (Figure 1). The profession of pharmacy and the entire health care system require systemic changes in order to meet the needs of, and improve health care outcomes for, a diversifying US population. These changes may include implementation of programs to alleviate the financial burden of higher education, increased recognition of URM health professionals, and directed efforts to recruit URMs into health care programs.23
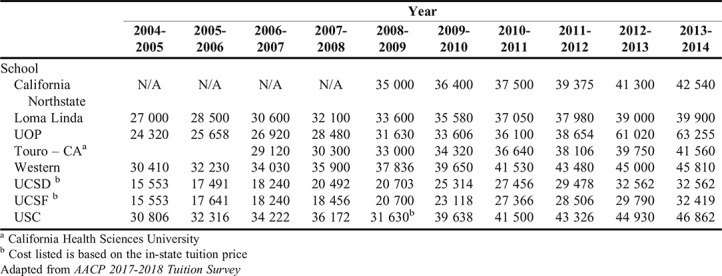
Additionally, the study determined the challenges that students encountered when applying to pharmacy school, specifically those of the classes of 2017 and 2018 at TUC COP. The demographics of TUC COP survey participants were similar to those of California pharmacy students’ demographics obtained from AACP data collected in 2014. One of the top barriers faced by Hispanics, Native Americans/Pacific Islanders, and Middle Easterners at TUC COP was the increased cost of tuition, as the national average cost of pharmacy school tuition had risen 54% in the previous eight years.24 California pharmacy school tuition increases from 2005 to 2014 are depicted in Appendix 2. Students may consider the high cost of pharmacy school tuition a barrier because of the rise in student loan debt, which on average reached $123,063 nationally for graduating pharmacy students in 2012.24
Subsequent to financial concerns, meeting prerequisite requirements and obtaining letters of recommendation were reported as barriers to applying to pharmacy school by the students surveyed. African Americans most often reported inadequate K-12 and college education as the greatest barrier, while Native American/Pacific Islanders and Asian Indians most often reported low undergraduate science GPAs as their main barrier. Providing additional assistance to URMs prior to and during college may help alleviate these barriers and encourage these students to apply to graduate education programs, and thereby improve classroom diversity.
Efforts are being made to address the barriers that URMs face in pursuing degrees in health care professions. The Urban Health Program (UHP), established in 1978 at the University of Illinois, focuses on diversifying health care professionals in medicine, dentistry, pharmacy, nursing, allied health, and public health through early outreach to URM elementary or secondary students.25 Since the establishment of UHP, the University of Illinois has graduated over 5000 URM students in health care professions. Furthermore, a study on Undergraduate Science Students Together Reaching Instructional Diversity and Excellence (USSTRIDE) in Florida from 2008 to 2012 aimed to increase medical school acceptance rates of African American and Hispanic students. The USSTRIDE offers an array of mentoring services including premedical advising, early clinical experiences, and public speaking tutorials. The USSTRIDE students had slightly lower Medical College Admission Test (MCAT) scores than but comparable GPAs to non-USSTRIDE students. A comparison study showed that 75% of USSTRIDE students matriculated into medical school compared to 49% of non-USSTRIDE students.26
Additionally, several programs have been established to increase the number of URM into pharmacy schools. The University of Illinois’s Pathways to Pharmacy program introduced pharmacy curriculum and work experience as a pharmacy technician to URM high school students. A survey conducted prior to participation showed that only 40 of 120 students planned to pursue a career in pharmacy. However, after completion of the six-week program, that number increased to 88 students.27 The University of North Carolina (UNC) pharmacy program implemented an Office of Recruitment Development and Diversity Initiatives (ORDDI), which initiated efforts to promote racial diversification. Some of its programs included extensive recruitment of URMs, conducting educational research, and developing pharmacy awareness to engage prospective URM students. After the establishment of ORDDI, the number of URM students at UNC increased from 19% to 25% from 2007 to 2012.28
As previously discussed, California pharmacy school enrollment rates do not reflect the current population being served, which may affect the quality of care being delivered. Past studies evaluating the implementation of programs that introduce the practice of pharmacy to URM high school students demonstrated higher URM interest in pursuing the pharmacy profession.27 Moreover, educational programs targeting underserved middle school students and junior fellows were effective in motivating URMs to pursue careers in health care.30 Thus, engaging URMs at a young age with educational outreach programs could be an effective approach to diversifying the classroom and advancing the pharmacy profession.
This study was not without limitations. First, we were unable to assess whether low URM enrollment in California pharmacy schools was due to a low percentage of URM students applying to pharmacy schools or a low percentage of URM students being accepted. Second, the survey was only administered to students who were already accepted into pharmacy school. Therefore, surveying students not accepted into pharmacy school may have resulted in different barriers being reported. Third, the survey was only administered to students from TUC COP, which may have limited the generalizability of the survey results. Future investigations should aim to survey students from all California pharmacy schools to develop a more comprehensive list of barriers to pursuing pharmacy education. Fourth, the current study evaluated barriers to URM enrollment but did not assess URM graduation rates. Finally, the survey of enrolled pharmacy students assessed the barriers to pharmacy school admission that group faced, but did not assess why these were significant barriers. Also, the data is limited in terms of age as it was collected several years ago. Future research should investigate why these were the top barriers and develop strategies to mitigate them.
CONCLUSION
This study highlights the large discrepancy in enrollment trends that has persisted over the past decade or more in pharmacy education. The average enrollment of URMs in California pharmacy schools remained relatively unchanged from 2005 to 2014, despite an increase in the state’s URM population. Furthermore, the average enrollment of URM students in pharmacy schools nationally remained higher than that in California pharmacy schools during the study period. A larger study that surveys students from all California pharmacy schools should be conducted to identify the barriers they encountered when applying to pharmacy school. California pharmacy programs could then develop effective strategies to alleviate these identified barriers and diversify pharmacy education.
Appendix 1. Enrollment Demographics of Each California Pharmacy School in 2005, 2009, and 2014
A. 2005 Fall Enrollment at California Pharmacy Schools
B. 2009 Fall Enrollment at California Pharmacy Schools
C. 2014 Fall Enrollment at California Pharmacy Schools
Appendix 2.
California Pharmacy School Tuition from 2005 to 2014
REFERENCES
- 1.Hayutin AM KK, Reynolds G, Rodriguez-SackByrne C, Teller A. Understanding California's Demographic Shifts. 2011; http://longevity3.stanford.edu/wp-content/uploads/2012/10/Excerpts-Understanding-Californias-Demographic-Shifts-12-7-11.pdf. Accessed date January 1, 2018.
- 2.Johnson Hans LH. California’s Future: Population. Public Policy Institute of California. Public Policy Institute of California; 2015. https://www.ppic.org/publication/californias-future-population/. Accessed January 1, 2018.
- 3. The rationale for diversity in the health professions: A review of the evidence. Department of Health and Human Services, Health Resources Administration, Bureau of Health Professions. 2006. semanticscholar.org/6df3/f71b73df07800b82250c2bf87ce594bbf667.pdf?ga=2.211986580.144191368.1567996445-669364661.1567996445. Accessed January 1, 2018.
- 4.Teixeira R, Frey WH, Griffin R. States of Change: The Demographic Evolution of the American Electorate, 1974-2060. Center for American Progress. 2015; https://cdn.americanprogress.org/wp-content/uploads/2015/02/SOC-report1.pdf. January 1, 2018.
- 5. Bernstein R, Edwards T. An older and more diverse nation by midcentury. US Census Bureau News. 2008;14.
- 6.Smith SG, Nsiah-Kumi PA, Jones PR, Pamies RJ.Pipeline programs in the health professions, part 1: preserving diversity and reducing health disparities J Natl Med Assoc 20091019836–840.845-851 [DOI] [PubMed] [Google Scholar]
- 7. Sex, Race, and Ethnic Diversity of U.S. Health Occupations (2010-2012). U.S. Department of Health and Human Services, Health Resources and Services Administration, National Center for Health Workforce Analysis. Published 2014. Accessed January 1, 2018.
- 8.Williams DR, Costa MV, Odunlami AO, Mohammed SA. Moving upstream: how interventions that address the social determinants of health can improve health and reduce disparities. J Public Health Manag Pract. 2008;(14 Suppl):S8–S17. doi: 10.1097/01.PHH.0000338382.36695.42. [DOI] [PMC free article] [PubMed] [Google Scholar]
- 9.Cooper-Patrick L, Gallo JJ, Gonzales JJ, et al. Race, gender, and partnership in the patient-physician relationship. JAMA. 1999;282(6):583–589. doi: 10.1001/jama.282.6.583. [DOI] [PubMed] [Google Scholar]
- 10.Cooper LA, Powe NR. Disparities in patient experiences, health care processes, and outcomes: the role of patient-provider racial, ethnic, and language concordance. Commonwealth Fund. New York, NY; 2004. https://collections.nlm.nih.gov/catalog/nlm:nlmuid-101669869-pdf. Accessed January 1, 2018.
- 11.Echeverri M, Brookover C, Kennedy K. Assessing pharmacy students’ self-perception of cultural competence. J of Health Care for the Poor and Underserved. 2013;24(10):64–92. doi: 10.1353/hpu.2013.0041. [DOI] [PMC free article] [PubMed] [Google Scholar]
- 12.Saha S, Taggart SH, Komaromy M, Bindman AB. Do patients choose physicians of their own race? Health Affairs. 2000;19(4):76–83. doi: 10.1377/hlthaff.19.4.76. [DOI] [PubMed] [Google Scholar]
- 13. Report of the Ad Hoc Committee on Affirmative Action and Diversity 2000. https://www.aacp.org/sites/default/files/affirmativeactiondiversitycmte102000.pdf. Accessed February 1, 2018.
- 14.Nkansah NT, Youmans SL, Agness CF, Assemi M. Fostering and managing diversity in schools of pharmacy. Am J Pharm Educ. 2009;73(8):Article 152. doi: 10.5688/aj7308152. [DOI] [PMC free article] [PubMed] [Google Scholar]
- 15.Castillo-Page L. Diversity in medical education: facts & figures 2012. Association of American Medical Colleges: Diversity Policy Programs. https://www.aamc.org/download/497934/data/diversityinmedicaleducation_factsandfigures2012.pdf. Accessed February 1, 2018.
- 16.Carlisle DM, Gardner JE, Liu H. The entry of underrepresented minority students into United States medical schools: an evaluation of recent trends. Am J Pub Health. 1998;88(9):1314–1318. doi: 10.2105/ajph.88.9.1314. [DOI] [PMC free article] [PubMed] [Google Scholar]
- 17.Okwje I, Anderson E, Siaya L, Brown LJ, Valachovic RW. U.S. dental school applicants and enrollees, 2006 and 2007 entering classes. J Dental Educ. 2008;72(11):1350–1391. [PubMed] [Google Scholar]
- 18.United States Census Bureau. QuickFacts California. https://www.census.gov/quickfacts/table/RHI125215/06,00. Published 2015. Accessed August 15, 2016.
- 19.American Association of Colleges of Pharmacy. Student Applications, Enrollments and Degrees Conferred. 2016; http://www.aacp.org/resources/research/institutionalresearch/Pages/StudentApplications,EnrollmentsandDegreesConferred.aspx. Accessed February 1, 2018.
- 20.National League for Nursing. NLN Biennial Survey of Schools of Nursing, 2014. Percentage of Minorities Enrolled in Basic RN Programs by Race-Ethnicity: 1995, 2003 to 2005, and 2009 to 2014. http://www.nln.org/newsroom/nursing-education-statistics/nursing-student-demographics. Accessed August 3, 2016.
- 21. Total Enrollment in Advanced Dental Education Programs in 2010-11, by Race and Ethnicity. Data Source: American Dental Association, Survey Center, Surveys of Advanced Dental Education 2010-2011. http://www.adea.org/publications/tde/Pages/Students/advanced-dental-students.aspx.
- 22.Kaiser Family Foundation's State Health Facts. Distribution of Medical School Graduates by Race/Ethnicity. Association of American Medical Colleges (AAMC), Data and Analysis, Total Graduates by U.S. Medical School and Race and Ethnicity 2014-2015; http://kff.org/other/state-indicator/distribution-by-race-ethnicity/. Accessed August 3, 2016.
- 23. Sullivan LW. Missing persons: minorities in the health professions, a report of the Sullivan Commission on Diversity in the Healthcare Workforce. 2004.
- 24.Cain J, Campbell T, Congdon HB, et al. Complex issues affecting student pharmacist debt. Am J Pharm Educ. 2014;78(7):Article 131. doi: 10.5688/ajpe787131. [DOI] [PMC free article] [PubMed] [Google Scholar]
- 25.Toney M. The long, winding road: one university's quest for minority health care professionals and services. Acad Med. 2012;87(11):1556–1561. doi: 10.1097/ACM.0b013e31826c97bd. [DOI] [PubMed] [Google Scholar]
- 26.Campbell KM, Berne-Anderson T, Wang A, Dormeus G, Rodríguez JE. USSTRIDE program is associated with competitive black and Latino student applicants to medical school. Med Educ Online. 2014;19:24200. doi: 10.3402/meo.v19.24200. [DOI] [PMC free article] [PubMed] [Google Scholar]
- 27.Awé C, Bauman J. Theoretical and conceptual framework for a high school pathways to pharmacy program. Am J Pharm Educ. 2010;74(8):1–11. doi: 10.5688/aj7408149. [DOI] [PMC free article] [PubMed] [Google Scholar]
- 28.White C, Louis B, Persky A, et al. Institutional strategies to achieve diversity and inclusion in pharmacy education. Am J Pharm Educ. 2013;77(5):Article 97. doi: 10.5688/ajpe77597. [DOI] [PMC free article] [PubMed] [Google Scholar]
- 29.Dunn FT. California Health Sciences University (CHSU) Strategic Plan. February 20, 2016. https://chsu.edu/wp-content/uploads/CHSU-StrategicPlan_r3.pdf. Accessed February 1, 2018.
- 30.Goldsmith CA, Tran TT, Tran L. An educational program for underserved middle school students to encourage pursuit of pharmacy and other health science careers. Am J Pharm Educ. 2014;78(9):Article 167. doi: 10.5688/ajpe789167. [DOI] [PMC free article] [PubMed] [Google Scholar]


