Abstract
In this paper, measurements of the optical properties (diffuse reflectance, total and collimated transmittance) of brain tissues in healthy rats and rats with C6-glioma were performed in the spectral range from 350 to 1800 nm. Using these measurements, characteristic tissue optical parameters, such as absorption coefficient, scattering coefficient, reduced scattering coefficient, and scattering anisotropy factor were reconstructed. It was obtained that the 10-day development of glioma led to increase of absorption coefficient, which was associated with the water content elevation in the tumor. However, further development of the tumor (formation of the necrotic core) led to decrease in the water content. The dependence of the scattering properties on the different stages of model glioma development was more complex. Light penetration depth into the healthy and tumor brain was evaluated.
1. Introduction
Gliomas are one of the most common types of primary brain tumors and the leading cause of death by brain diseases in both children and adults [1]. The median survival of patients with gliomas of the brain ranges from 12 to 15 months [2–4]. In spite of the use of the most aggressive methods for the treatment of gliomas, survival benefit is only a few months [4].
The tumors classified as gliomas include a wide variety of histology [1]. To make the glioma diagnostics more objective, since 2016 World Health Organization (WHO) uses phenotypic and genotypic parameters for classification of glioma [5]. Further to this, tumors are graded (I, II, III, and IV) according to their anticipated biological behavior, from the least malignant to the most malignant: grade I has benign cytological features, grade II is characterized by moderate cellularity without anaplasia or mitotic activity, grade III has cellularity, anaplasia, mitoses, and grade IV is same as grade III plus microvascular proliferation and necrosis [6]. Early clinical diagnosis of brain gliomas is crucial for success patients’ treatment.
Up to now, microscopic pathology with pathological markers, histopathology, immunohistochemical stains, and other methods are used techniques for glioma analysis [7–9]. They take a significant amount of time and resources to obtain a reliable result [7]. Development of the novel approaches for diagnostics and intraoperative imaging of gliomas is relevant, in particular, terahertz pulsed spectroscopy [10,11], coherent anti-Stokes Raman scattering microscopy [12], multiphoton and optical coherence tomography (OCT) [13,14], fluorescent spatial frequency domain imaging [15], molecular imaging using MRI-photoacoustic-Raman nanoparticles [16], and etc. have been suggested.
The detailed knowledge about optical parameters in the wide spectral range is very important for evaluation of the ability of laser radiation to penetrate into brain. It is a key for optical diagnostic as well as therapeutic applications. The penetration of light in the visible/NIR into healthy brain is well characterized [17–23]. However, for glioma, available information about its optical properties related to the different stages of malignancy is not yet enough. In particular, absorption and scattering coefficients, and scattering anisotropy factor, have been measured in vitro in the range 350–1100 nm for human gliomas with the grade II [18,24] and in the range 400-800 nm for gliomas with the grade III [24]; absorption, scattering, and reduced scattering spectra, and the light penetration depth have been obtained in the range 350-1300 nm [19,21] for the human malignant gliomas, and in the range 350–1000 nm for glioblastoma and oligodendroglioma [20]; the light penetration depth has been evaluated in the narrow range of 610-710 nm for human astrocytomas with the grades I-II and III and glioblastoma [25]. Diffuse reflectance spectra of human glioma in vivo have been measured in the range 400–800 nm [19]. For glioma in rats in vitro the absorption and reduced scattering coefficients and light penetration depth at the wavelength 632 nm have been presented in Ref. [22]. These data relate to the separate grades of glioma, nonetheless the change of glioma optical properties in the wide spectral range during its development is not presented yet up to now.
Our study has aimed to measure absorption, scattering, reduced scattering coefficients, and scattering anisotropy factor of brain tissues in healthy rats and rats with a C6 model glioblastoma (7, 10, and 30 days) in a wide spectral range from 350 to1800 nm.
2. Structure and physiological properties of C6-glioma
Glioblastoma multiforme (GBM) is the most common and aggressive form among all brain tumors (grade IV WHO). The development of the glioblastoma is accompanied by the following main symptoms: headaches, dysfunction of memory and general brain function, visual impairment, poor speech, impaired sensitivity and motor activity, pathological changes in behavior, loss of appetite, etc. [26].
The development of the disease begins with glial cells. It is known that one of the types of glia, namely astrocytes, leads to abnormal cell growth. Therefore, another name of the tumor is astrocytoma with grade IV [27]. These tumors tend to be morphologically multiform. The main characteristic features of GMB are the presence of central necrosis, palisading cells around the area of necrosis, and marginal proliferation of endothelial cells (microvascular hyperplasia) [27,28]. Other histological features of GBM are the following: increased mitosis, hypercellularity, atypical nuclei and cellular pleomorphism, and the development of lumina, reminiscent of kidney glomeruli [29]. GBM also shows regions of hemorrhage and a genetic diversity with various deletions, amplifications and point mutations [30]. Combinations of some or all of these features result in marked histological heterogeneity [27].
Developed model system of brain tumors closely resembles the actual mechanisms of tumor growth. C6-glioma cell line is morphologically similar to the human GBM [31–34]. Intracranial growth of the rapidly proliferating transplanted C6-glioma cells results in the formation of morphologically malignant solid tumors. Characteristic features of the model GMB are nuclear pleomorphism, high mitotic index, foci of tumor necrosis and intratumoral hemorrhage, and parenchymal invasion. Palisading cells delineate the foci of necrosis and lymphocytic infiltration, with the occasional formation of proteinaceous eosinophilic edema fluid and neovascularization characterizing these tumors [31–33]. The mean survival time of rats after intracerebral implantation of 105 C6-glioma cells is 28 ± 5 days [34].
Differences between normal brain and glioma observed using THz spectroscopy have been attributed to increased water content in the tumor (owing to the newly generated blood vessels and the body fluids around necrotic debris) and changes of cell density (owing to the rapid proliferation of tumor cells resulted in a higher number of cells in the tumor region) and the protein concentration in a tumor [11,35–37]. It has been shown for the C6 model GBM that the percentage of water is approximately 5% larger and the percentage of cell nuclei is at least approximately 15% higher in tumor tissue than in the normal tissue [35]. The refractive index of the gliomas has higher value than that of intact tissues [11,35].
Multiphoton tomography images of model gliomas have also shown a considerable increase in cellular density (2.5 times greater than that in the molecular layer of the rat cerebral cortex adjacent to the tumor) [14].
Assessment of angiogenesis in C6-glioma using the methods of magnetic resonance imaging (MRI), histology, and immunohistology has shown that the tumor is characterized by a large decrease in vessel density at the core during its growing due to the tumor cell proliferation, which decreases host vessel density and induces angiogenesis at the periphery of the tumor. At this, the blood volume fraction has not been changed during observation (11-25 days after implantation), and the vessel sizes have increased in the core and, to a lesser extent, at the periphery of the tumor [34].
The irregular structure of the tumor tissues is the cause of heterogeneity of OCT signal: an increased level of scattering is characteristic for the tumor and a low level corresponds to the foci of necrosis and the hemorrhages [14]. From the OCT data, the optical attenuation is generally higher in gliomas (in comparison with normal tissue) due to higher cell density and nuclear-to-cytoplasmic ratio [38]. As it is noted in Refs. [38,39], brain cancer can have a lower as well as a higher overall attenuation when compared with noncancer matter in dependence on the matter (white or grey) surrounds the tumor. However, Ref. [40] shows that C6-glioma consists mostly of round-like structures (cells) with loose spatial arrangement and, thus, has the lowest attenuation coefficient in relation to white and grey matter and do not manifest pronounced backscattering and polarization properties. These problems make actual the study of the tissue optical properties at the different stages of model glioma development.
3. Materials and methods
3.1. Animals
Adult rats (males, 250-280 g) were used in all experiments. The animals were housed under standard laboratory conditions, with access to food and water, ad libitum. All procedures were performed in accordance with the International Guiding Principles for Biomedical Research Involving Animals [41]. The experimental protocol was approved by the Committee for the Care and Use of Laboratory Animals at Saratov State University (Protocol № 7, 02/07/2018).
3.2. Implantation of glioma cells (GCs)
The rats were pretreated by premedication with Seduxen (Gedeon Richter, Hungary) in dose of 50 µg/mL, then deeply anesthetized with intraperitoneal Zoletil (Virbac, France) in dose of 100 µg/kg, and immobilized on the stereotactic system (Narishige, Japan) by fixation of the head. Hair was removed at the site of the planned operation and a cut was made in the area of the planned injection at selected coordinates.
The object of the study was cell lines C6 of rat glioma obtained from the Russian Cell Culture Collection of Vertebrates, Institute of Cytology, Russian Academy of Sciences, St. Petersburg. The GCs (5×10⁵ cells per rat) were implanted into the caudate putamen area using stereotaxic apparatus at the following coordinates: Ap-1 mm; L-3.0 mm; V-4.5 mm, TBS-2.4 mm. The GCs were injected with a Hamilton microsyringe in a volume of 15 µL at a rate of 3 µL/min. The duration of implantation did not exceed 10-15 min. After the implantation of GCs, the wound was closed and treated with 2%-brilliant green solution. The animal was placed in a clean cage. The glioma growth was assessed by the MRI of the brain using the Clinscan 7T tomograph (Bruker, Germany) in T2-weighted images.
3.3. Sample preparation
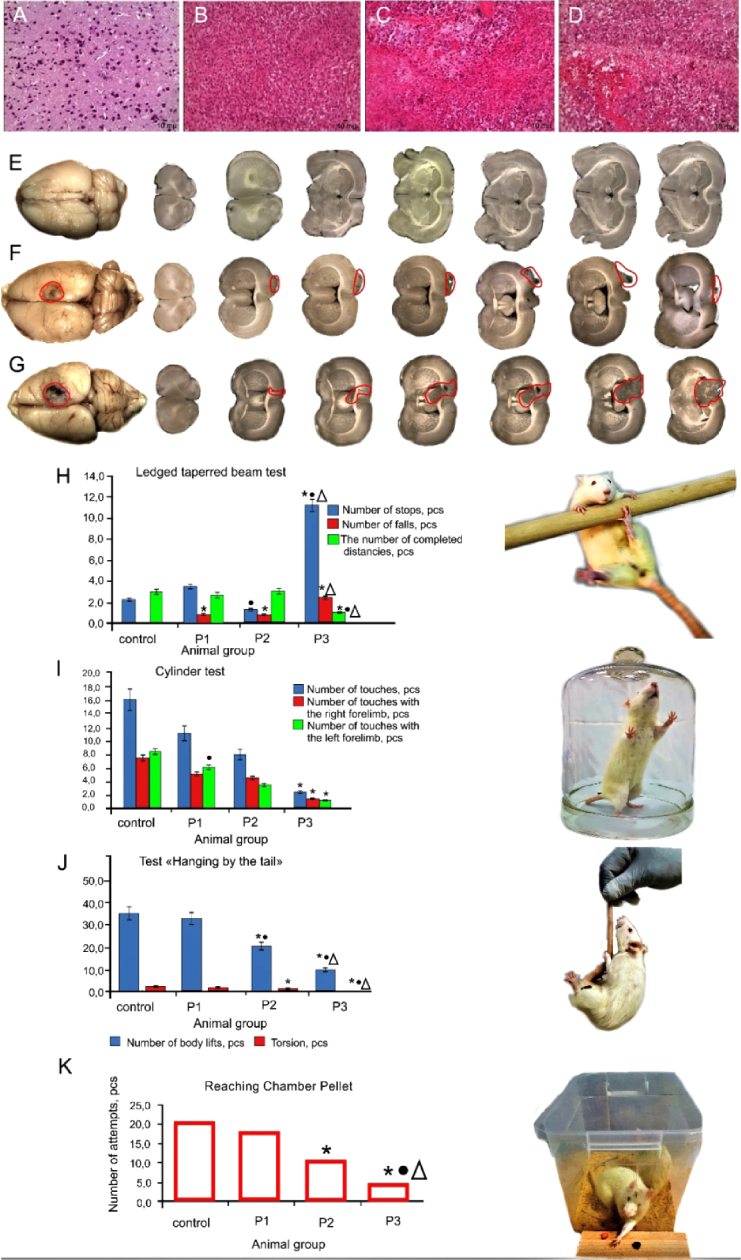
Morphological and histological analysis of the brain tissues and behavior tests clearly demonstrated significant changes in the rat brain related to progression of glioma 7-10-30 days after GCs implantation (see Appendix, Fig. 8). Therefore, withdrawal of the animals from the experiment and sampling of tissues for morphological and optical study were performed in these time intervals of glioma growing.
For the optical measurements 12 samples of the brain tissue of healthy rats and the rats with the C6-glioma: 7 days (6 samples), 10 days (5 samples), and 30 days (1 sample), were used. Sections for the measurements were cut using lancet and surgical scissors. The samples were rinsed prior to spectroscopic measurements; however some blood residuals remained within the tissue.
For mechanical support, the brain tissue samples were sandwiched between two glass slides without (or with minimal) compression. The distance between the glass slides was regulated by plastic spacers. Thickness of the spacer stacks was matched with the sample thickness. The thickness of each sample was measured with a micrometer in several points and averaged. Precision of the measurements was ±1 µm. The average thickness of the samples was 0.41 ± 0.14 mm (control); 0.25 ± 0.03 mm (7-day glioma); 0.21 ± 0.03 mm (10-day glioma); 0.17 ± 0.01 mm (30-day glioma).
3.4. Spectral measurements
The measurements of optical properties (diffuse reflectance and total transmittance) of brain tissue samples were performed using a UV-3600 spectrophotometer with an integrating sphere LISR-3100 (Shimadzu, Japan) in the spectral range from 350 to 1800 nm. Inner diameter of the sphere is 150 mm, size of the entrance port is 20 × 20 mm and diameter of the exit port is 13 mm. As a light source, a halogen lamp with filtering of the radiation in the studied spectral range was used. The diameter of an incident light beam on the tissue sample was 4 × 4 mm. Scan rate was 2 nm/sec.
To measure the collimated transmittance we used a specially designed add-on device (Fig. 1(1-3) ), which consisted of a standard holder (4-5) to fix a tissue sample (6) and a system of six pinholes (2-3) with diameters 2 mm. Two pinholes were placed in a reference channel (8) and four pinholes were placed in a sample (measuring) channel (7). The distance between the external pinholes was 125 mm, and between the internal ones it was 55 mm. The holder with the sample was placed in the center. The device was colored into mate black to prevent light reflectance from the surfaces. To provide beam collimation this device was put into the spectrophotometer instead the standard holder. The reference channel remained empty during the measurement of collimated transmittance of the sample.
Fig. 1.
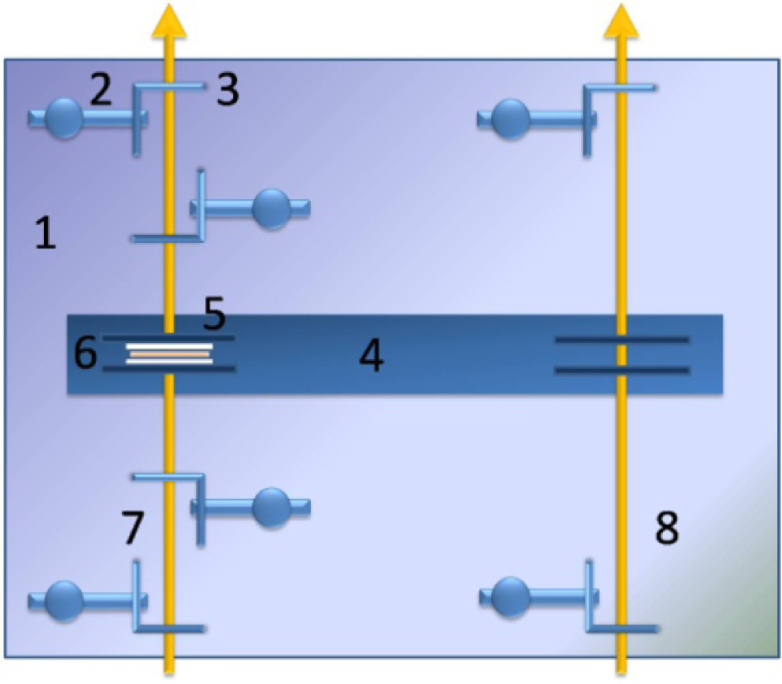
Device for the collimated transmittance measurement: 1 is the plate; 2 is the pinhole’s holder (6 pcs.); 3 is the pinhole with a diameter 2 mm (6 pcs.); 4 is the plate for fixation of the samples; 5 is the sample clip (2 pcs.), 6 is the tissue sample sandwiched between two glass slides, 7 is the measuring channel, 8 is the reference channel.
All measurements were performed at room temperature (∼20 °C).
3.5. Evaluation of optical properties of tissues
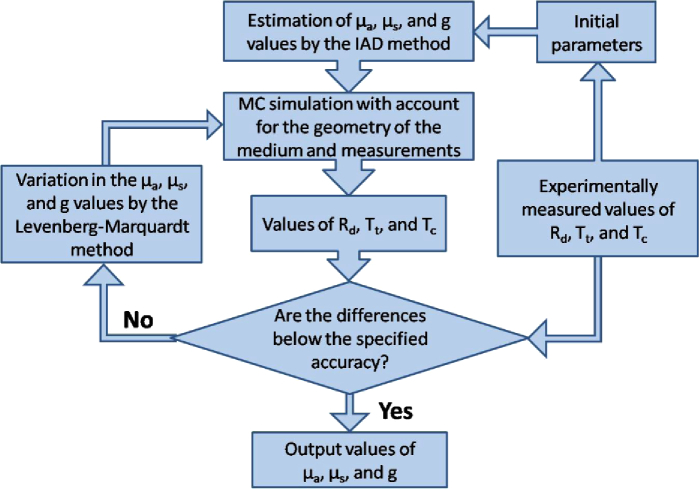
The inverse Monte Carlo method (IMC) described in details in Refs. [42,43] was used for determination of the absorption (µa) and the scattering (µs) coefficients, and scattering anisotropy factor (g) of a tissue from the measured values of the total and collimated transmittance and the diffuse reflectance. The IMC method included two steps. In the first step the experimental data (the total and collimated transmittance and the diffuse reflectance) were processed by the inverse adding-doubling (IAD) method [44], the main purpose of which was to obtain a more accurate initial approximation. This approach significantly reduced the computational time needed for reconstruction of the optical parameters of tissues. In the second step the resulting values of µa, µs and g were refined using the IMC method by minimizing the target function:
with the boundary condition . Here, , , , , , are the diffuse reflectance and total and collimated transmittance experimentally measured and theoretically calculated by the Monte Carlo (MC) method [45], taking into account the geometry of the medium under the study.
To minimize the target function the Levenberg-Marquardt nonlinear least-squares-fitting algorithm described in detail by Press et al. [46] was used. The iterative procedure continued until the measured and calculated data were matched with a given accuracy (less than 1.0%).
Figure 2 shows a flowchart of the method used. In the block of the initial parameters we set the sample and measurement geometry, the parameters of the integrating sphere, etc. After the introduction of the initial parameters, the experimental data were processed by the IAD method.
Fig. 2.
The flowchart of the IMC method used for determination of the tissue optical properties.
As the initial values of µa, µs and g in the block of the initial parameters, we used the solutions to the system of Eqs. (1)–(3) [44]:
| (1) |
| (2) |
| (3) |
where µt = µa + µs is the attenuation coefficient (cm−1); is the reduced scattering coefficient (cm−1); and l is the thickness of the measured sample of biological tissue (cm).
All data were presented as mean ± standard deviation for results obtained from all studied samples.
4. Results and discussion
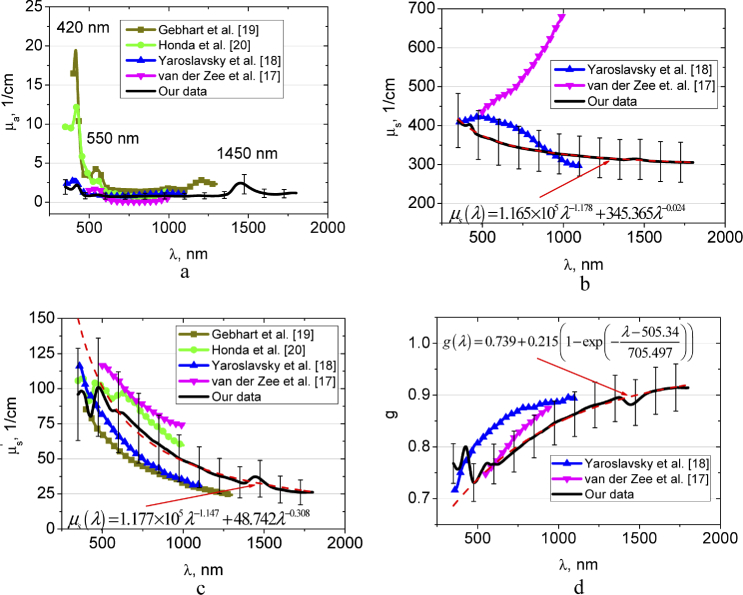
Figure 3 shows spectra of the absorption, scattering, reduced scattering coefficients, and anisotropy factor of the healthy brain tissue obtained from our experimental data, where they are compared with the available data in literature [17–20]. In our study, we have not differentiated the intact brain tissues into the white and gray matter. The absorption and scattering spectra demonstrate significant deviation, that is, usual for majority of the label-free spectroscopy and imaging modalities [10,11,17–25]. High dispersion of the spectra might be attributed to heterogeneous character of tissues.
Fig. 3.
The wavelength dependences of the absorption coefficient µa (a), scattering coefficient µs (b), reduced scattering coefficient (c), and scattering anisotropy factor g (d) of the rat healthy brain tissues measured in this paper and presented in Refs. [17–20]. In (b-d) approximations of experimental data using presented formulas are shown.
In the spectra of the absorption coefficient, absorption bands of blood deoxyhemoglobin (420 and 550 nm [47]) and water (1450 nm [48,49]) dominate the spectra with consistently low absorption over the spectral range under the study. The absorption bands of water located at 976 and 1197 nm [48,49] are considerably less visible. It is well seen the good agreement between our data and the data by Yaroslavsky et al. [18] in the range 450-1100 nm and the data by Honda et al. [20] in the range 520-1000 nm.
The scattering spectra of the tissues under study in the region from 600 to 1300 nm gradually decrease towards longer wavelengths, which are generally consistent with the character of the spectral behavior of the scattering characteristics of biological tissues [50–53]. In the regions of the absorption bands of hemoglobin and water which are manifested as an increase in light scattering can be associated with the influence of the imaginary part of the complex refractive index of the scattering centers (erythrocytes from residual blood and hydrated cell components) [42,43,54]. The same behavior of the reduced scattering coefficient in the region of hemoglobin absorption was observed in Ref. [20]. Generally, and g from Refs. [17–20] are in a good agreement with our data. However, the spectral dependence of obtained by van der Zee et al. [17] has the opposite trend in comparison with our data and results presented in Ref. [18].
Figure 3(b,c) shows approximations of the wavelength dependence of the scattering coefficient and reduced scattering coefficient by the sum of power functions , where λ is the wavelength and w is the wavelength exponent. The wavelength exponent characterizes the mean size of the tissue scatterers and defines spectral behaviour of their scattering properties [50–52]. The first item reflects the spectral behaviour defined by small, so-called Rayleigh (or Rayleigh-Gans) scatterers, and the second item is defined by large, so-called Mie scatterers [53]. In Figs. 3(b) and (c) it is well seen, that in the spectral range from 600 to 1300 nm these power laws well approximate the experimental data. Obtained values of the wavelength exponent are 1.178 and 0.024 for µs and 1.147 and 0.308 for , respectively, are the typical ones for many tissues [54,55]. The spectral dependence of scattering anisotropy factor (see Fig. 3(d)) has been approximated using the form: , where A, B, C, and D are the some empirical constants [55].
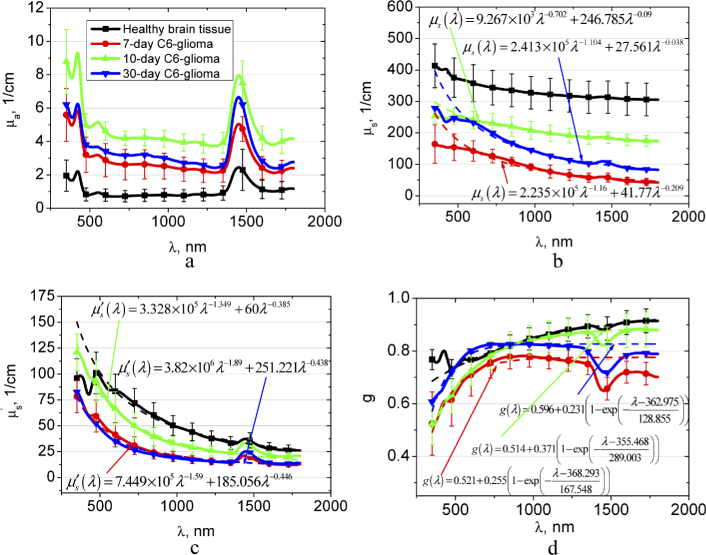
Figure 4 presents the spectra of the optical parameters of the brain tissues with different stages of the C6-glioma development in comparison with the healthy brain tissue. Experimental data for the tumor scattering coefficient, reduced scattering coefficient, and scattering anisotropy factor are also approximated. Figure 4(a) demonstrates the gradual increase of µa for glioma in the spectral region of blood and water bands in comparison with the healthy tissue during 10 days. It can be related to the increase of tissue vascularization and edema. The results of our study are confirmed by the earlier-reported differences between healthy brain tissues and gliomas, which were demonstrated on the glioma models in mice and rats [10,36,37], and human postoperative gliomas [11] using the THz spectroscopy of paraffin- or gelatin embedded samples. The decrease in the µa after 30 day can be induced by extensive necrosis development (see Appendix, Fig. 8(d)).
Fig. 4.
The wavelength dependences of the absorption coefficient µa (a), scattering coefficient µs (b), reduced scattering coefficient (c), and scattering anisotropy factor g (d) of the healthy rat brain tissues and 7-10-30 days after GCs implantation. In (b-d) approximations of experimental data using presented formulas are showed.
It has been reported that in THz spectral range the contribution of other biological processes, such as increase of the cell density and alterations in the protein concentration in a tumor, is several times smaller than that of changes in water content [11,36]. In contrary, in the visible and NIR spectral range, the structural changes during glioma growing induce significant changes in the scattering properties. Figures 4(b) and (c) demonstrate that and decrease significantly in 7 days; after 10 days the scattering increases; and then it falls down again. Obviously, it is related to structural changes of the tumor in the course of development. As it has been mentioned above, the C6-glioma growing is assisted by edema that, apparently, decreases the volume fraction of the scatterers from ∼0.2 for normal tissue to ∼0.15 [35] and consequently, decreases the scattering coefficient [51]. Increase of the scattering properties observed after 10-day glioma development could be due to increase of the tumor vascularization, and therefore appearance of the large-size scatterers (blood erythrocytes, vessel walls, etc.) (see Appendix, Fig. 8(c)). Approximations, presented in Fig. 4(b) confirm the assumption. They show that wavelength exponent of Rayleigh-Gans fraction of the scattering decreases from 1.160 (for 7-day glioma) to 0.702 for 10-day glioma. Similar behavior of the wavelength exponent is observed also for reduced scattering coefficient (Fig. 4(c)); it decreases from 1.590 (for 7-day glioma) to 1.349 for 10-day glioma.
It is seen that in the spectral region from 350 to 600 nm the suggested power functions do not allow approximating the experimental data exactly enough, therefore we have calculated Mie fraction of the scatterers based on the data presented in Fig. 4(b). This result is shown in Fig. 5 . The fraction fMie of the total scattering can be calculated as for 7-day glioma; as for 10-day glioma, and as for 30-day glioma. From Fig. 5 it follows that the fMie is minimal for 7-day glioma and maximal for 10-day glioma, i.e. confirms the above assumptions.
Fig. 5.
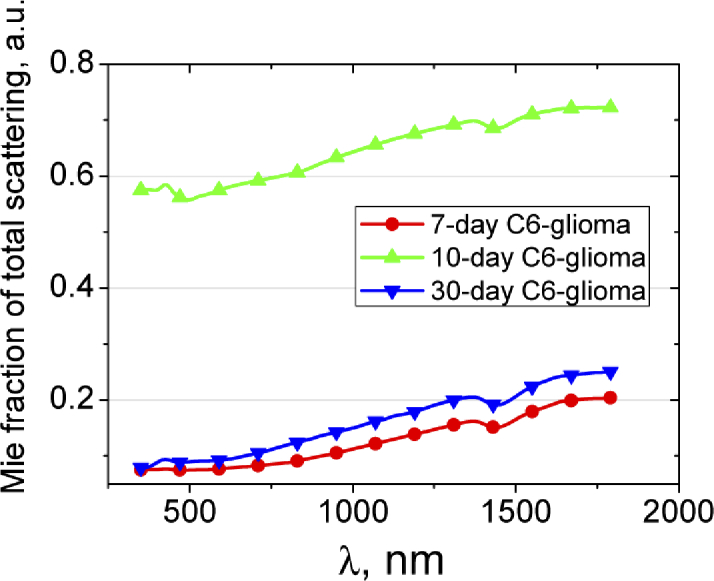
Fraction of total scattering attributed to Mie scattering. The fraction was calculated using the data presented in Fig. 4(b).
The decrease of scattering in glioma can be caused by immersion effect. Apparently, during the development of hemorrhages, erythrocytes from destroyed vessels penetrate into surrounding tissues and interstitial fluid. Increasing of water content in the interstitial fluid due to edema development causes osmolarity decreasing and, thus, local hemolysis of the erythrocytes. In this case, destroyed cell membranes and parts of the cells are the scatterers, and hemoglobin from the destroyed erythrocytes induces refractive index matching between the scatterers and interstitial fluid that, correspondingly, decreases the scattering [56]. It explains the scattering decrease to the 30th day of glioma development in our experiment. Low level scattering in glioblastomas caused by the foci of necrosis and hemorrhages has been demonstrated also in OCT measurements [14]. The behavior of scattering in the intermediate stages of glioma development can be caused by gradual tissue damage during the glioma growing into surrounding tissues (gray and white matter). As well seen in Fig. 5, the Mie fraction of the scatterers in the 30-day glioma is significantly smaller in comparison with that in the 10-day glioma, i.e. the size of effective scatterers has decreased significantly.
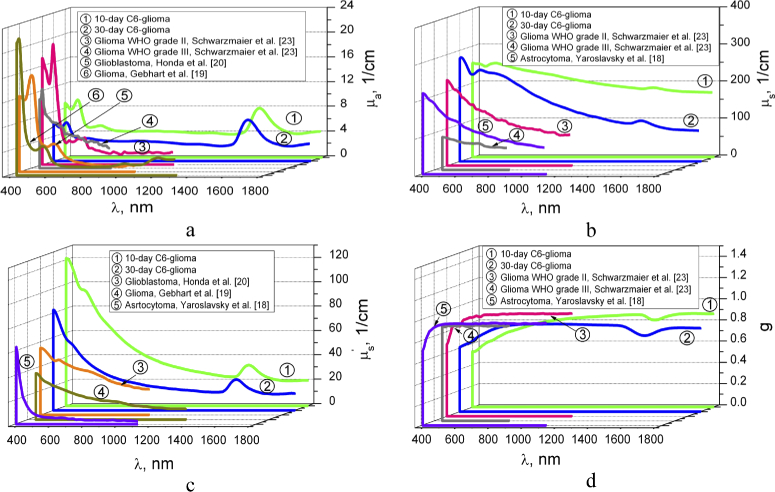
Figure 6 shows comparison of the averaged optical parameters of C6-glioma in 10 and 30 days with the results obtained by other authors for different types of gliomas [18–20,24]. We can see that the values of absorption coefficient are the closest for 30-day C6-glioma and glioma WHO grade III obtained in Ref. [24]. The most differences are observed with glioblastoma from Ref. [20]. Honda et al. [20] has reported no significant difference between the µa values of white and gray matter and brain tumor tissues. However, histological analysis has shown appearance the hemorrhage foci during glioma development (see Appendix, Fig. 8(A)-(D)) that induces the absorption growing.
Fig. 6.
The wavelength dependences of the absorption coefficient µa (a), scattering coefficient µs (b), reduced scattering coefficient (c), and scattering anisotropy factor g (d) of the 10- and 30-day C6-glioma measured in this paper and presented in Refs. [18–20,24].
Some differences in scattering and reduced scattering coefficients and g-factor between our results and the results obtained by other authors can be explained by the differences in types of the used samples as well as the sample preparation procedure. In particular, all samples, presented in Refs. [18–20,24] were obtained from brain tumor patients during open operation or autopsy performed after death; besides, the samples, presented in Refs. [19,24] were frozen before the measurements. Besides, different theoretical models and algorithms were used for calculation of the tissue optical properties. In spite of some deviation of the received experimental data from the data presented in the literature, in general, it is found a good agreement of the optical properties for a 30-day C6-glioma and glioma, glioblastoma and astrocytoma from literature.
The depth penetration of light into a biological tissue is an important parameter for the correct determination of the irradiation dose in photothermal and photodynamic therapy of glioma. Direct activation of singlet oxygen (1O2) in brain for inducing cancer cell death and cerebrovascular effects including the increase in the permeability of the blood-brain barrier (BBB) for improvement of delivery of drugs, genes, nanoparticles into the brain tissues for the treatment of gliomas attracts much attention of the community [57–59]. Also, a direct photoexcitation of singlet oxygen 1O2 may be induced by 762- and 1268-nm laser irradiation [59].
An estimate of the penetration depth of laser radiation into the healthy and malignant brain tissue (δ), defined as a depth for which intensity of a light beam is attenuated in 2.7-fold, has been performed using equation written in the diffusion approximation [60]. The result is shown in Fig. 7 .
Fig. 7.
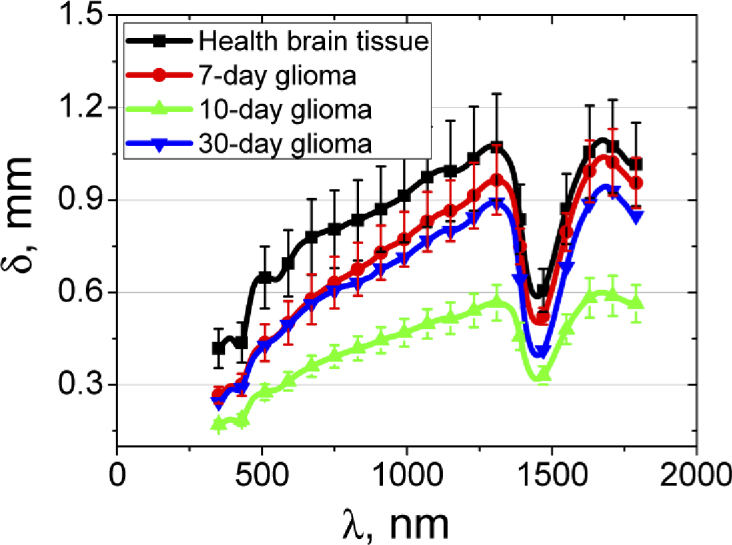
The light penetration depth into the healthy brain tissues and 7-10-30 days after GCs implantation. The solid line corresponds to the averaged experimental data and the vertical lines show the standard deviation values.
It is clearly seen that, depending on the wavelength of the probing light, its depth of penetration varies considerably. For the healthy brain tissue, the maximal probing depth is found for the spectral range 1000-1300 nm, where the penetration depth is approximately 1.0 ± 0.2 mm. In the regions of the water absorption band with a maximum of 1450 nm and the hemoglobin absorption band with a maximum of 420 nm the penetration depth significantly decreases up to 0.4-0.5 mm. The penetration depth in the wavelength range 450-1064 nm for the healthy brain (Fig. 7) is close to that of white brain matter presented in Ref. [18].
The lowest penetration depth is observed for 10-day glioma that may be explained by significant increase in absorption of the tissue. In accordance with Refs. [19] and [20], in the range 630-850 nm glioma has shown the penetration depth from 1.3 to 1.7 mm and from 0.89 to 1.65 mm, respectively, that significantly exceeds the values even for healthy tissue (Fig. 7). It also can be caused by differences in types of the studied tumors.
5. Conclusion
Our work extends spectral range available for analysis of optical properties of the brain tissue in healthy rats and rats with C6-glioma, which is an adequate model of human glioblastoma multiforme. The absorption coefficient, scattering coefficient, reduced scattering coefficient, scattering anisotropy factor, and light penetration depth were obtained in 7-10-30 days in the course of tumor development. Our results clearly demonstrate that glioma development leads to increase of the absorption coefficient that is associated with the water content increase within the tumor. The changes in the scattering properties at the different stages of the model glioma growing also depend on the formation of cell clusters, vascularization, and edema. The connection between the tissue scattering and the wavelength exponent of approximating curves has been shown. A limited number of test samples, especially for a 30-day glioma, does not allow us to draw general conclusions, however, the trend in the change in the optical parameters of the tumor over time is consistent with data provided by other researchers. The optimal wavelength range for laser diagnostic and therapeutic applications in brain lies in the range of 1000–1300 nm that can be used for direct photoexcitation of 1O2 in brain.
A. Appendix
A.1. Macro-photography
The rats were euthanized with an intraperitoneal injection of a lethal dose of ketamine and xylazine. Afterward, the brains were removed and fixed in 4% buffered paraformaldehyde for two days. The brain slices (100 µm) were prepared using Vibrotome (Leica VT1200S Biosystems, Germany).
A.2. The histological analysis
The part of the samples after decapitation was fixed in 10% buffered neutral formalin. The formalin fixed specimens were embedded in paraffin, sectioned (4 µm), and stained with haematoxylin and eosin (H&E) using the standard histological protocol. Morphometric analysis of histological preparations was performed with a digital image analysis system “Medical Microvizor” µVizo-101 (LOMO, Russia).
A.3. Behavior tests
Test “Ledged tapered beam”. To carry out this test the follows were necessary: a stick with a diameter of 4 cm and a length of 1.25 m with a smooth surface, a lamp of 100 W and a box (20×20 cm) with a hole, into which an animal could easily pass. Before the test, animals needed the training. The training took 2-3 days with 5 attempts per day. Each attempt lasted until the animal successfully passed the beam from the light source into the dark box without any failures. A short break between attempts was necessary so that the animal was not accustomed. During the experiment the number of stops, falls and distances covered was taken into account in 5 minutes.
Test “Cylinder”. The animal was placed in a cylinder made of plexiglass (diameter 20 cm and height 30 cm), where it showed approximately exploratory behavior. Since the area of the bottom of the cylinder was small, the animal predominantly exhibited vertical locomotor activity, exploring the cylinder wall using its forelimbs. Rising on its hind legs, the animal used one or both forelimbs. For healthy animals, it was typical to use both forelimbs, and when injured, the animal used mostly only one limb. The number of touches of the forelimbs, as well as for the right and left forelimbs separately for 5 minutes was evaluated. Preliminary preparation of animals was not required.
Test «Hanging by the tail». This test was used to study the level of anxiety. The animal was pulled out of the cage and held by the tail at a distance of 1.5 cm from the tip while the body was in a hanging position for 5 minutes. The number of body lifts (when the animal’s muzzle reaches the base of the tail) and the number of body torsions were recorded.
Test «Reaching chamber pellet». Before conducting an experiment on motor-cognitive functions, the animal was not fed for some time. The rat was placed in a container made of plexiglass (20×30 cm) with a hole, so that the animal could stick its forelimb or nose through it. Before the hole at the distance of 1 cm, food (a piece of bread with vegetable oil) was placed so that the animal could get it easily. The experience was repeated to consolidate the skill. Further, the task was complicated: the food was placed to the right or left of the hole at a distance of 1-3 cm, so that the animal could reach it, but with an effort. The number of attempts and the time required to perform this task was fixed.
A.4. Results
Fig. 8.
Morphological and behaviors signs of glioma progression in rats: A-D – histological imaging of the rat brain before, 7-10-30 days after GCs implantation (magnification 246.4); E-G – macro-photography of the rat brain 10-30 days after GCs implantation vs. the healthy rat brain, respectively; H-K – behavior tests, including: (H) Ledged tapered beam; (I) Cylinder test; (J) Hanging by the tail; and (K) the Reaching Chamber Pellet test, respectively. Results are presented as mean ± sd (n = 7 in each group), P ≤ 0.05: *vs. the control group; • vs. rats 7 days after GCs implantation; Δ - 10 days after GCs implantation. P1, P2, and P3 groups correspond to the rats with 7-, 10-, and 30-day GCs.
presents typical histological images of the healthy brain tissue and 7, 10 and 30 days after GCs implantation, respectively. Normal brain tissue is represented by a cluster of neurons and their processes, single glial cells, and capillaries (Fig. 8(A)).
The early stage of gliobastoma (7 days after implantation) is characterized by appearance of a cluster of atypical glial cells (Fig. 8(B)). After 10 days on the background of an increase in the vascular component, areas of necrosis appear (Fig. 8(C)). At these stages, the cell polymorphism is not presented. The progression of glioma to 30 days is accompanied by increased vascular component, appearance of extensive foci of necrosis and cell polymorphism (Fig. 8(D)). Multiple foci of hemorrhage are also noted in the tumors. Glioblastoma cells penetrate into the surrounding tissue of the brain, especially in the white matter of the brain, and there is also an increase in the cerebral spinal fluid (CSF) pathway.
Figure 8(E-G) illustrates macro-photography of the brain in rats with different sized of glioma and shows that size of glioma 30 days (Fig. 8(E)) after GCs implantation is more significant than 10 days (Fig. 8(F)) after GCs implantation (average size of glioma is 7 mm2, 4 mm2, 3 mm2 30-10-7 days after GCs implantation, respectively). Figure 8(G) demonstrates a normal brain in healthy rat.
The behavior tests have confirmed histological signs of glioma progression after 7-10-30 days after GCs implantation. So, the “Hanging by the tail” and “Ledged tapered beam“ tests have demonstrated significantly reducing in the number of body rises and torsions as well as increasing in the stops and falls during movement along trajectory that have been more and more pronounced with the tumor progression during 7-10-30 days after GCs implantation (Fig. 8(J and H), respectively). The Cylinder test has showed that rats reliably less touch the walls of the cylinder with the growing of glioma vs. the healthy animals (Fig. 8(I)). The Reaching Chamber Pellet test has obtained gradual decreasing in the number of attempts to obtain a food in rats 7-10-30 days after GCs implantation vs. the control group (Fig. 8(K)).
Funding
Russian Science Foundation10.13039/501100006769 (17-75-20069 and 18-12-00328); Russian Foundation for Basic Research10.13039/501100002261 (17-02-00358-а); Ministry of Education and Science of the Russian Federation10.13039/501100003443 (17.1223.2017 AP); Research Center “Symbiosis” (АААА-А17-117102740097-1).
Author contributions
O.V.S.-G. and V.V.T designed the study. P.A.D.T. and D.K.T. performed spectral experiments. A.N.B. processed experimental data and reconstructed optical parameters. E.A.G. analyzed the results and wrote the manuscript. N.N. performed histological analysis of glioma. A.Sh. prepared glioma cultures. A.Kh, M.K., I.B., I.A. made implantation of glioma cells and neurological tests. E.Z. analyzed neurological changes in rats. A.T. and A.M. prepared samples of the brain. All authors discussed the results and commented on the manuscript text.
Disclosures
The authors declare that there are no conflicts of interest related to this article.
References
- 1.Raizer J., Parsa A., eds. Current Understanding and Treatment of Gliomas (Springer, 2015) [Google Scholar]
- 2.Wen P. Y., Kesari S., “Malignant gliomas in adults,” N. Engl. J. Med. 359(5), 492–507 (2008). 10.1056/NEJMra0708126 [DOI] [PubMed] [Google Scholar]
- 3.Fisher C.J., Lilge L., “Photodynamic therapy in the treatment of intracranial gliomas: a review of current practice and considerations for future clinical directions,” J. Innovative Opt. Health Sci. 08(01), 1530005 (2015). 10.1142/S1793545815300050 [DOI] [Google Scholar]
- 4.Buckner J. C., Brown P. D., O’Neill B. P., Meyer F. B., Wetmore C. J., Uhm J. H., “Central nervous system tumors,” Mayo Clin. Proc. 82(10), 1271–1286 (2007). 10.4065/82.10.1271 [DOI] [PubMed] [Google Scholar]
- 5.Louis D. N., Perry A., Reifenberger G., von Deimling A., Figarella-Branger D., Cavenee W. K., Ohgaki H., Wiestler O. D., Kleihues P., Ellison D. W., “The 2016 World Health Organization Classification of Tumors of the Central Nervous System: a summary,” Acta Neuropathol. 131(6), 803–820 (2016). 10.1007/s00401-016-1545-1 [DOI] [PubMed] [Google Scholar]
- 6.Ferris S. P., Hofmann J. W., Solomon D. A., Perry A., “Characterization of gliomas: from morphology to molecules,” Virchows Arch. 471(2), 257–269 (2017). 10.1007/s00428-017-2181-4 [DOI] [PubMed] [Google Scholar]
- 7.Wong M., Kaye A., Hovens C., “Targeting malignant glioma survival signalling to improve clinical outcomes,” J. Clin. Neurosci. 14(4), 301–308 (2007). 10.1016/j.jocn.2006.11.005 [DOI] [PubMed] [Google Scholar]
- 8.Jansen M., Yip S., Louis D. N., “Molecular pathology in adult gliomas: diagnostic, prognostic, and predictive markers,” Lancet Neurol. 9(7), 717–726 (2010). 10.1016/S1474-4422(10)70105-8 [DOI] [PMC free article] [PubMed] [Google Scholar]
- 9.Rüdiger T., Höfler H., Kreipe H.-H., Nizze H., Pfeifer U., Stein H., Dallenbach F. E., Fischer H.-P., Mengel M., von Wasielewski R., Müller-Hermelink H. K., “Quality assurance in immunohistochemistry: results of an interlaboratory trial involving 172 pathologists,” Am. J. Surg. Pathol. 26(7), 873–882 (2002). 10.1097/00000478-200207000-00005 [DOI] [PubMed] [Google Scholar]
- 10.Meng K., Chen T.-N., Chen T., Zhu L.-Q., Liu Q., Li Z., Li F., Zhong S.-C., Li Z.-R., Feng H., Zhao J.-H., “Terahertz pulsed spectroscopy of paraffin-embedded brain glioma,” J. Biomed. Opt. 19(7), 077001 (2014). 10.1117/1.JBO.19.7.077001 [DOI] [PubMed] [Google Scholar]
- 11.Gavdush A. A., Chernomyrdin N. V., Malakhov K. M., Beshplav Sh.-I. T., Dolganova I. N., Kosyrkova A. V., Nikitin P. V., Musina G. R., Katyba G. M., Reshetov I. V., Cherkasova O. P., Komandin G. A., Karasik V. E., Potapov A. A., Tuchin V. V., Zaytsev K. I., “Terahertz spectroscopy of gelatin-embedded human brain gliomas of different grades: a road toward intraoperative THz diagnosis,” J. Biomed. Opt. 24(02), 1 (2019). 10.1117/1.JBO.24.2.027001 [DOI] [PMC free article] [PubMed] [Google Scholar]
- 12.Galli R., Uckermann O., Temme A., Leipnitz E., Meinhardt M., Koch E., Schackert G., Steiner G., Kirsch M., “Assessing the efficacy of coherent anti-Stokes Raman scattering microscopy for the detection of infiltrating glioblastoma in fresh brain samples,” J. Biophotonics 10(3), 404–414 (2017). 10.1002/jbio.201500323 [DOI] [PubMed] [Google Scholar]
- 13.Dolganova I. N., Chernomyrdin N. V., Aleksandrova P. V., Beshplav Sh.-I. T., Potapov A. A., Reshetov I. V., Kurlov V. N., Tuchin V. V., Zaytsev K. I., “Nanoparticle-enabled experimentally trained wavelet-domain denoising method for optical coherence tomography,” J. Biomed. Opt. 23(09), 1 (2018). 10.1117/1.JBO.23.9.091406 [DOI] [PubMed] [Google Scholar]
- 14.Dudenkova V. V., Yashin K. S., Kiseleva E. B., Kuznetsov S. S., Timofeeva L. B., Khalansky A. S., Elagin V. V., Gubarkova E. V., Karabut M. M., Pavlova N. P., Medyanik I. A., Kravets L. Ya., Gladkova N. D., “Multiphoton tomography and cross-polarization optical coherence tomography for diagnosing brain gliomas: pilot study,” Sovrem. Tehnol. Med. 8(4), 64–75 (2016). 10.17691/stm2016.8.4.09 [DOI] [Google Scholar]
- 15.Sibai M., Fisher C., Veilleux I., Elliott J.T., Leblond F., Roberts D.W., Wilson B.C., “Preclinical evaluation of spatial frequency domain-enabled wide-field quantitative imaging for enhanced glioma resection,” J. Biomed. Opt. 22(7), 076007 (2017). 10.1117/1.JBO.22.7.076007 [DOI] [PMC free article] [PubMed] [Google Scholar]
- 16.Kircher M., de la Zerda A., Jokerst J. V., Zavaleta C. L., Kempen P. J., Mittra E., Pitter K., Huang R., Campos C., Habte F., Sinclair R., Brennan C. W., Mellinghoff I. K., Holland E. C., Gambhir S. S., “A brain tumor molecular imaging strategy using a new triple-modality MRI-photoacoustic-Raman nanoparticle,” Nat. Med. 18(5), 829–834 (2012). 10.1038/nm.2721 [DOI] [PMC free article] [PubMed] [Google Scholar]
- 17.van der Zee P., Essenpreis M., Delpy D. T., “Optical properties of brain tissue,” Proc. SPIE 1888, 454–465 (1993). 10.1117/12.154665 [DOI] [Google Scholar]
- 18.Yaroslavsky A. N., Schulze P. C., Yaroslavsky I. V., Schober R., Ulrich F., Schwarzmaier H.-J., “Optical properties of selected native and coagulated human brain tissues in vitro in the visible and near infrared spectral range,” Phys. Med. Biol. 47(12), 2059–2073 (2002). 10.1088/0031-9155/47/12/305 [DOI] [PubMed] [Google Scholar]
- 19.Gebhart S. C., Lin W.-C., Mahadevan-Jansen A., “In vitro determination of normal and neoplastic human brain tissue optical properties using inverse adding-doubling,” Phys. Med. Biol. 51(8), 2011–2027 (2006). 10.1088/0031-9155/51/8/004 [DOI] [PubMed] [Google Scholar]
- 20.Honda N., Ishii K., Kajimoto Y., Kuroiwa T., Awazu K., “Determination of optical properties of human brain tumor tissues from 350 to 1000 nm to investigate the cause of false negatives in fluorescence-guided resection with 5-aminolevulinic acid,” J. Biomed. Opt. 23(07), 1 (2018). 10.1117/1.JBO.23.7.075006 [DOI] [PubMed] [Google Scholar]
- 21.Sterenborg H. J. C. M., van Gemert M. J. C., Kamphorst W., Wolbers J. G., Hogervorst W., “The spectral dependence of the optical properties of human brain,” Lasers Med. Sci. 4(4), 221–227 (1989). 10.1007/BF02032451 [DOI] [Google Scholar]
- 22.Madsen S. J., ed. Optical Methods and Instrumentation in Brain Imaging and Therapy (Springer, 2013). [Google Scholar]
- 23.Golovynskyi S., Golovynska I., Stepanova L. I., Datsenko O. I., Liu L., Qu J., Ohulchanskyy T. Y., “Optical windows for head tissues in near-infrared and short-wave infrared regions: approaching transcranial light applications,” J. Biophotonics 11(12), e201800141 (2018). 10.1002/jbio.201800141 [DOI] [PubMed] [Google Scholar]
- 24.Schwarzmaier H.-J., Eickmeyer F., Fiedler V. U., Ulrich F., “Basic principles of laser induced interstitial thermotherapy in brain tumors,” Medical Laser Application 17(2), 147–158 (2002). 10.1078/1615-1615-00057 [DOI] [Google Scholar]
- 25.Svaasand L. O., Ellingsen R., “Optical properties of human brain,” Photochem. Photobiol. 38(3), 293–299 (1983). 10.1111/j.1751-1097.1983.tb02674.x [DOI] [PubMed] [Google Scholar]
- 26.AANS , Glioblastoma Multiforme – Symptoms, Diagnosis and Treatment Options, https://www.aans.org/Patients/Neurosurgical-Conditions-and-Treatments/Glioblastoma-Multiforme.
- 27.Bradshaw A., Wickremsekera A., Tan S. T., Peng L., Davis P. F., Itinteang T., “Cancer stem cell hierarchy in glioblastoma multiforme,” Front. Surg. 3, 21 (2016). 10.3389/fsurg.2016.00021 [DOI] [PMC free article] [PubMed] [Google Scholar]
- 28.Rong Y., Durden D. L., Van Meir E. G., Brat D. J., “‘Pseudopalisading’ necrosis in glioblastoma: a familiar morphologic feature that links vascular pathology, hypoxia, and angiogenesis,” J. Neuropathol. Exp. Neurol. 65(6), 529–539 (2006). 10.1097/00005072-200606000-00001 [DOI] [PubMed] [Google Scholar]
- 29.Moore K., Kim L., “Primary brain tumours: characteristics, practical diagnostic and treatment approaches,” Glioblastoma: Molecular Mechanisms of Pathogenesis and Current Therapeutic Strategies, pp. 43–75 (Springer Science & Business Media, LLC, 2009). [Google Scholar]
- 30.Holland E. C., “Glioblastoma multiforme: the terminator,” Proc. Natl. Acad. Sci. U. S. A. 97(12), 6242–6244 (2000). 10.1073/pnas.97.12.6242 [DOI] [PMC free article] [PubMed] [Google Scholar]
- 31.Whittle I. R., MacArthur D. C., Malcom G. P., Li M., Washington K., Ironside J. W., “Can experimental models of rodent implantation glioma be improved? A study of pure and mixed glioma cell line tumors,” J. Neuro-Oncol. 36(3), 231–242 (1998). 10.1023/A:1005831111337 [DOI] [PubMed] [Google Scholar]
- 32.Grobben B., De Deyn P. P., Slegers H., “Rat C6 glioma as experimental model system for the study of glioblastoma growth and invasion,” Cell Tissue Res. 310(3), 257–270 (2002). 10.1007/s00441-002-0651-7 [DOI] [PubMed] [Google Scholar]
- 33.Khomyakova T. I., Makarova O. V., Khalansky A. S., Fedoseeva V. V., Mikhaylova L. P., Khomyakov Yu. N., “Experimental models of human glioblastoma multiforme,” Clinical and Experimental Morphology 1(13), 60–69 (2015). [Google Scholar]
- 34.Valable S., Lemasson B., Farion R., Beaumont M., Segebarth C., Remy C., Barbier E. L., “Assessment of blood volume, vessel size, and the expression of angiogenic factors in two rat glioma models: a longitudinal in vivo and ex vivo study,” NMR Biomed. 21(10), 1043–1056 (2008). 10.1002/nbm.1278 [DOI] [PubMed] [Google Scholar]
- 35.Yamaguchi S., Fukushi Y., Kubota O., Itsuji T., Ouchi T., Yamamoto S., “Origin and quantification of differences between normal and tumor tissues observed by terahertz spectroscopy,” Phys. Med. Biol. 61(18), 6808–6820 (2016). 10.1088/0031-9155/61/18/6808 [DOI] [PubMed] [Google Scholar]
- 36.Oh S., Kim S.-H., Ji Y. B., Jeong K., Park Y., Yang J., Park D. W., Noh S. K., Kang S.-G., Huh Y.-M., Son J.-H., Suh J.-S., “Study of freshly excised brain tissues using terahertz imaging,” Biomed. Opt. Express 5(8), 2837–2842 (2014). 10.1364/BOE.5.002837 [DOI] [PMC free article] [PubMed] [Google Scholar]
- 37.McIntyre G., “Cell hydration as the primary factor in carcinogenesis: a unifying concept,” Med. Hypotheses 66(3), 518–526 (2006). 10.1016/j.mehy.2005.09.022 [DOI] [PubMed] [Google Scholar]
- 38.Garzon-Muvdi T., Kut C., Li X., Chaichana K. L., “Intraoperative imaging techniques for glioma surgery,” Future Oncol. 13(19), 1731–1745 (2017). 10.2217/fon-2017-0092 [DOI] [PMC free article] [PubMed] [Google Scholar]
- 39.Kut C., Chaichana K. L., Raza S. M., Ye X., McVeigh E. R., Rodriguez F. J., Quiñones-Hinojosa A., Li X., “Detection of human brain cancer infiltration ex vivo and in vivo using quantitative optical coherence tomography,” Sci. Transl. Med. 7(292), 292ra100 (2015). 10.1126/scitranslmed.3010611 [DOI] [PMC free article] [PubMed] [Google Scholar]
- 40.Kiseleva E. B., Yashin K. S., Moiseev A. A., Snopova L. B., Gelikonov G. V., Medyanik I. A., Kravets L. Ya., Karyakin N. N., Vitkin I. A., Gladkova N. D., “Quantitative cross-polarization optical coherence tomography detection of infiltrative tumor margin in a rat glioma model: a pilot study,” Sovrem. Tehnol. Med. 10(1), 6–13 (2018). 10.17691/stm2018.10.1.01 [DOI] [Google Scholar]
- 41.International Guiding Principles for Biomedical Research Involving Animals, CIOMS&ICLAS, http://www.cioms.ch/index.php/12-newsflash/227-cioms-and-iclas-release-the-new-international-guiding-principles-for-biomedical-research-involving-animals. [PubMed]
- 42.Bashkatov A. N., Genina E. A., Kochubey V. I., Rubtsov V. S., Kolesnikova E. A., Tuchin V. V., “Optical properties of human colon tissues in the 350-2500 nm spectral range,” Quantum Electron. 44(8), 779–784 (2014). 10.1070/QE2014v044n08ABEH015613 [DOI] [Google Scholar]
- 43.Bashkatov A. N., Genina E. A., Kozintseva M. D., Kochubei V. I., Gorodkov S. Yu., Tuchin V. V., “Optical properties of peritoneal biological tissues in the spectral range of 350-2500 nm,” Opt. Spectrosc. 120(1), 1–8 (2016). 10.1134/S0030400X16010045 [DOI] [Google Scholar]
- 44.Prahl S. A., van Gemert M. J. C., Welch A. J., “Determining the optical properties of turbid media by using the adding-doubling method,” Appl. Opt. 32(4), 559–568 (1993). 10.1364/AO.32.000559 [DOI] [PubMed] [Google Scholar]
- 45.Wang L., Jacques S. L., Zheng L., “MCML – Monte Carlo modeling of light transport in multi-layered tissues,” Comput. Methods Programs Biomed. 47(2), 131–146 (1995). 10.1016/0169-2607(95)01640-F [DOI] [PubMed] [Google Scholar]
- 46.Press W. H., Tuekolsky S. A., Vettering W. T., Flannery B. P., Numerical Recipes in C: The Art of Scientific Computing (Cambridge University Press, 1992). [Google Scholar]
- 47.Bosschaart N., Edelman G. J., Aalders M. C. G., van Leeuwen T. G., Faber D. J., “A literature review and novel theoretical approach on the optical properties of whole blood,” Lasers Med. Sci. 29(2), 453–479 (2014). 10.1007/s10103-013-1446-7 [DOI] [PMC free article] [PubMed] [Google Scholar]
- 48.Kou L., Labrie D., Chylek P., “Refractive indices of water and ice in the 065- to 25-µm spectral range,” Appl. Opt. 32(19), 3531–3540 (1993). 10.1364/AO.32.003531 [DOI] [PubMed] [Google Scholar]
- 49.Palmer K. F., Williams D., “Optical properties of water in the near infrared,” J. Opt. Soc. Am. 64(8), 1107–1110 (1974). 10.1364/JOSA.64.001107 [DOI] [Google Scholar]
- 50.Shchyogolev S. Yu., “Inverse problems of spectroturbidimetry of biological disperse systems: an overview,” J. Biomed. Opt. 4(4), 490–503 (1999). 10.1117/1.429954 [DOI] [PubMed] [Google Scholar]
- 51.Schmitt J. M., Kumar G., “Optical scattering properties of soft tissue: a discrete particle model,” Appl. Opt. 37(13), 2788–2797 (1998). 10.1364/AO.37.002788 [DOI] [PubMed] [Google Scholar]
- 52.Wang R. K., “Modelling optical properties of soft tissue by fractal distribution of scatterers,” J. Mod. Opt. 47(1), 103–120 (2000). 10.1080/09500340008231409 [DOI] [Google Scholar]
- 53.Bashkatov A. N., Genina E. A., Kochubey V. I., Tuchin V. V., “Optical properties of human skin, subcutaneous and mucous tissues in the wavelength range from 400 to 2000nm,” J. Phys. D: Appl. Phys. 38(15), 2543–2555 (2005). 10.1088/0022-3727/38/15/004 [DOI] [Google Scholar]
- 54.Bashkatov A. N., Genina E. A., Tuchin V. V., “Tissue Optical Properties,” Handbook of Biomedical Optics, pp. 67–100 (Taylor & Francis Group, LLC, CRC Press, 2011). [Google Scholar]
- 55.Bashkatov A. N., Genina E. A., Tuchin V. V., “Optical properties of skin, subcutaneous and muscle tissues: a review,” J. Innovative Opt. Health Sci. 04(01), 9–38 (2011). 10.1142/S1793545811001319 [DOI] [Google Scholar]
- 56.Tuchin V. V., Zhestkov D. M., Bashkatov A. N., Genina E. A., “Theoretical study of immersion optical clearing of blood in vessels at local hemolysis,” Opt. Express 12(13), 2966–2971 (2004). 10.1364/OPEX.12.002966 [DOI] [PubMed] [Google Scholar]
- 57.Stief T. W., “Singlet oxygen potentiates thrombolysis,” Clin. Appl. Thromb./Hemostasis 13(3), 259–278 (2007). 10.1177/1076029607302404 [DOI] [PubMed] [Google Scholar]
- 58.Madsen S. J., Gash H. M., Hong S. J., Uzal F. A., Peng Q., Hirschberg H., “Increased nanoparticle-loaded exogenous macrophage migration into the brain following PDT-induced blood-brain barrier disruption,” Lasers Surg. Med. 45(8), 524–532 (2013). 10.1002/lsm.22172 [DOI] [PMC free article] [PubMed] [Google Scholar]
- 59.Semyachkina-Glushkovskaya O. V., Sokolovski S. G., Goltsov A., Gekalyuk A. S., Saranceva E. I., Bragina O. A., Tuchin V. V., Rafailov E. U., “Laser-induced generation of singlet oxygen and its role in the cerebrovascular physiology,” Prog. Quantum Electron. 55, 112–128 (2017). 10.1016/j.pquantelec.2017.05.001 [DOI] [Google Scholar]
- 60.Tuchin V. V., Tissue Optics: Light Scattering Methods and Instruments for Medical Diagnostics (SPIE Press, 2015). [Google Scholar]


