Abstract
Objectives:
The white matter structure of the human brain undergoes critical developmental milestones in utero, which we can observe non-invasively using diffusion-weighted magnetic resonance imaging. In order to understand this fascinating developmental process, we must establish the variability inherent in such a challenging imaging environment and how measurable quantities can be transformed into meaningful connectomes.
Methods:
We review techniques for reconstructing and studying the brain connectome and explore promising opportunities for in utero studies that could lead to more accurate measurement of structural properties and allow for more refined and insightful analyses of the fetal brain.
Results:
Opportunities for more sophisticated analyses of the properties of the brain and its dynamic changes have emerged in recent years, based on the development of iterative techniques to reconstruct motion-corrupted diffusion-weighted data. While reconstruction quality is greatly improved, the treatment of fundamental quantities like edge strength require careful treatment because of the specific challenges of imaging in utero.
Conclusions:
There are intriguing challenges to overcome, from those in analysis due to both imaging limitations and the significant changes in structural connectivity, to further image processing to address the specific properties of the target anatomy and quantification into a developmental connectome.
Keywords: diffusion weighted imaging, in utero, neurodevelopment, tractography, fetal connectome
1. Introduction
With in utero diffusion-weighted magnetic resonance imaging, we can observe critical white matter development during the second and third trimesters as it organizes the foundation of the brain’s global structural connectivity [1–3]. Understanding both typical and pathological development is not only crucial for applications to individuals in a clinical setting as a diagnostic or preventative tool, but it is also a fascinating period of change as the foundation of an emerging intelligence. By acquiring accurate, detailed observations of its growth, we can better understand why the brain is connected as it is and how variations affect the developmental process. Since acquiring and processing images for such observations push the limits of available tools and analysis methods, there are exciting opportunities to overcome the challenges faced in reconstructing a meaningful fetal connectome.
Patterns in diffusion direction, typically resolved in utero down to the order of 1 mm, are often interpreted as a coherent organization of a large number of coherent connections on the axonal scale. Magnetic resonance imaging (MRI), especially in utero, is unable to capture the dynamic processes of individual neuron growth and axonal wiring, but the cumulative effect of large numbers of organized tissue is observable in large-scale fasciculation and pruning. Similarly, the effects of fiber myelination, which insulates connections and improves functional efficiency to further guide structural patterns as the brain matures, has an observable effect within a large coherent ensemble of fibers by inhibiting water diffusion perpendicular to bundle paths. For a more detailed review of these fundamental biological developmental processes, see, e.g. [4]. We can more reliably observe coherent white matter bundles in utero at a much coarser scale via diffusion-weighted imaging for subjects nearing 20 weeks gestational age (GA). One critical component to reconstruction is to treat these observations according to this corresponding scale.
Reproducibility of imaging and the subsequent connectomes has been studied in adults (e.g., [5–7]), and more recently for fetal development in utero (e.g. [1, 2, 8, 9]). In the present paper, we focus on the reproducibility of connection strength, which has shown to be more difficult to reproduce even in adults [10], although averaging over connections to produce node strength or other graph-wide measures can be reproduced better [11]. Because accurate individual connection strengths are critical to all subsequent graph analyses, the variability of these fundamental quantities must be carefully considered.
1.1. Imaging Challenges
The major challenge for imaging in utero comes from subject motion [12, 13], not only in aligning disparate positioning and orientation between frames, but artifacts from motion during the acquisition of a single planar image. The most drastic source of motion comes from the freedom of the fetus to move its head. Motion from maternal respiration tends to be less extreme, but can still reduce the accuracy even for mature fetuses when fetal motion is more constrained within the uterus. As long as the brain and anatomical landmarks remain within the field of view, iterative reconstruction techniques can correct for moderate subject motion [14, 15]. Such approaches can also reduce bias in later analyses by reconstructing volumes with cubic voxels, correcting for the typically longer distance between slices.
Other challenges are common to any type of imaging, but are compounded by the in utero imaging environment. Employing a body coil improves signal acquisition, but signal strength is limited by scan time to keep the brain within the FOV and in considering the comfort of the mother. Length scales of fetal anatomy are much smaller than in adults, and the tissues and organs themselves may only be partially developed and lack significant landmarks, e.g. cortical folding has not progressed enough to produce gyral landmarks in young fetuses. Tissue contrasts change with age [16], including transient laminar zones [17], as do diffusion properties from plasticity and myelination.
1.2. Building Connectomes
The characteristics of a connectome depend on choices by the investigators concerning what is being connected and how the definition of connectivity constructs a graph from the available imaging data [18]. Structural covariance connectomes (spatial comparisons of cortical thickness [19]) are challenging with fetal brains because of the lack of gyral landmarks on which to base a reliable parcellation, especially before 30 weeks GA. While not without significant challenges, using tractography (particularly single-tensor approximations) to define the paths for a connectome is appealing from the readily apparent visual coherence of streamlines and the correspondence with known major white matter tracts (e.g., see results in Fig. 1(c)). Despite the guidance “Don’t use tractography to provide a quantitative estimate of ‘connection strength’ “ from [20], tractography has remained a popular method for assigning connection strength, although alternatives have been proposed, such as global approaches for simulated flows [21], energy minimization [22, 23], or “analytic”’ tractography [24]. While popular, more traditional tractography approaches are dominated by streamlines that, if taken to be accurate along their entire length, yield misleading connectivity. Most reconstructed fiber streamlines migrate from one white matter tracts into another, but these diversions may only be a small portion of the entire path; even ignoring those with diversions, almost none span the entire tract. Consequently, further refinement of these paths is necessary.
Figure 1:
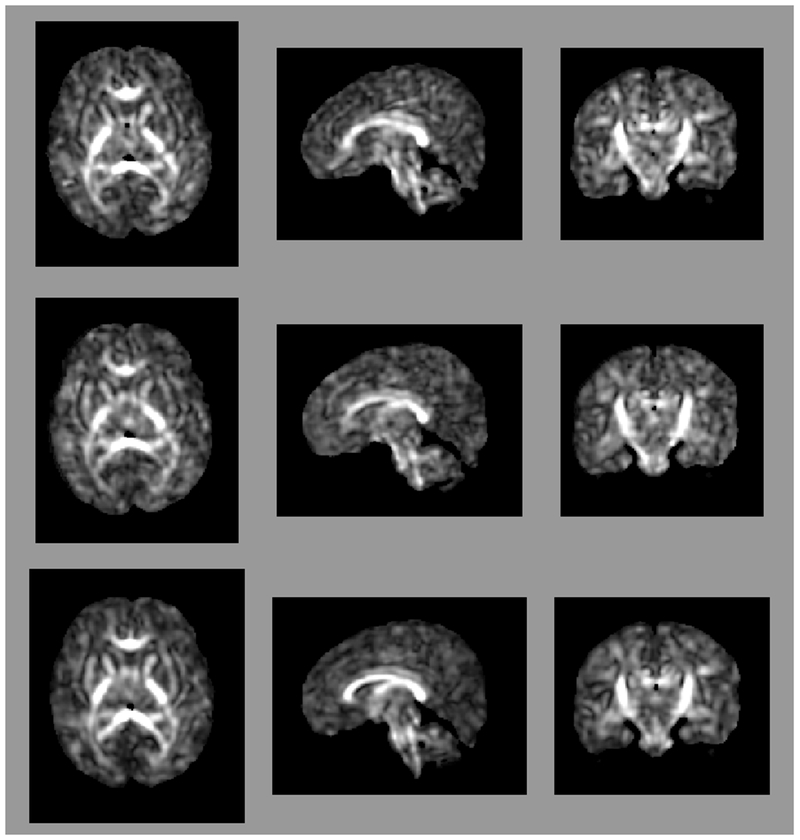
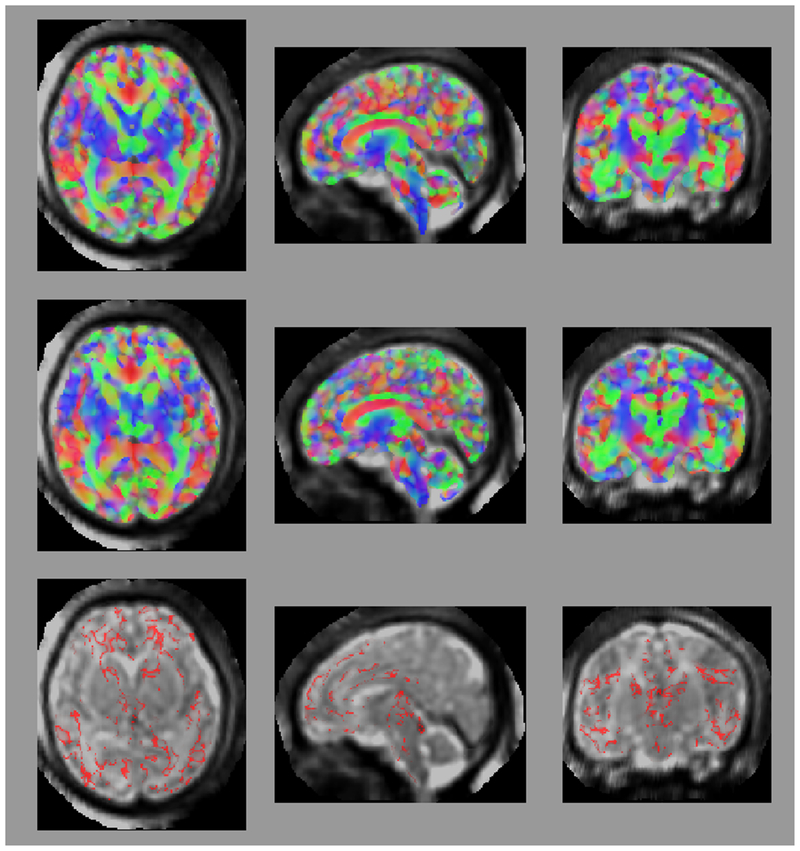
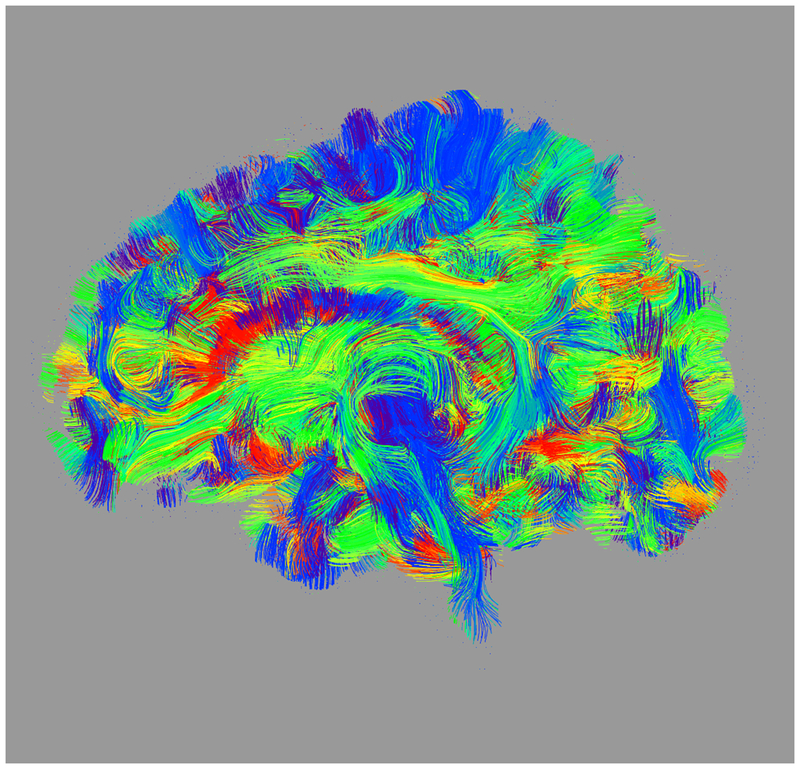
Axial (left column), sagittal (center column), and coronal (right column) views of (a) fractional anisotropy (FA) and (b) principal diffusion direction (weighted by FA) for the test (top row) and retest (middle row), with highlighted angular difference (bottom row), scaled from 0 to π/10. Grayscale range in (a) from FA = 0.0 (black) to FA = 0.4 (white). Colors in (b) show the principal direction of diffusion (red: left-right, green: anterior-posterior, blue: superior-inferior). (c) Whole brain tractography for the test subject. Colors indicate the mean direction of the fiber.
The properties of the data that divert a streamline can have effects that lead true paths to be overwhelmed by false ones, even on the level of coherent bundles [25]. While we have observed promising results from diffusion volume reconstructions that identify multiple principle directions [26], the ability to distinguish diverted from true-path streamlines — or more appropriately, to segregate which portions of streamlines fall into either category — remains a dominating challenge. It is especially important to accurately distinguish between true and misleading connections to study fetal development because the width and thickness of the tracts themselves can be on the same length scale as the limitations imposed by imaging constraints. Additionally, the shapes of tracts in utero may differ from the well-established adult forms, so that while extracting and cleaning using an atlas- (or neural network-) based approach as has shown success in adults [27–33] constructing a standard correspondence between bundles of fibers in fetal brains across ages and established tracts requires significantly more investment in data collection, processing, and analysis.
Both the construction of a diffusion field and the method employed to navigate it can affect the character of the final tractography. Each voxel may contain a single direction for reconstructed fibers, as in single-tensor DTI [34], or multiple directions as in higher order diffusion models, including constrained spherical deconvolution [35] or probabilistic tractography [36, 37]. The consequences of tractography algorithm have been reviewed [38], although limitations of in utero imaging introduce further complications. Even once such a means of connecting distance regions through tractography is chosen, there are many options for the choice of node definitions [39–42]. A common route, as we follow here, is to utilize automatic anatomy-based parcellations to define node locations.
However, one crucial drawback of this approach for fetal studies is the requirement for developmentally consistent parcellations of the cortex, which are increasingly more difficult to define at younger GAs because of the lack of cortical folding. Importantly, this introduces potential errors in parcellation that are a function of GA or developmental stage of folding that may create false developmentally-correlated features in the connectome properties. Alternatives include clustering of unassociated tractography [43–45] and adaptive node locations [46], which depend only on patterns in white matter and do not rely on supplemental anatomical landmarks. While this can extend the range of applicability of graph analyses to younger brains, such definitions for nodes are not independent from the measure of connectivity, as well as being susceptible to the same errors and biases faced by edge strength that is built from white matter tractography.
Commonly used metrics for connection strengths all aim to capture the quality and magnitude of the white matter pathways between regions. The first is raw fiber count/density Fij between nodes i and j, so that the connection strength Aij is
| (1) |
where a fiber contributes to the connection when the endpoints of its path are in each of the two regions. A second definition for connection strength makes use of the mean fractional anisotropy FAk of the voxels along the path of the fiber k to yield a connection strength of
| (2) |
Two variants of Eq. (1) attempt to correct for biases in region volume [47] and the contribution to the overall count (and possible diversions) from longer fibers [48], having the forms
| (3) |
where Vk is the volume of region k and
| (4) |
where Lk is the length of fiber k.
Each of Eqs. (1)–(4) yield different relative strengths as the basis for connectome analysis, and each is susceptible to the effects of misleading streamlines. Consequently, other measures or methods may be necessary for a more accurate and appropriate representation of connectivity. In the current paper, we explore these basic graph types to find the reproducibility of the resulting connectomes.
2. Materials and Methods
2.1. Subject selection
Subjects were recruited to be included in the University of Washington Fetal Brain Database, approved by the University of Washington Institutional Review Board (ID 00001931). A subset of 14 healthy subjects were selected for study based on age and reconstructed DWI quality, including one test-retest subject (male, ≈ 35 weeks GA) and 13 additional single-scan subjects (9 male, ≈ 34 to 36 [35.1 ± 0.5] weeks GA). All subjects are screened for abnormal development before inclusion in the healthy set.
2.2. Image acquisition
Subjects are scanned in a 1.5 T Philips Achieva dStream (software version R5) using multi-slice single shot EPI with SENSE factor 2 using a 16-channel body coil for improved signal. Standard acquisition protocol for a scan consists of three stacks of DWI volumes with resolution 2.5 mm × 2.5 mm × 4 mm, planned to be oriented along the axial, coronal, and sagittal anatomical planes. Each stack includes three sets of one b = 0 and 15 b = 600 s/mm2 volumes (TE/TR = 125/5405 ms), with a supplemental set of three consecutive b = 0 volumes for distortion correction, yielding a total of 153 volumes (135 direction-sensitive). When time permits, additional sets may be acquired, but such opportunities are uncommon.
2.3. Image volume reconstruction
Non-rigid alignment of the EPI-based DWI sets to a geometrically accurate, motion corrected T2-weighted structural image is used to correct for susceptibility-induced geometric distortions [49]. We use a polynomial model to normalize each slice’s relative signal, which can vary depending on scanner gain, coil sensitivity, and motion-induced slice-specific signal variations. Preliminary alignment of every DWI volume to a common anatomical coordinate system is manually inspected before automatic between-slice motion correction [15].
Iterative model-based 3D spatial deconvolution reconciles the separate DWI orientations in combination with simultaneous deconvolution of diffusion directions, incorporating robust intensity rejection for through-plane motion induced spin history artifacts. Fetal motion distributes the original 15 scanner-based directional estimates over a set of 64 directional bins to collect the estimates of the diffusion profile for each reconstructed 1.5 mm cubic voxel.
2.4. Tractography and Connectome
Subject-specific tissue segmentations to define the valid tractography volume, as well as gyri-based parcellations for the definition of connectome nodes are automatically generated. Tissue labeling utilizes an age-specific atlas applied to the T2-weighted MRI reconstructions (see [50]). To apply gyral parcellations from an adult atlas [51], we use the nonrigid log-demons diffeomorphic registration algorithm to estimate a mapping between adult brain atlas anatomy and each of the fetal brains, rather than aligning MRI values, which are incomparable.
We drive the alignment using the tissue labeling of cortical and non-cortical tissues automatically extracted from the fetal MRI scans. A total of six adult brains from the atlas are mapped to each fetal MRI scan and the most likely gyral label is assigned to each voxel. Lack of gyral landmarks complicates extending the anatomy-based parcellation to younger subjects, so our present focus is on older fetuses of at least 34 weeks GA. Current alternatives for fetal cortical parcellations can suffer from a lower number of parcels [52] or do not yield equivalent parcel schemes across developmental stage [53] because of insufficient folding.
We generate whole brain tractography using a deterministic streamline algorithm with adaptive step size from the Runge-Kutta-Fehlberg method (RKF45) through the field of principal diffusion directions, constructed from a single-tensor fit to each reconstructed voxel’s diffusion profile. Final fibers are downsampled to a constant step size of 0.1mm. An initial small set (240) of random seed locations generate paths that terminate in non-white matter or low FA (< 0.1) voxels, or in the case of sharp turns (> π/2 rad/mm). Subsequent sets of seed locations avoid voxels that already contain a fiber in order to produce tractography that covers the entire volume without introducing greater computational expense.
2.5. Comparing basic graph properties
The rarity of numerous supplemental stacks precludes the typical metric of intraclass correlation coefficients to evaluate the reproducibility of the constructed graphs.
As an alternative, we consider the coefficient of variation CV = σ/μ, where σ is the standard deviation and μ is the mean of a set of measurements. To quantify the variability of edge strengths within a single subject compared to the variability between subjects, we consider the ratio of the CV for each set (test-retest vs. ensemble). The logarithm of the quotient is more appropriate for the mean than the direct quotient because the relative ratios are the relevant quantity.
For similarity between graphs as a whole, a basic metric is the Dice coefficient [54] for the binarization of graphs G and H at density x, given by
| (5) |
The two graphs being compared may have different effective thresholds so that both have the same density.
Building from previous studies, we consider the edge-space similarity from [1], which is constructed from Dice coefficients between undirected graphs across graph density
| (6) |
where E is the number of edges and N is the number of nodes. The original proposed measure has the form
| (7) |
where the Dice coefficient is given by Eq. (5) and the set of densities [from Eq. (6)] cover the possible densities of the graphs. Variants on this metric, such as
| (8) |
| (9) |
have slightly different interpretations, with Eq. (8) being the mean of the Dice coefficient of all possible unique thresholds for graph binarization. Equation (9) is a similar mean, but weighted by the threshold to favor the strongest connections.
3. Results
We evaluate the reproducibility of collecting diffusion-weighted MRIs of the fetal brain in utero by collecting two sets of diffusion-weighted stacks during a single scan session for a subject ≈ 35 weeks GA. The same set of reference b0 images were used for geometry correction for both sets of stacks.
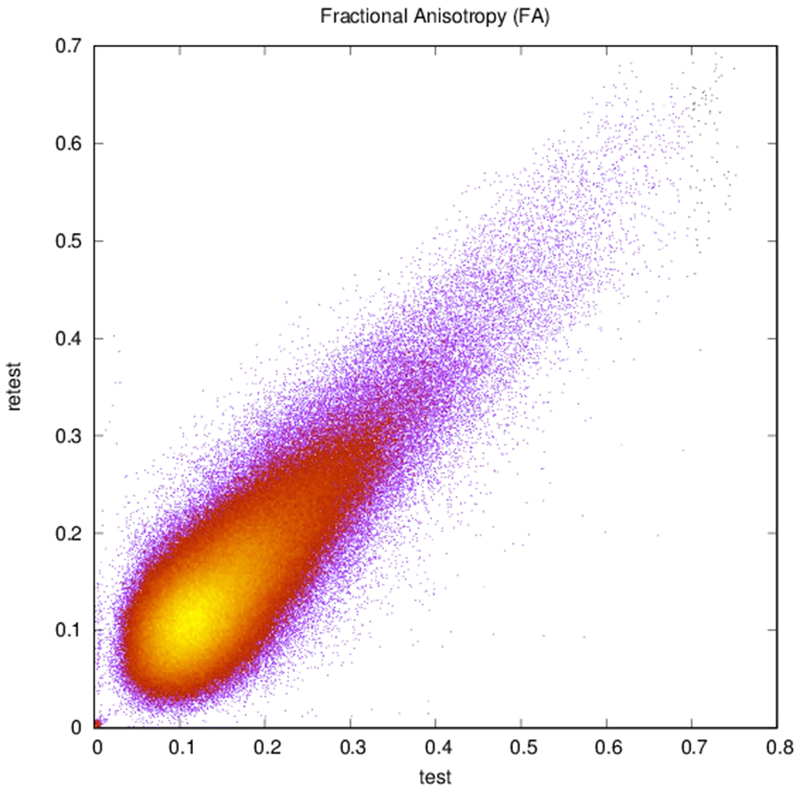
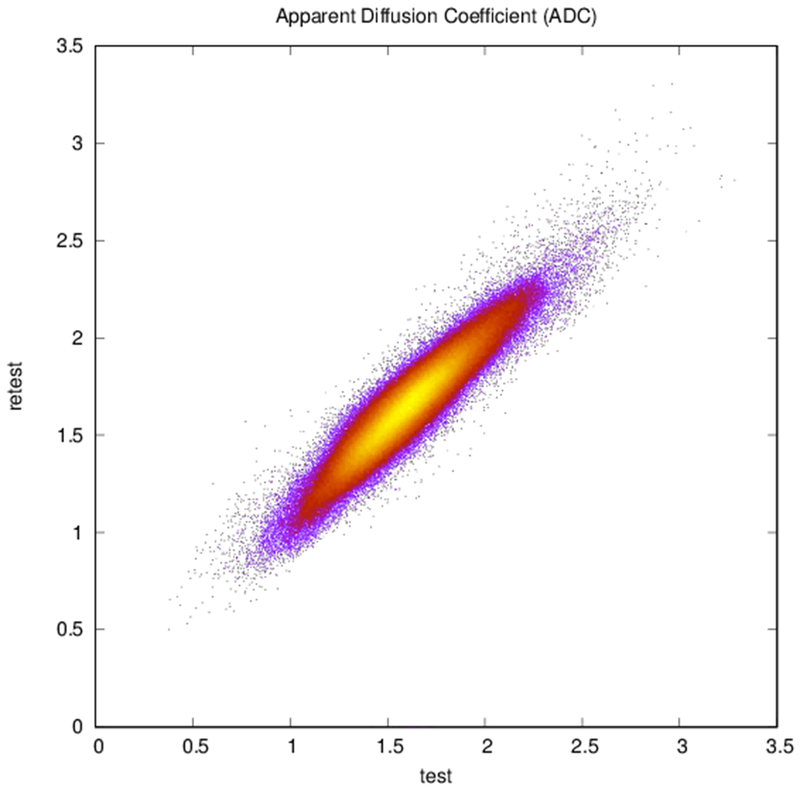
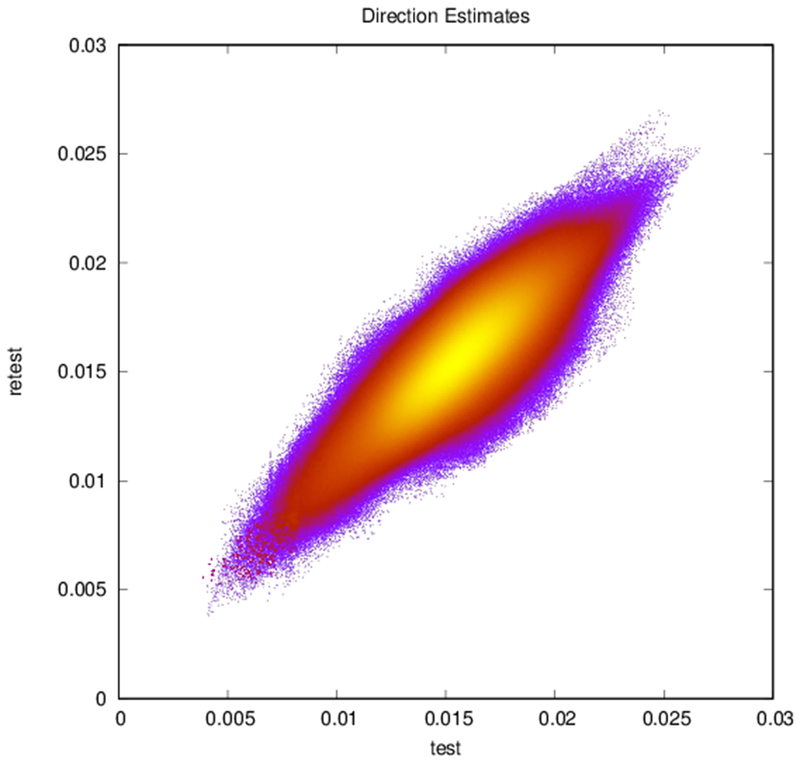
Maps of FA and principal diffusion directions for the test-retest subject in their separately reconstructed volumes (i.e., using different sets of three stacks), as well as the combined six-stack reconstruction demonstrate general qualitative agreement (Fig. 1). Despite minor variability, major white matter tracts are readily apparent, with the clearest reconstruction exhibiting the benefit of the cumulative signal over six stacks. Angular differences are strongest where fractional anisotropy is low and no single tract dominates to provide a clear principal direction of diffusion. Figure 1(c) shows an example of the resulting whole-brain tractography. Colors indicate the mean direction of the fiber to distinguish diverted fibers. Voxel-wise comparisons of the test-retest subject are plotted in Fig. 2.
Figure 2:
Plots of (a) FA (r = 0.83, N = 402,893), (b) ADC (r = 0.94, N = 402,893), and (c) reconstructed direction estimates (r = 0.84, N = 25,785,152) for test vs. retest in white matter. Point color indicates density.
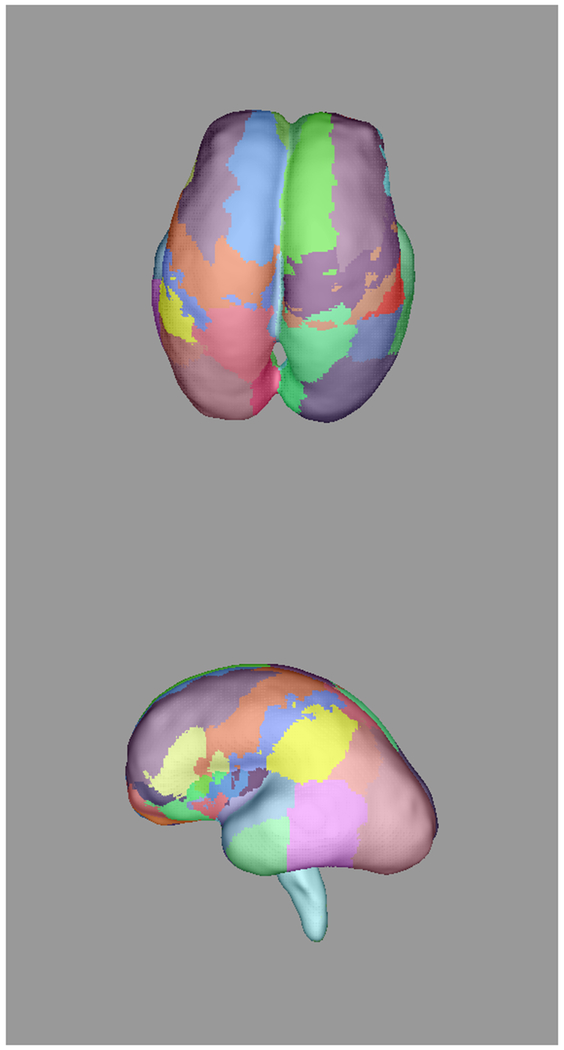
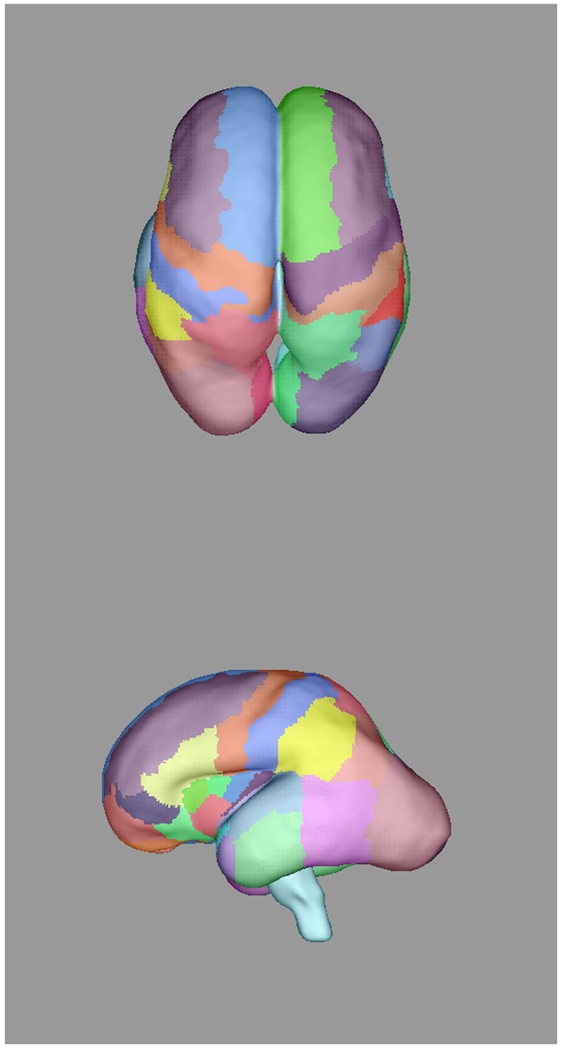
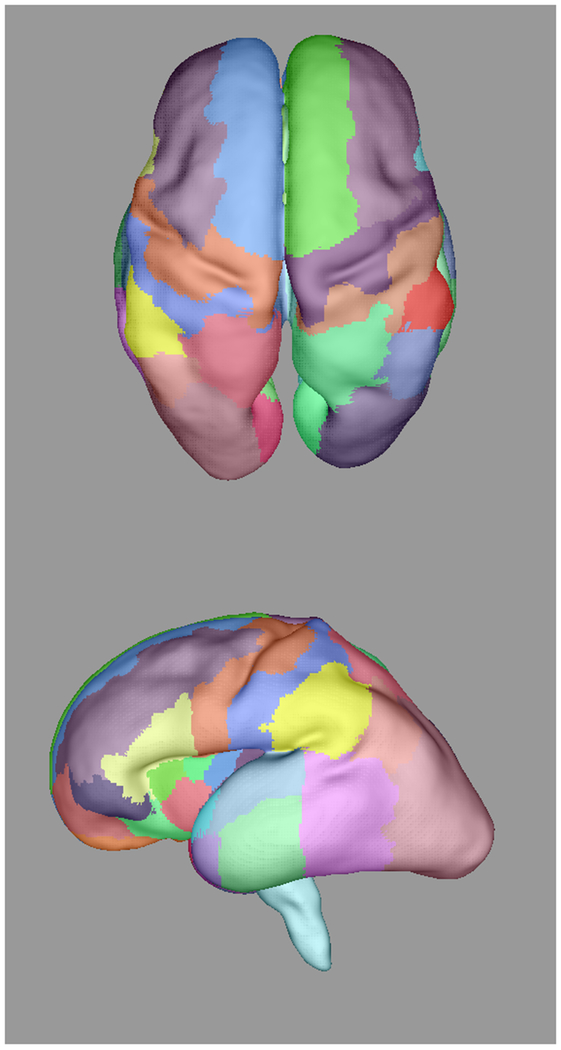
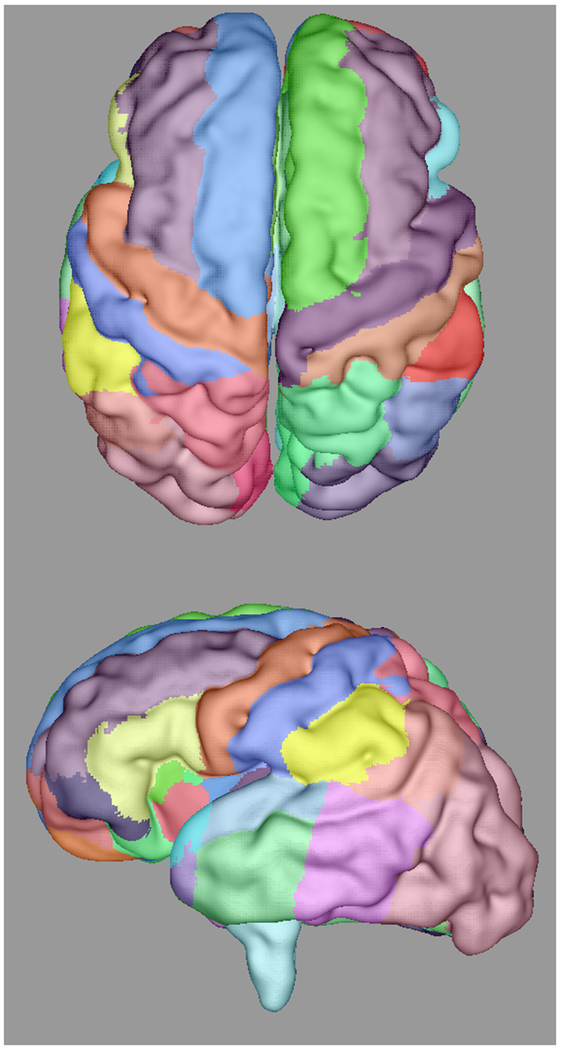
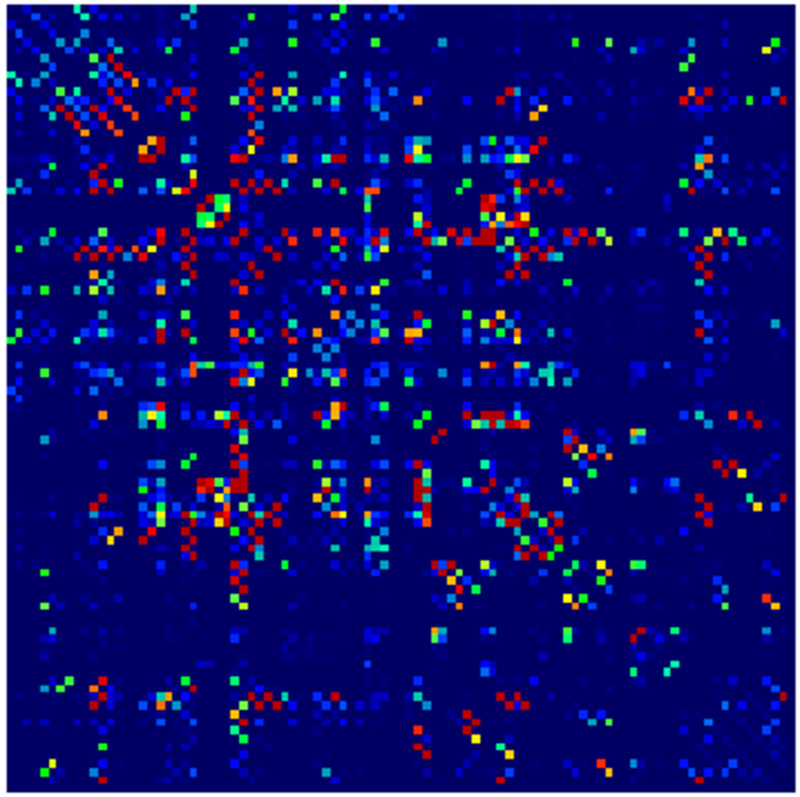
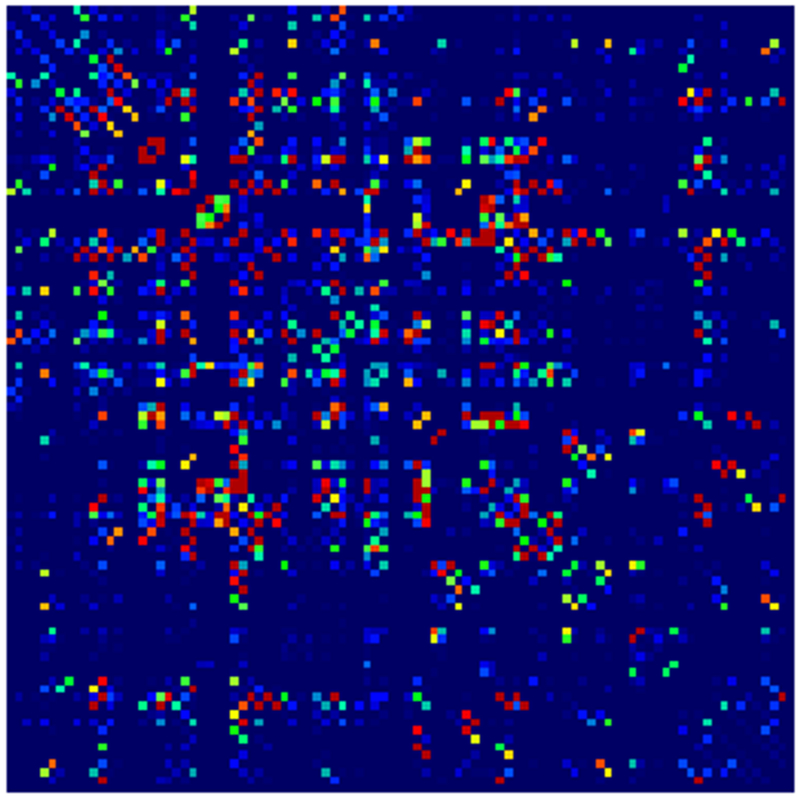
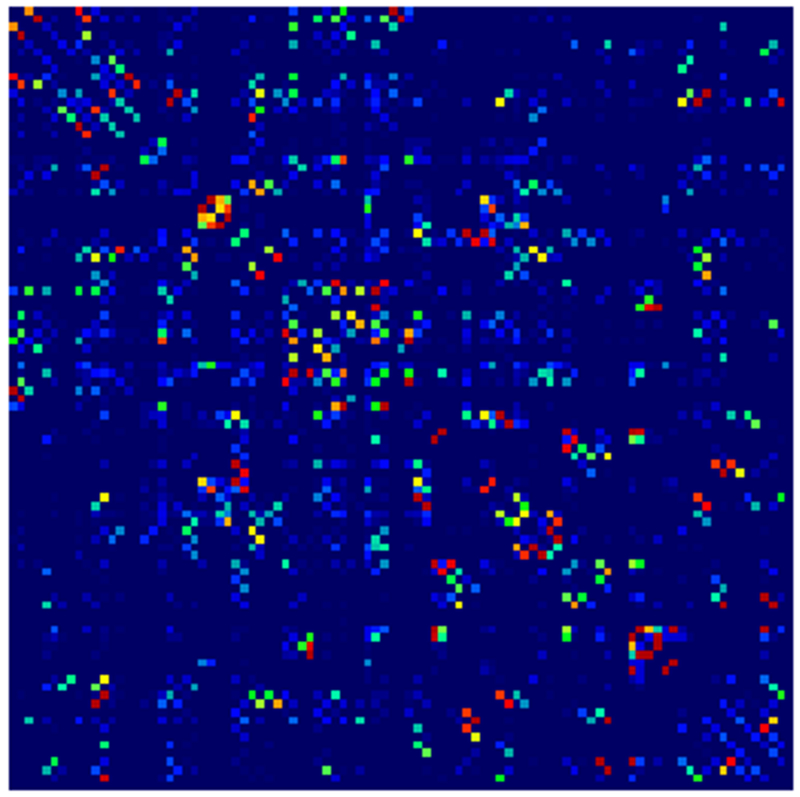
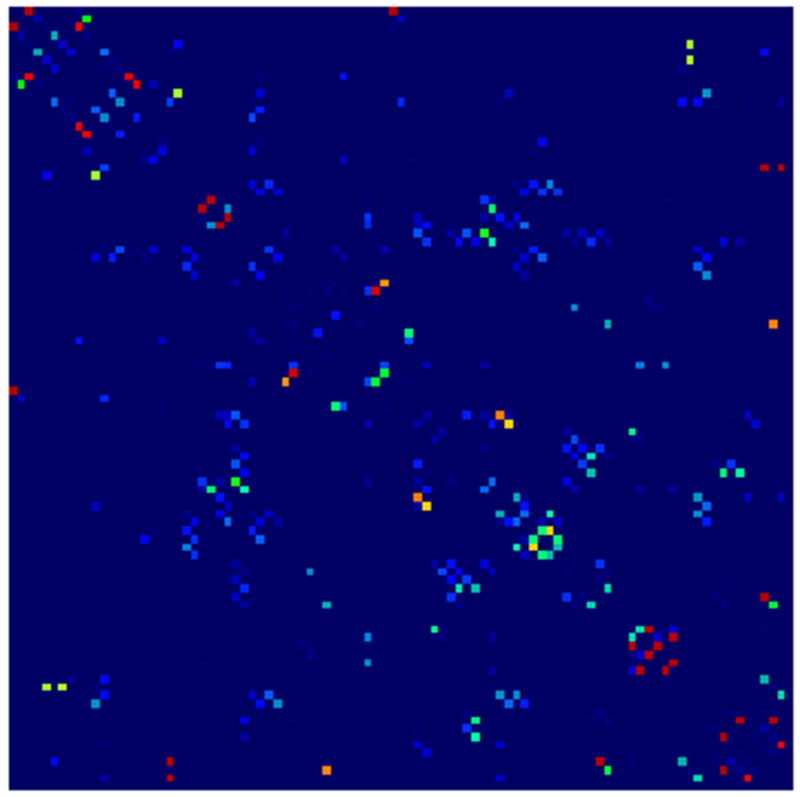
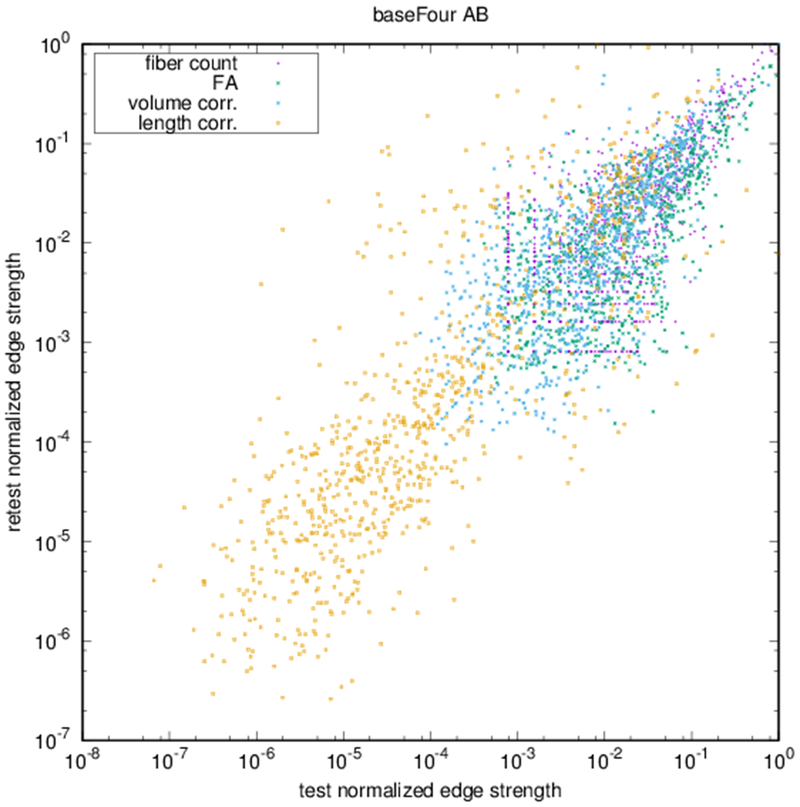
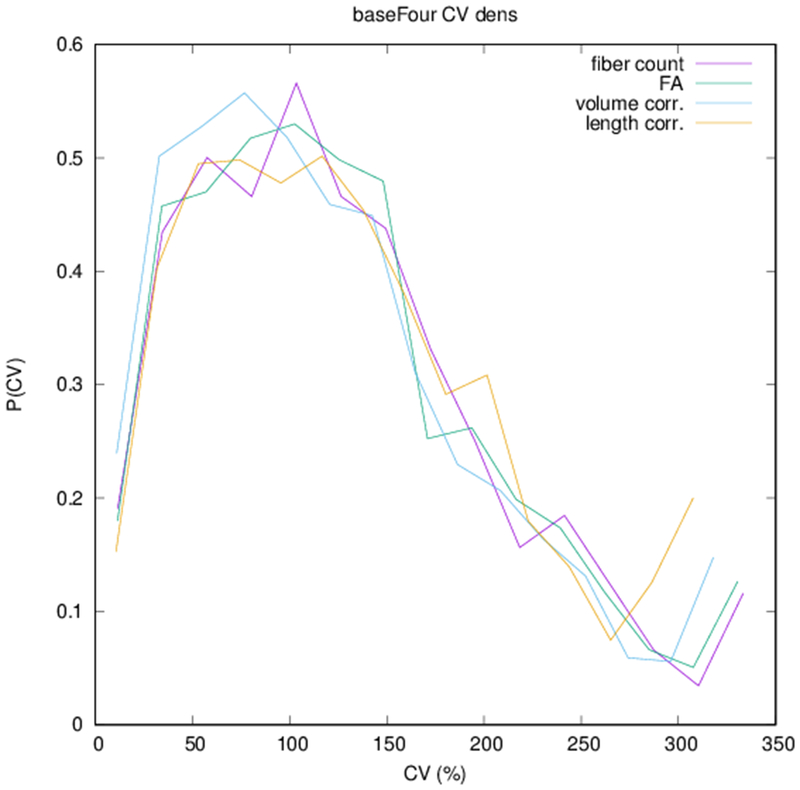
Example parcellations are shown in Fig. 3. Younger fetuses in Fig. 2(a)–(c) lack the cortical folding necessary to produce anatomically meaningful parcel from the corresponding adult atlas subjects. We construct adjacency matrices from tractography (see Fig. 4) according to the four schemes in Sec. 1.2. Since the majority of edges are much weaker than the strongest connected nodes for any graph type, the color scale show only 10% of the entire range. Figure 5 illustrates the basic variability in edge weights for the four basic graph types, showing the correspondence between individual connections for the rest-retest subject as well as the CV over the larger ensemble. Length correction shows the worst agreement because of the sensitivity to the shortest paths.
Figure 3:
Automatically propagated most-likely parcel labels from the adult atlas in [51] for (a) 22 weeks (b) 25 weeks, (c) 28 weeks, and (d) 34 weeks GA subjects, illustrating an increase in uncertainty as the age difference increases and the number of cortical features defining gyral structures decreases. Younger subjects exhibit insufficient cortical folding for developmentally-consistent parcellations without information from DWIs.
Figure 4:
Adjacency matrices for four graph constructions: (a) fiber count, (b) mean FA, (c) fiber count with volume correction, and (d) fiber count with length correction. Color represents normalized edge strength (all edges scaled by largest edge strength) from low strength (0.0) in blue to higher relative strength (0.1) in red.
Figure 5:
(a) Scatter plot of normalized edge strength for the four graph types for the test-retest subject: fiber count (r = 0.92), FA (r = 0.89), volume correction (r = 0.82), and length correction (r = 0.20). (b) Distribution of CV for edge strengths for each of the four graph types over the ensemble of subjects.
Table 1 summarizes these two quantities for the four graph types, as well as the average of the log of the quotient. The negative logarithm of the quotient indicates that the test-retest CV is typically less than that of the CV between different subjects in the larger ensemble.
Table 1:
Summary of means over individual connections with standard deviation for coefficients of variation and their ratio across subjects for (nonzero) graph connection strengths.
| fiber density | FA | volume corrected | length corrected | |
|---|---|---|---|---|
| CVT-RT | 0.65 ± 0.36 | 0.66 ± 0.35 | 0.65 ± 0.35 | 0.74 ± 0.31 |
| CVens | 1.45 ± 0.79 | 1.47 ± 0.78 | 0.53 ± 0.78 | 1.75 ± 0.79 |
| log(CVT-RT/CVens) | −0.42 ± 0.39 | −0.41 ± 0.37 | −0.44 ± 0.37 | −0.41 ± 0.35 |
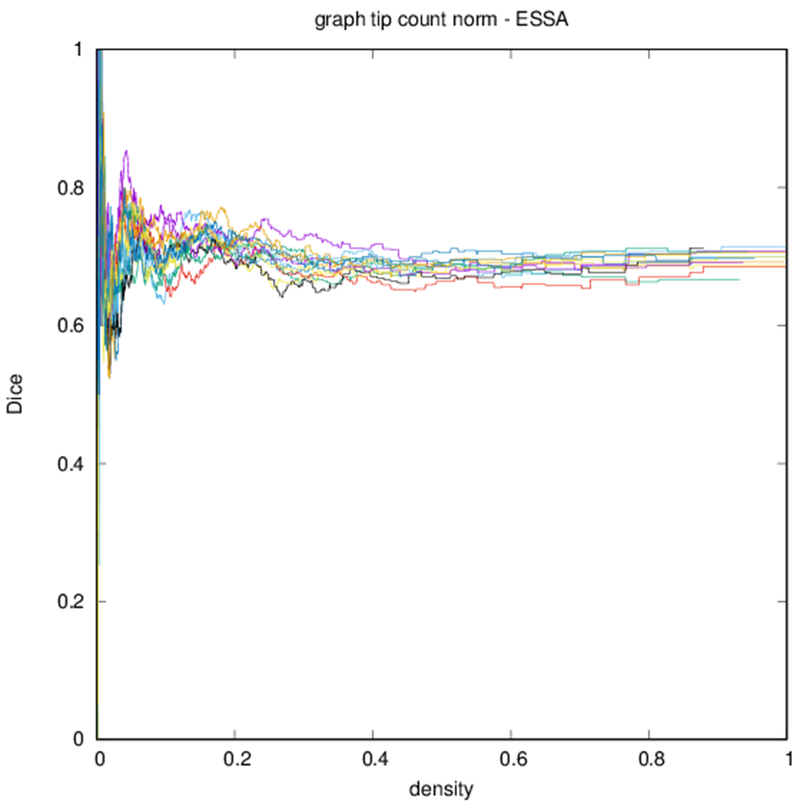
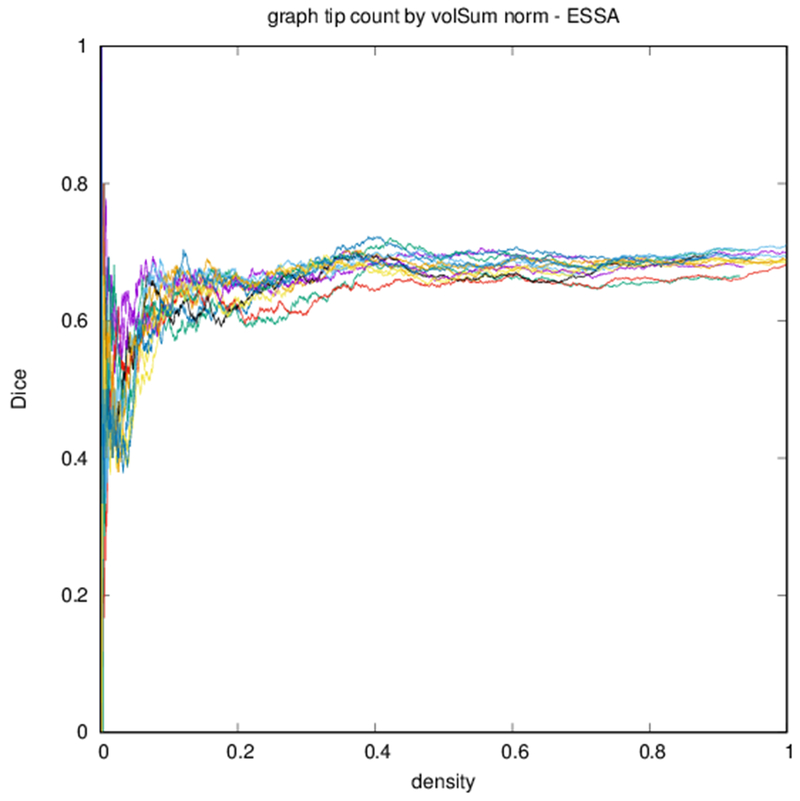
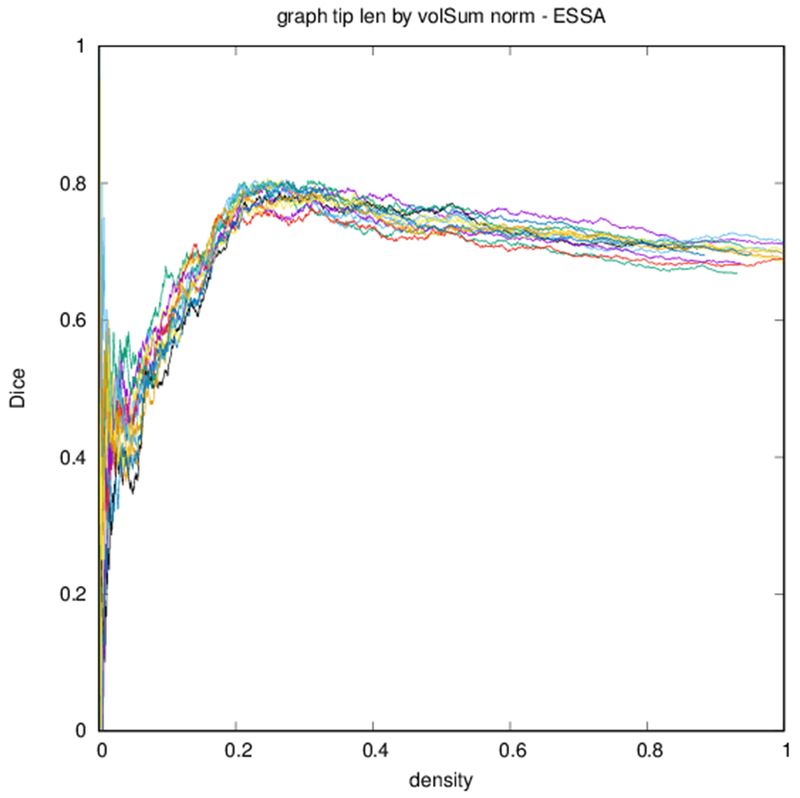
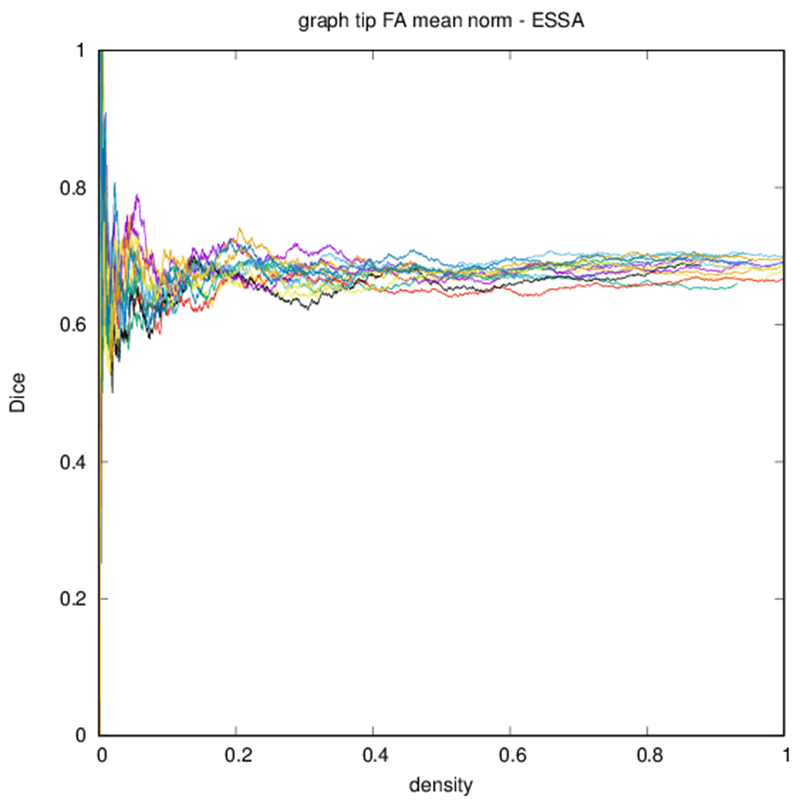
Figure 6 shows profiles of Dice coefficients against binarized graph density. These profiles are nonmonotonic but stabilize for higher densities. Because of the nature of the distribution of edge strengths, the density of the graph changes more quickly with threshold at lower thresholds.
Figure 6:
Dice coefficient between test subject and other subjects over graph density. Each differently colored profile corresponds to a different subject.
Edge-space similarities within a particular graph type are summarized in Table 2. While all variants of the metric give similar means for all graph types, the the measures reflect the typical Dice score from Fig. 6. Edge-space similarities between different graph types are summarized in Table 3. We observe that the fiber density and FA constructions [Eqs. (1) and (2)] are most similar, with the volume correction and length correction constructions [Eqs. (3) and (4)] also similar to each other, but less similar to other constructions.
Table 2:
Mean edge-space similarities across subjects compared to the test subject for each graph type.
| fiber density | FA | volume corrected | length corrected | |
|---|---|---|---|---|
| EGH | 0.48 ± 0.03 | 0.49 ± 0.03 | 0.50 ± 0.03 | 0.50 ± 0.02 |
| EwGH | 0.69 ± 0.01 | 0.68 ± 0.01 | 0.67 ± 0.01 | 0.72 ± 0.01 |
| EuGH | 0.69 ± 0.01 | 0.67 ± 0.01 | 0.66 ± 0.01 | 0.70 ± 0.01 |
Table 3:
Mean similarities over the ensemble of subjects between graph types for the unweghted edge-space similarity metric.
| FA | volume corrected | length corrected | |
|---|---|---|---|
| fiber density | 0.944 ± 0.002 | 0.77 ± 0.01 | 0.73 ± 0.01 |
| FA | 0.76 ± 0.01 | 0.70 ± 0.01 | |
| volume corrected | 0.81 ± 0.01 |
4. Discussion
While Dice coefficients in Fig. 6 and edge-space similarity measures in Tables 2 and 3 show that there is promising consensus of graph topology while still being able to adequately identify subject-specific variation, there are critical opportunities to improve the reproducibility of edge strength. Difficulty in consistent edge strengths as shown in Fig. 5(b) have been previously reported, even in adults [10], although the smaller variability within the test-retest subject compared to the whole ensemble demonstrates better reproducibility given the same subject, as would be expected. Since edge strength is the foundation of constructing any connectome, this variability should be considered in all studies that base structural connectomes on connectivity. Focusing on graph-theoretic measures like node strength, clustering, betweenness centrality, etc., as well as the stability of these measures, may obscure the underlying variability in individual connections.
In general, tractography streamlines are not arbitrarily accurate and must be treated on a length scale that is appropriate given the limitations to imaging, including accounting for the variability along a single streamline where some portions may be accurate while others are misleading. Especially in utero, whole fibers cannot be removed because a portion of the fiber is suspicious; one must identify (refine) and infer (by patching gaps) coherent bundles on a reasonable length scale determined by the resolution of the image.
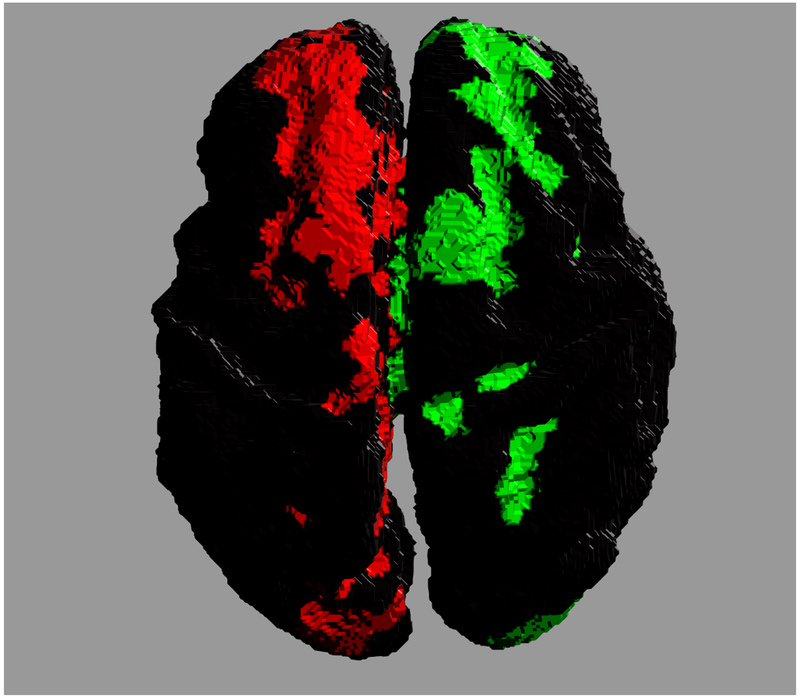
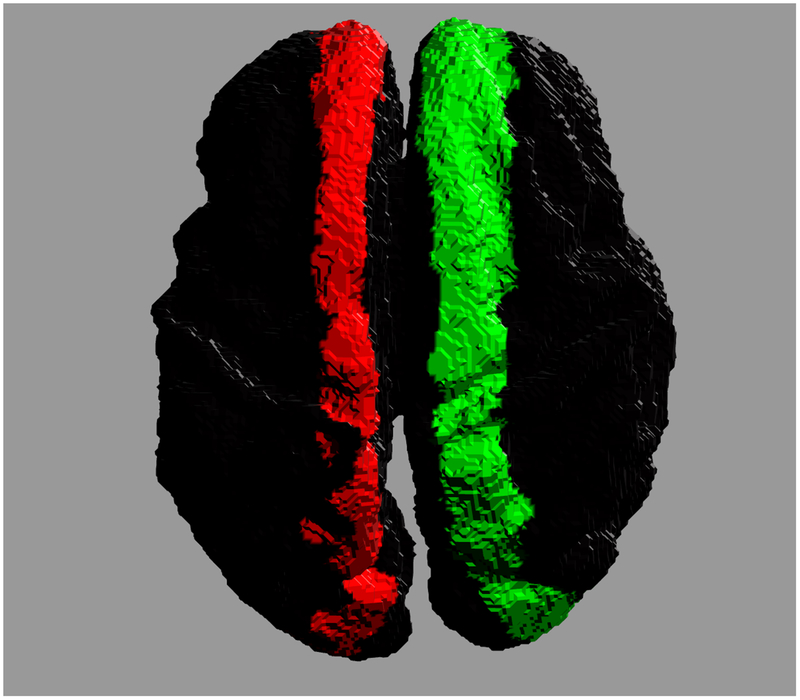
Accurate reconstruction of structural connectomes from in utero DWIs may require a fundamental shift in the generation of connectivity. For example, one could imagine a more sophisticated reconstruction of major white matter tracts for which stronger assumptions in shape can clarify connections that would not otherwise be recoverable. Figure 7 shows the potential improvement in connectivity by enforcing a more regular tract shape for the corpus callosum. The cortical footprints of each end of the connecting white matter bundle are shown in two distinct colors. The regional connectivity in Fig. 7(a) departs considerably from the typical U-shaped fibers in the callosal core (ignoring more lateral transcallosal projections [55] that are difficult to observe with singe-tensor DTI), which are recoverable using a regression model over the geometry of the ensemble of callosal fibers. Many individual fibers fail to traverse the white matter to the more superior cortical regions, and instead contribute to misleading connectivity endpoints distributed more medially in the brain. However, the isolation and reconstruction of individual white matter tracts is a complex problem in general — as shown by previous studies post mortem [56–59] and in utero [60–62] — and its application to comprehensive in utero connectomes would require further study.
Figure 7:
Cross hemispheric connectivity associated with the corpus callosum reconstructed from in utero DWIs. Colors indicate the two ends of the connected regions. (a) Connectivity constructed from individual streamlines. (b) Connectivity inferred from a regressed model of the ensemble of callosal fibers.
There are many opportunities to study the fetal connectome and its dynamic development from both the nature of this critical developmental stage, as well as the specific challenges for imaging and measurement in utero. To take advantage of these opportunities in building a fetal connectome, one must address the challenges in identifying accurate connectivity from images collected in a difficult environment. Such sensitivity and apparent ambiguity at the fundamental level of graph nodes and edges requires great care from initial connectome construction, through the theoretical graph analysis, to the conclusions that one can draw from the observed characteristics. While understanding the variability of DWI data and connectomes is requisite to demonstrate the reproducibility of measurements, it is important to keep in mind that good reproducibility does not necessary guarantee the accuracy or appropriateness of a particular analysis, especially in the case of tractography-based connectomes where there can be significant biases for diverted streamlines. However, from the present study we see that there are many promising opportunities to recover meaningful connectome data to study the characteristics and development of the human brain in utero.
Acknowledgements
This work was supported by NIH grants R01 NS055064 and R01 EB017133, and additionally was supported by Philips Medical Systems in providing access to clinical diffusion imaging sequences that were used in the study. Declarations of conflicts of interest: none.
Funding: This work was supported by NIH grants R01 NS055064 and R01 EB017133, and additionally was supported by Philips Medical Systems in providing access to clinical diffusion imaging sequences that were used in the study.
Contributor Information
Dr. David Hunt, University of Washington, Department of Pediatrics
Dr. Manjiri Dighe, University of Washington, Department of Radiology
Dr. Christopher Gatenby, University of Washington, Department of Radiology
Dr. Colin Studholme, University of Washington, Departments of Bioengineering, Pediatrics, and Radiology
References
- [1].Jakab A, Kasprian G, Schwartz E, Gruber GM, Mitter C, Prayer D, Schöpf V, and Langs G Disrupted developmental organization of the structural connectome in fetuses with corpus callosum agenesis. Neuroimage, 111:277–288, 2015. [DOI] [PubMed] [Google Scholar]
- [2].Marami B, Salehi SSM, Afacan O, Scherrer B, Rollins CK, Yang E, Estroff JA, Warfield SK, and Gholipour A. Temporal slice registration and robust diffusion-tensor reconstruction for improved fetal brain structural connectivity analysis. NeuroImage, 156:475–488, 2017. [DOI] [PMC free article] [PubMed] [Google Scholar]
- [3].Song L, Mishra V, Ouyang M, Peng Q, Slinger M, Liu S, and Huang H. Human fetal brain connectome: structural network development from middle fetal stage to birth. Frontiers in Neuroscience, 11:561, 2017. [DOI] [PMC free article] [PubMed] [Google Scholar]
- [4].Dubois J, Dehaene-Lambertz G, Kulikova S, Poupon C, Hüppi PS, and Hertz-Pannier L. The early development of brain white matter: a review of imaging studies in fetuses, newborns and infants. Neuroscience, 276:48–71, 2014. [DOI] [PubMed] [Google Scholar]
- [5].Pfefferbaum A, Adalsteinsson E, and Sullivan EV. Replicability of diffusion tensor imaging measurements of fractional anisotropy and trace in brain. Journal of Magnetic Resonance Imaging: An Official Journal of the International Society for Magnetic Resonance in Medicine, 18(4):427–433, 2003. [DOI] [PubMed] [Google Scholar]
- [6].Buchanan CR, Pernet CR, Gorgolewski KJ, Storkey AJ, and Bastin ME. Test–retest reliability of structural brain networks from diffusion mri. Neuroimage, 86:231–243, 2014. [DOI] [PubMed] [Google Scholar]
- [7].Roine T, Jeurissen B, Perrone D, Aelterman J, Philips W, Sijbers J, and Leemans A. Reproducibility and intercorrelation of graph theoretical measures in structural brain connectivity networks. Medical Image Analysis, 52:56–67, 2019. [DOI] [PubMed] [Google Scholar]
- [8].Boyer AC, Gonçalves LF, Lee W, Shetty A, Holman A, Yeo L, and Romero R. Magnetic resonance diffusion-weighted imaging: reproducibility of regional apparent diffusion coefficients for the normal fetal brain. Ultrasound in Obstetrics & Gynecology, 41(2):190–197, 2013. [DOI] [PMC free article] [PubMed] [Google Scholar]
- [9].Jakab A, Tuura R, Kellenberger C, and Scheer I. In utero diffusion tensor imaging of the fetal brain: A reproducibility study. NeuroImage: Clinical, 15:601–612, 2017. [DOI] [PMC free article] [PubMed] [Google Scholar]
- [10].Vaessen MJ, Hofman PAM, Tijssen HN, Aldenkamp AP, Jansen JFA, and Backes WH. The effect and reproducibility of different clinical dti gradient sets on small world brain connectivity measures. Neuroimage, 51(3):1106–1116, 2010. [DOI] [PubMed] [Google Scholar]
- [11].Bassett DS, Brown JA, Deshpande V, Carlson JM, and Grafton ST. Conserved and variable architecture of human white matter connectivity. Neuroimage, 54(2):1262–1279, 2011. [DOI] [PubMed] [Google Scholar]
- [12].Jiang S, Xue H, Counsell S, Anjari M, Allsop J, Rutherford M, Rueckert D, and Hajnal JV. Diffusion tensor imaging (DTI) of the brain in moving subjects: Application to in-utero fetal and ex-utero studies. Magnetic Resonance in Medicine, 62(3):645–655, 2009. [DOI] [PubMed] [Google Scholar]
- [13].Oubel E, Koob M, Studholme C, Dietemann J-L, and Rousseau F. Reconstruction of scattered data in fetal diffusion MRI. Medical Image Analysis, 16(1):28–37, 2012. [DOI] [PMC free article] [PubMed] [Google Scholar]
- [14].Scherrer B, Gholipour A, and Warfield SK. Super-resolution reconstruction to increase the spatial resolution of diffusion weighted images from orthogonal anisotropic acquisitions. Medical Image Analysis, 16(7):1465–1476, 2012. Special Issue on the 2011 Conf. Medical Image Computing and Computer Assisted Intervention (MICCAI). [DOI] [PMC free article] [PubMed] [Google Scholar]
- [15].Fogtmann M, Seshamani S, Kroenke C, Cheng X, Chapman T, Wilm J, Rousseau F, and Studholme C. A unified approach to diffusion direction sensitive slice registration and 3-D DTI reconstruction from moving fetal brain anatomy. IEEE Trans. Med. Imag, 33(2):272–289, 2014. [DOI] [PMC free article] [PubMed] [Google Scholar]
- [16].Studholme C and Rousseau F. Quantifying and modelling tissue maturation in the living human fetal brain. Int. J. Developmental Neuroscience, 32:3–10, 2014. [DOI] [PMC free article] [PubMed] [Google Scholar]
- [17].Wang X, Pettersson DR, Studholme C, and Kroenke CD. Characterization of laminar zones in the mid-gestation primate brain with magnetic resonance imaging and histological methods. Frontiers in Neuroanatomy, 9:147, 2015. [DOI] [PMC free article] [PubMed] [Google Scholar]
- [18].Qi S, Meesters S, Nicolay K, ter Haar Romeny BM, and Ossenblok P. The influence of construction methodology on structural brain network measures: A review. J. Neuroscience Methods, 253:170–182, 2015. [DOI] [PubMed] [Google Scholar]
- [19].Lerch JP, Worsley K, Shaw WP, Greenstein DK, Lenroot RK, Giedd J, and Evans AC. Mapping anatomical correlations across cerebral cortex (macacc) using cortical thickness from mri. Neuroimage, 31(3):993–1003, 2006. [DOI] [PubMed] [Google Scholar]
- [20].Jones DK, Knösche TR, and Turner R. White matter integrity, fiber count, and other fallacies: the do’s and don’ts of diffusion MRI. NeuroImage, 73:239–254, 2013. [DOI] [PubMed] [Google Scholar]
- [21].O’Donnell L, Haker S, and Westin C-F. New approaches to estimation of white matter connectivity in diffusion tensor mri: Elliptic pdes and geodesics in a tensor-warped space. In Int. Conf. Medical Image Computing and Computer-Assisted Intervention (MICCAI), pages 459–466. Springer, 2002. [Google Scholar]
- [22].Kreher BW, Mader I, and Kiselev VG. Gibbs tracking: a novel approach for the reconstruction of neuronal pathways. Magnetic Resonance in Medicine, 60(4):953–963, 2008. [DOI] [PubMed] [Google Scholar]
- [23].Reisert M, Mader I, Anastasopoulos C, Weigel M, Schnell S, and Kiselev V. Global fiber reconstruction becomes practical. NeuroImage, 54(2):955–962, 2011. [DOI] [PubMed] [Google Scholar]
- [24].Cieslak M, Brennan T, Meiring W, Volz LJ, Greene C, Asturias A, Suri S, and Grafton ST. Analytic tractography: A closed-form solution for estimating local white matter connectivity with diffusion MRI. NeuroImage, 169:473–484, 2018. [DOI] [PubMed] [Google Scholar]
- [25].Maier-Hein K, Neher P, Houde J-C, Cote M-A, Garyfallidis E, Zhong J, Chamberland M, Yeh FC, Chia Lin Y, Ji Q, et al. Tractography-based connectomes are dominated by false-positive connections. biorxiv, page 084137, 2016. [Google Scholar]
- [26].Hunt D, Dighe M, Gatenby C, and Studholme C. Comparing diffusion tensor and spherical harmonic tractography for in utero studies of fetal brain connectivity. In Medical Imaging 2018: Biomedical Applications in Molecular, Structural, and Functional Imaging, volume 10578, page 1057809 International Society for Optics and Photonics, 2018. [Google Scholar]
- [27].Smith SM, Jenkinson M, Johansen-Berg H, Rueckert D, Nichols TE, Mackay CE, Watkins KE, Ciccarelli O, Cader MZ, Matthews PM, et al. Tract-based spatial statistics: voxelwise analysis of multi-subject diffusion data. NeuroImage, 31(4):1487–1505, 2006. [DOI] [PubMed] [Google Scholar]
- [28].Wassermann D, Bloy L, Kanterakis E, Verma R, and Deriche R. Unsupervised white matter fiber clustering and tract probability map generation: Applications of a gaussian process framework for white matter fibers. NeuroImage, 51(1):228–241, 2010. [DOI] [PMC free article] [PubMed] [Google Scholar]
- [29].Yendiki A, Panneck P, Srinivasan P, Stevens A, Zöllei L, Augustinack J, Wang R, Salat D, Ehrlich S, Behrens T, et al. Automated probabilistic reconstruction of white-matter pathways in health and disease using an atlas of the underlying anatomy. Frontiers in Neuroinformatics, 5:23, 2011. [DOI] [PMC free article] [PubMed] [Google Scholar]
- [30].Yeatman JD, Dougherty RF, Myall NJ, Wandell BA, and Feldman HM. Tract profiles of white matter properties: automating fiber-tract quantification. PLoS ONE, 7(11):e49790, 2012. [DOI] [PMC free article] [PubMed] [Google Scholar]
- [31].Jin Y, Shi Y, Zhan L, Gutman BA, de Zubicaray GI, McMahon KL, Wright MJ, Toga AW, and Thompson PM. Automatic clustering of white matter fibers in brain diffusion MRI with an application to genetics. NeuroImage, 100:75–90, 2014. [DOI] [PMC free article] [PubMed] [Google Scholar]
- [32].Tun¸c B, Parker WA, Ingalhalikar M, and Verma R. Automated tract extraction via atlas based adaptive clustering. NeuroImage, 102:596–607, 2014. [DOI] [PMC free article] [PubMed] [Google Scholar]
- [33].Wasserthal J, Neher P, and Maier-Hein KH. Tractseg-fast and accurate white matter tract segmentation. NeuroImage, 183:239–253, 2018. [DOI] [PubMed] [Google Scholar]
- [34].Mori S, Crain BJ, Chacko VP, and Van Zijl P. Three-dimensional tracking of axonal projections in the brain by magnetic resonance imaging. Annals of Neurology: Official J. Amer. Neurological Assoc. and the Child Neurology Soc., 45(2):265–269, 1999. [DOI] [PubMed] [Google Scholar]
- [35].Tournier J-D, Calamante F, and Connelly A. Robust determination of the fibre orientation distribution in diffusion MRI: Non-negativity constrained super-resolved spherical deconvolution. NeuroImage, 35(4):1459–1472, 2007. [DOI] [PubMed] [Google Scholar]
- [36].Behrens T, Woolrich MW, Jenkinson M, Johansen-Berg H, Nunes RG, Clare S, Matthews PM, Brady JM, and Smith SM. Characterization and propagation of uncertainty in diffusion-weighted MR imaging. Magnetic Resonance in Medicine, 50(5):1077–1088, 2003. [DOI] [PubMed] [Google Scholar]
- [37].Descoteaux M, Deriche R, Knosche TR, and Anwander A. Deterministic and probabilistic tractography based on complex fibre orientation distributions. IEEE Trans. Med. Imag, 28(2):269–286, 2009. [DOI] [PubMed] [Google Scholar]
- [38].Bastiani M, Shah NJ, Goebel R, and Roebroeck A. Human cortical connectome reconstruction from diffusion weighted mri: the effect of tractography algorithm. NeuroImage, 62(3):1732–1749, 2012. [DOI] [PubMed] [Google Scholar]
- [39].Zalesky A, Fornito A, Harding IH, Cocchi L, Yücel M, Pantelis C, and Bullmore ET. Whole-brain anatomical networks: Does the choice of nodes matter? NeuroImage, 50(3):970–983, 2010. [DOI] [PubMed] [Google Scholar]
- [40].Chang Y-T, Pantazis D, and Leahy RM. To cut or not to cut? Assessing the modular structure of brain networks. NeuroImage, 91:99–108, 2014. [DOI] [PMC free article] [PubMed] [Google Scholar]
- [41].Baldassano C, Beck DM, and Fei-Fei L. Parcellating connectivity in spatial maps. PeerJ, 3:e784, 2015. [DOI] [PMC free article] [PubMed] [Google Scholar]
- [42].O’Muircheartaigh J and Jbabdi S. Concurrent white matter bundles and grey matter networks using independent component analysis. NeuroImage, 170:296–306, 2017. [DOI] [PMC free article] [PubMed] [Google Scholar]
- [43].O’Donnell LJ, Kubicki M, Shenton ME, Dreusicke MH, Grimson W, and Westin C-F. A method for clustering white matter fiber tracts. Amer. J. Neuroradiology, 27(5):1032–1036, 2006. [PMC free article] [PubMed] [Google Scholar]
- [44].Zhang S, Correia S, and Laidlaw DH. Identifying white-matter fiber bundles in DTI data using an automated proximity-based fiber-clustering method. IEEE Trans. Vis. Comput. Graph, 14(5):1044–1053, 2008. [DOI] [PMC free article] [PubMed] [Google Scholar]
- [45].Cauteruccio F, Stamile C, Terracina G, Ursino D, and Sappey-Mariniery D. An automated stringbased approach to white matter fiber-bundles clustering. In 2015 International Joint Conf. Neural Networks (IJCNN), pages 1–8. IEEE, 2015. [Google Scholar]
- [46].Tymofiyeva O, Ziv E, Barkovich AJ, Hess CP, and Xu D. Brain without anatomy: construction and comparison of fully network-driven structural MRI connectomes. PloS one, 9(5):e96196, 2014. [DOI] [PMC free article] [PubMed] [Google Scholar]
- [47].van den Heuvel MP and Sporns O. Rich-club organization of the human connectome. Journal of Neuroscience, 31(44):15775–15786, 2011. [DOI] [PMC free article] [PubMed] [Google Scholar]
- [48].Hagmann Patric, Kurant Maciej, Gigandet Xavier, Thiran Patrick, Wedeen Van J., Meuli Reto, and Thiran Jean-Philippe. Mapping human whole-brain structural networks with diffusion mri. PLOS ONE, 2(7):1–9, July 2007. [DOI] [PMC free article] [PubMed] [Google Scholar]
- [49].Studholme C, Constable RT, and Duncan JS. Accurate alignment of functional EPI data to anatomical MRI using a physics-based distortion model. IEEE Trans. Med. Imag, 19(11):1115–1127, 2000. [DOI] [PubMed] [Google Scholar]
- [50].Rousseau F, Habas PA, and Studholme C. A supervised patch-based approach for human brain labeling. IEEE Trans. Med. Imag, 30(10):1852–1862, 2011. [DOI] [PMC free article] [PubMed] [Google Scholar]
- [51].Wild HM, Heckemann RA, Studholme C, and Hammers A. Gyri of the human parietal lobe: Volumes, spatial extents, automatic labelling, and probabilistic atlases. PloS one, 12(8):e0180866, 2017. [DOI] [PMC free article] [PubMed] [Google Scholar]
- [52].Wright Robert, Makropoulos Antonios, Kyriakopoulou Vanessa, Patkee Prachi A, Koch Lisa M, Rutherford Mary A, Hajnal Joseph V, Rueckert Daniel, and Aljabar Paul. Construction of a fetal spatiotemporal cortical surface atlas from in utero mri: Application of spectral surface matching. NeuroImage, 120:467–480, 2015. [DOI] [PubMed] [Google Scholar]
- [53].Hyuk Jin Yun Ai Wern Chung, Vasung Lana, Yang Edward, Tarui Tomo, Rollins Caitlin K, Ortinau Cynthia M, Grant P Ellen, and Im Kiho. Automatic labeling of cortical sulci for the human fetal brain based on spatio-temporal information of gyrification. NeuroImage, 188:473–482, 2019. [DOI] [PMC free article] [PubMed] [Google Scholar]
- [54].Dice LR. Measures of the amount of ecologic association between species. Ecology, 26(3):297–302, 1945. [Google Scholar]
- [55].Ruddy KL, Leemans A, and Carson RG. Transcallosal connectivity of the human cortical motor network. Brain Structure and Function, 222(3):1243–1252, 2017. [DOI] [PMC free article] [PubMed] [Google Scholar]
- [56].Huang H, Xue R, Zhang J, Ren T, Richards LJ, Yarowsky P, Miller MI, and Mori S. Anatomical characterization of human fetal brain development with diffusion tensor magnetic resonance imaging. J. Neuroscience, 29(13):4263–4273, 2009. [DOI] [PMC free article] [PubMed] [Google Scholar]
- [57].Takahashi E, Folkerth RD, Galaburda AM, and Grant PE. Emerging cerebral connectivity in the human fetal brain: an MR tractography study. Cerebral Cortex, 22(2):455–464, 2012. [DOI] [PMC free article] [PubMed] [Google Scholar]
- [58].Ouyang A, Jeon T, Sunkin SM, Pletikos M, Sedmak G, Sestan N, Lein ES, and Huang H. Spatial mapping of structural and connectional imaging data for the developing human brain with diffusion tensor imaging. Methods, 73:27–37, 2015. [DOI] [PMC free article] [PubMed] [Google Scholar]
- [59].Vasung L, Raguz M, Kostovic I, and Takahashi E. Spatiotemporal relationship of brain pathways during human fetal development using high-angular resolution diffusion MR imaging and histology. Frontiers in Neuroscience, 11:348, 2017. [DOI] [PMC free article] [PubMed] [Google Scholar]
- [60].Kasprian G, Brugger PC, Weber M, Krssák M, Krampl E, Herold C, and Prayer D. In utero tractography of fetal white matter development. NeuroImage, 43(2):213–224, 2008. [DOI] [PubMed] [Google Scholar]
- [61].Zanin E, Ranjeva J-P, Confort-Gouny S, Guye M, Denis D, Cozzone PJ, and Girard N. White matter maturation of normal human fetal brain. An in vivo diffusion tensor tractography study. Brain and Behavior, 1(2):95–108, 2011. [DOI] [PMC free article] [PubMed] [Google Scholar]
- [62].Mitter C, Prayer D, Brugger PC, Weber M, and Kasprian G. In vivo tractography of fetal association fibers. PLOS ONE, 10(3):1–18, 2015. [DOI] [PMC free article] [PubMed] [Google Scholar]


