Abstract
Diabetic retinopathy is the most common microvascular complication of diabetes and is a major cause of blindness, but an understanding of the pathogenesis of the disease has been hampered by a lack of accurate animal models. Here we explore the dynamics of retinal cellular changes in the Nile rat (Arvicanthis Niloticus), a carbohydrate-sensitive model for type 2 diabetes. The early retinal changes in diabetic Nile rats included increased acellular capillaries and loss of pericytes that correlated linearly with the duration of diabetes. These vascular changes occurred in the presence of microglial infiltration but in the absence of retinal ganglion cell loss. After a prolonged duration of diabetes, the Nile rat also exhibits a spectrum of retinal lesions commonly seen in the human condition including vascular leakage, capillary non-perfusion, and neovascularization. Our longitudinal study documents a range and progression of retinal lesions in the diabetic Nile rat remarkably similar to those observed in human diabetic retinopathy, and suggests that this model will be valuable in identifying new therapeutic strategies.
Diabetic retinopathy is the leading cause of blindness in adults in the U.S. [1]. Diabetes affects an estimated 422 million people worldwide, and has been increasing dramatically in recent decades [2]. The percentage of adults living with diabetes has more than doubled since 1980, and the vast majority of them suffer from type 2 diabetes, which is linked to changing patterns of nutrition. Duration of diabetes and glycated hemoglobin (HbA1c) levels are the most consistently reported risk factors for the development of diabetic retinopathy [3-8], which affects about one-third of diabetic patients [9]. Although nutritional management and changes in lifestyle can slow the progression of type 2 diabetes, current therapies are not effective in addressing diabetic retinopathy. Thus there is a compelling need for new therapies, and this will require a better understanding of the pathogenesis of the disease.
The literature on diabetic retinopathy in humans and animal models mainly suggests that pericyte loss is the initiating event [10-12]. However, alternative initiating events have been considered for decades. For example, inflammation has been proposed as the initiating event [13], and as early as 1961, Wolter suggested that loss of neurons may be the primary event that subsequently gives rise to vascular changes [14]. Over fifty years later, controversy surrounding the early changes of diabetic retinopathy persists. A major obstacle to addressing this issue is the lack of adequate human material and the inability to reproduce human features of diabetic retinopathy accurately in an animal model.
Vision loss in diabetic patients primarily results from macular edema, proliferative diabetic retinopathy, and retinal ischemia. Diabetic macular edema is caused by a disruption of the blood retinal barrier and can occur at any point in the progression of the disease when sufficient retinal leakage leads to swelling of the retinal tissue [15]. Proliferative diabetic retinopathy occurs at an advanced stage when neovascularization and fibrosis develop on the retinal surface. The abnormal new vessels are prone to hemorrhage which can contribute to vision loss [16]. In many cases, fibrosis of the new vessels can cause tractional retinal detachment. Diabetic retinal ischemia is characterized by localized regions void of vascular and photoreceptors cells, and can be seen both in patients with proliferative diabetic retinopathy and with diabetic macular edema [17].
Although previously described rodent models replicate some aspects of human diabetic retinopathy, none faithfully reflects the range and progression of lesions present in the human disease [18-20]. Type 2 diabetes is a complex disease with a poorly understood etiology, but it is associated with excess dietary carbohydrates [21, 22]. The Nile rat spontaneously develops type 2 diabetes when fed a diet that has a higher carbohydrate content than its natural diet [23-26]. Others have reported retinal vascular abnormalities [27] and delayed photopic ERG oscillatory potentials [28] in older diabetic Nile rats, but these studies failed to examine the very earliest stages of diabetic retinopathy. Here we report a detailed chronology of early cellular changes in the retina of diabetic Nile rats and find that the range of advanced lesions observed closely mimics the human disease.
Materials and Methods
Animals
All animal experiments were approved by the University of California, Santa Barbara, Institutional Animal Care and Use Committee, and conducted in accord with the NIH Guide for the Care and Use of Laboratory Animals. The Nile rats were either on a high fiber rabbit diet (Lab Diet 53261; Newco Speciality, Rancho Cucamonga, CA, USA) to prevent diabetes, or on a standard rodent diet (Diet 50082; Newco Speciality, Rancho Cucamonga, CA, USA) to induce diabetes [29]. Routine monitoring included measurement of weight and random blood glucose (RBG) every four weeks, commencing at weaning. Based on previous studies [30], we considered animals with RBG < 75 mg/dL not to be diabetic, 75 ≤ RBG < 100 mg/dL to be pre-diabetic, and RBG ≥ 100 mg/dL to be diabetic. Our founder Nile rats came from the Brandeis University colony of the Hayes K.C. laboratory.
Retinal tissue preparation
For post-mortem analysis of retinas, Nile rats were perfusion-fixed with 4% paraformaldehyde (PFA) after being deeply anesthetized with sodium pentobarbital (120 mg/kg, i.p.; Euthasol; Virbac, Fort Worth, Texas, USA). Blood was drawn from the heart for hemoglobin analysis shortly before each perfusion. Each Nile rat was perfused with 5 mL of 0.9% saline via syringe, followed by 30 mL of 4% PFA in 0.1 M sodium phosphate buffer (pH 7.2) for 10 minutes. The eyes were enucleated and immersion-fixed in 4% PFA for 10 minutes, and transferred to phosphate-buffered saline (PBS) containing 0.1% sodium azide for storage.
HbA1c analysis
The cardiac blood was collected in an EDTA-coated microvette (Sarstedt AG and Co. Numbrecht, Germany) and frozen at −20˚C. We analyzed the thawed blood for glycated hemoglobin A1c content using the mouse hemoglobin A1c kit (Crystal Chem, Downers Grove, IL).
Measurement for retinal thickness
To measure the retinal thickness, dissected whole retinas were laid flat on a cellulose membrane, embedded in 5% agarose, and sectioned perpendicularly at 200 μm intervals on a PELCO easiSlicer™. Only sections that included the nerve head and extended to each peripheral edge were used for the thickness analysis. Hoechst 33342 (H3750, Life Technologies) was used for nuclear staining. The retinal thickness was sampled at 100 μm, 200 μm, 300 μm, 400 μm, and 500 μm from the optic nerve head and an average central retinal thickness was determined.
Immunohistochemistry
Retinas were dissected, and wholemounts were prepared by making four relieving cuts, one in each quadrant, to permit the retina to lay flat. Retinal wholemounts or transverse sections were then stained with isolectin GS-IB4 conjugated to Alexa-647 (I32450, ThermoFisher Scientific), diluted 1:100 to label blood vessels and microglial cells and immunostained using a combination of antibodies to the following antigens:; Brn3b (sc6026 Santa Cruz), diluted 1:250 to label retinal ganglion cells; Desmin (sc7559, Santa Cruz), diluted 1:500, and NG2 (gift from W. Stallcup lab in Sanford Burnham Prebys) [31], diluted 1:1000 to label pericytes; Iba1 (016-26461, Wako), diluted 1:1000 to label microglia; GFAP conjugated to Cy3 (C9205, Sigma), diluted 1:400 to label astrocytes and reactive Müller glia, and Collagen IV (AB769 Millipore), diluted 1:500 to label blood vessels. The secondary antibodies were raised in donkey, conjugated to IgG-Alexa488, IgG-Alexa594 or IgG-Alexa647 (ThermoFisher Scientific), diluted 1:200. All immunostaining steps included incubation with 5% donkey serum for 24 hours, primary antibodies for 3 days, and secondary antibodies for 24 hours, all at 4˚C with gentle agitation. The antibodies were diluted in 1% triton-PBS.
Stereological cell counting
Retinal ganglion cells and microglial cells were counted using an Optical Fractionator (MBF BioScience) throughout the entire thickness of the retina. The Optical Fractionator estimates the total number of cells using cell counts sampled with Systematic Random Sampling (SRS) [32]. The periodicity of the sampling grid was 700 μm × 700 μm, while the sampled field at each location was 30 μm × 30 μm for retinal ganglion cell counts and 90 μm × 90 μm for microglial cell counts.
Fundus fluorescein angiography
After brief anesthesia with isoflurane, the rats were given an intramuscular injection of Midazolam (3 mg/kg; Akorn Inc., Lake Forest, IL, USA). Standard procedures were followed using the Phoenix MicronIV (Phoenix Research Laboratories, Pleasanton, CA) to perform fundus fluorescein angiography (FFA). Materials included 1% tropicamide ophthalmic solution, 2.5% phenylephrine hydrochloride ophthalmic solution (Paragon BioTeck, Inc. Portland, Oregon, USA), GONAK Hypromellose Ophthalmic Demulcent Solution, and AK-Fluor 10% fluorescein (intraperitoneal injection, 1 μl/g body weight). All ophthalmic solutions and fluorescein were from Akorn Inc. (Lake Forest, IL, USA), unless otherwise indicated.
Retinal trypsin digest
The retinas were digested with trypsin as described [33] with the following exceptions. After 24 hours in water, the retinas were transferred to a 1% triton solution for one hour, and then were incubated at 37˚C in a solution of 3% trypsin (Gibco 1:250) for two hours. The following day, Periodic Acid Schiff staining was performed as described [34]. A representative trypsin digest of a whole diabetic Nile rat retina is presented in supplemental figure 1.
Retinal diameter measurements
Trypsin digested samples were imaged at 40× magnification. Measurements of retinal vessel diameters were obtained with the Vessel Assessment and Measurement Platform for Images of the REtina (VAMPIRE) software suite [35]. Six largest arteries and veins were used to compute the central retinal artery equivalent (CRAE) and central retinal vein equivalent (CRVE).
Quantification of cellular changes
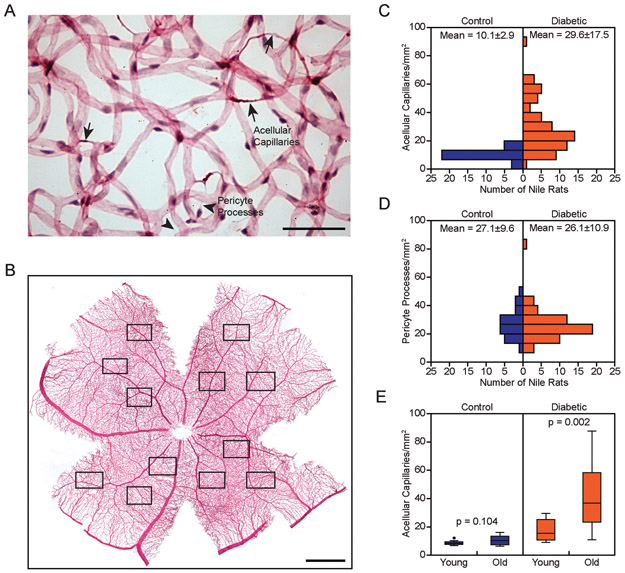
Micrographs for quantification were taken with a Canon Rebel XSi digital camera (Canon, Tokyo, Japan) attached to an Olympus CKX41 microscope via an LM scope C-mount. For acellular capillary counts and pericyte processes, 12 micrographs were taken from 3 randomly selected areas in each of the 4 retinal quadrants and analyzed at a final magnification of 200× (Fig. 1B). The total area used for quantification corresponded to approximately 8.5% of whole retinal area. For pericytes and endothelial cells, 8 micrographs were captured, 2 from each quadrant at 400× magnification. The counts were quantified using FIJI computer software by two masked graders.
Figure 1.
Increased acellular capillaries characterize retinopathy in diabetic Nile rats. A: Trypsin digest micrograph of a diabetic retina. Arrows = acellular capillaries; arrowheads = pericyte processes. Scale bar = 50 μm. B: Representative retinal trypsin digest, 12 fields sampled per retina, 3 per quadrant. Scale bar = 1 mm. C: Distribution of diabetic (n = 64) versus control Nile rats (n = 30) across increasing acellular capillaries. These Nile rats were between 20 to 80 weeks old. Standard deviation is reported beside the mean. D: Distribution of the same cohort of Nile rats as panel C across increasing pericyte processes. E: Significantly increased acellular capillaries in old Nile rats (n = 17) compared to young Nile rats (n = 6) in the diabetic group, p < 0.05. No significant difference between old Nile rats (n = 18) and young Nile rats (n = 15) in the control group. Old rats = 64 to 72 weeks old. Young rats = 24 to 32 weeks old.
Statistical Analysis
The relationship between the number of acellular capillaries in the left and right eye was tested using Pearson’s correlation. To verify if the Kaplan Meier curves were significantly different from each other, we used Wilcoxon tests. We performed linear regression to analyze the continuous progression of diabetic retinopathy. All statistical analysis was performed on IBM SPSS Statistic software, version 24 and Prism 7.
Results
Retinal acellular capillaries
Acellular capillaries are degenerate vascular segments that can appear as empty basement membrane tubes or more frequently, as coarse string remnants. Although a limited number of acellular capillaries can be found in a healthy retina [36], an increased number of acellular capillaries is a discriminant feature of diabetic retinopathy [37]. Acellular capillaries must be distinguished from the thin wispy lines of processes resulting from pericyte migration (Fig. 1A) [38]. We counted acellular capillaries and pericyte processes in trypsin digested retinas (Fig. 1B). Diabetic rats had nearly three times the number of acellular capillaries compared to the controls (Fig. 1C). In comparison, the number of pericyte processes did not differ between the diabetic and control groups (Fig. 1D). Acellular capillaries increased marginally with age in control animals, but increased dramatically in age-matched diabetic animals (Fig. 1E). Because diabetic retinopathy is a bilateral disease, we confirmed that the numbers of acellular capillaries in each eye of 21 pairs of retinas were highly correlated (Supplementary Fig. 2). For the remainder of the study, we relied only on counts from one eye per Nile rat. In animals without diabetes, the number of acellular capillaries ranged from 5.8 to 16.2 acellular capillaries per mm2. Therefore, we defined diabetic animals with over 16.2 acellular capillaries per mm2 as having retinopathy.
Early changes in the diabetic retina
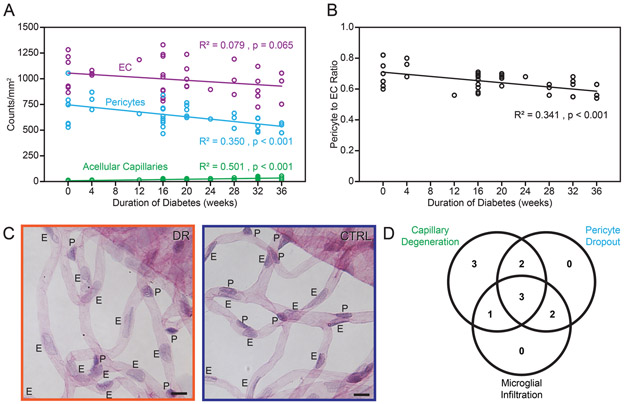
To capture the early events of diabetic retinopathy, we examined Nile rats on a standard rodent diet as duration of diabetes increased up to 36 weeks. In individual rats, counts were obtained from acellular capillaries, pericytes, endothelial cells, microglial cells and retinal ganglion cells. We performed linear regression analyses to explore how duration of diabetes predicts our observed cellular changes: acellular capillaries (R2 = 0.501, p < 0.001); pericytes (R2 = 0.350, p = 0.001); endothelial cells (R2 = 0.079, p = 0.065); microglial cells (R2 = 0.189, p = 0.048) and retinal ganglion cells (R2 = 0.016, p = 0.552). At this stage, we did not observe retinal ganglion cell loss even though vascular cell loss and an increase in microglial cells were evident.
Figure 2A shows the vascular cell and acellular capillary changes as diabetes progresses. Specifically, the pericyte-to-endothelial cell ratio decreases over time during early retinopathy (Fig. 2B). Pericyte dropout is shown in Fig. 2C.
Figure 2.
Early retinal cellular changes in diabetic Nile rats. Cell number trends of endothelial cells, pericytes and acellular capillaries (A) and pericyte to endothelial cell ratios (B) as diabetes progresses. N = 48 rats from 20 to 44 weeks old C: Micrographs showing evidence of pericyte loss - diabetic retina on the left and age-matched control on the right. E = endothelial cells. P = pericytes. Pericytes have smaller dark-staining nuclei compared to endothelial cells, which have larger nuclei with lighter staining. Orange outline = diabetic retinopathy. Blue outline = control. D: A Venn diagram with the number of diabetic Nile rats having the respective conditions. Diabetic rats were defined as having each of the three conditions by using a cutoff calculated from the average count of the controls plus one standard deviation (n = 11 diabetic rats and 11 control rats).
To delineate the temporal sequence further, we investigated the co-occurrence of increased acellular capillaries, pericyte dropout, and microglial infiltration in individual diabetic rats. We found that each rat observed with increased microglial cells always had vascular loss, but microglial cell numbers were unaffected in 5 out of 11 rats with vascular loss (Fig. 2D), suggesting that the vascular changes occur before microglial infiltration.
Retinal vessel caliber has been investigated as a biomarker for incidence and progression of diabetic retinopathy for years [39], but is rarely measured in animal models. A previous population-based study limited to diabetic patients with early or lack of isolated retinopathy signs reported that larger central venular caliber, but not central arteriolar caliber, was associated with increasing HbA1c [40]. Similarly, we found that in the early progression of diabetic retinopathy in the Nile rat, CRVE linearly correlates with HbA1c (R2 = 0.545, p < 0.001), but CRAE did not (R2 = 0.055, p = 0.333).
Progression of diabetic retinopathy
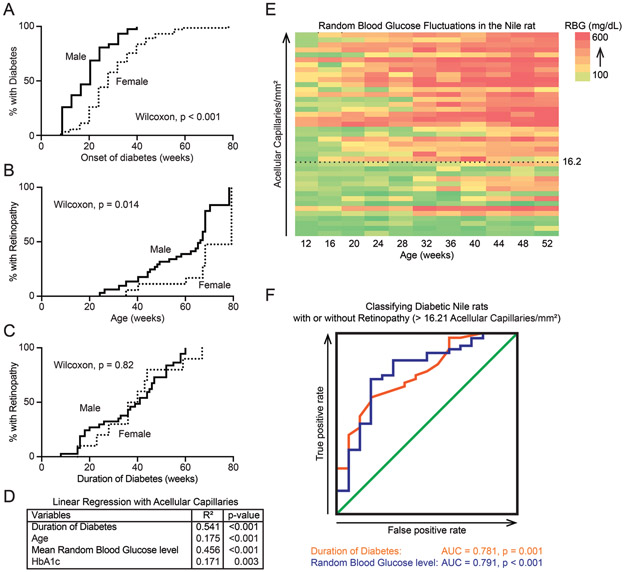
Next, we used acellular capillary counts to monitor the progression of diabetic retinopathy from the earliest stages. Consistent with a prior study [23], males developed diabetes earlier than females (Fig. 3A). Using the threshold of 16.2 acellular capillaries per mm2 (explained above), we categorized diabetic rats into those with or without retinopathy. Not surprisingly, diabetic males developed retinopathy at a younger age than diabetic females (Fig. 3B, Wilcoxon test, p < 0.001). However, both sexes did not differ in propensity to develop retinopathy when normalized for duration of diabetes (Fig. 3C, Wilcoxon test, p = 0.82).
Figure 3.
Progression of retinopathy in diabetic Nile rats. A: A Kaplan-Meier graph showing the percentage of male rats (n = 111) and female rats (n = 113) developing diabetes over time. Males and females differed significantly (Wilcoxon test, χ2 = 25.12, p < 0.001). B: A Kaplan-Meier graph showing the percentage of diabetic male rats (n = 43) and female rats (n = 13) developing retinopathy over time. Males developed retinopathy at significantly earlier ages (Wilcoxon test, χ2 = 6.383, p < 0.05). C: A Kaplan-Meier graph presenting the same cohort of animals as panel B but normalized to duration of diabetes. Both sexes take roughly the same duration of diabetes to develop retinopathy (Wilcoxon test, χ2 = 0.05, p = 0.82). D: A summary of linear regression statistics between multiple variables and the number of acellular capillaries. E: A heat map showing RBG fluctuations across age (n = 41), sorted by increasing number of acellular capillaries. 16.2 acellular capillaries is the cutoff used to define diabetic Nile rats with retinopathy. F: Two ROC curves depicting the usefulness of “duration of diabetes” or “mean RBG” as classifiers of retinopathy in diabetic Nile rats. AUC = area under the curve.
The variation in acellular capillaries was more correlated with mean RBG than HbA1c (R2 = 0.456 for mean RBG vs. 0.171 for HbA1c), and more correlated with duration of diabetes than age (R2 = 0.541 for duration of diabetes vs. 0.175 for age; Fig. 3D). To illustrate RBG fluctuations in individual rats, we computed a heat map for 41 rats using RBG records up to 52 weeks old, sorted by number of acellular capillaries (Fig. 3E). To gauge the ability of duration of diabetes or mean RBG to predict whether a Nile rat has retinopathy or not, we generated two receiver operating characteristic (ROC) curves. Using the same set of data as figures 3B and C, 56 diabetic rats each had an associated duration of diabetes and mean RBG, then based on acellular capillary counts, were classified as having retinopathy or not. Depending on the cutoff in the predictor (duration of diabetes or mean RBG), there will be a true positive rate and false positive rate associated with it. ROC curves were plotted using the true positive rate versus the false positive rate for each cutoff in the predictor. How well the test variable separates between these two groups of animals is measured by the area under the curve (AUC), where AUC = 0.5 means inability to separate and AUC = 1 means perfect ability to separate. The AUC for duration of diabetes was 0.781, p = 0.001 and the AUC for mean RBG was 0.791, p < 0.001 (Fig. 3F); both predict retinopathy fairly well.
Retinal leakage and retinal edema
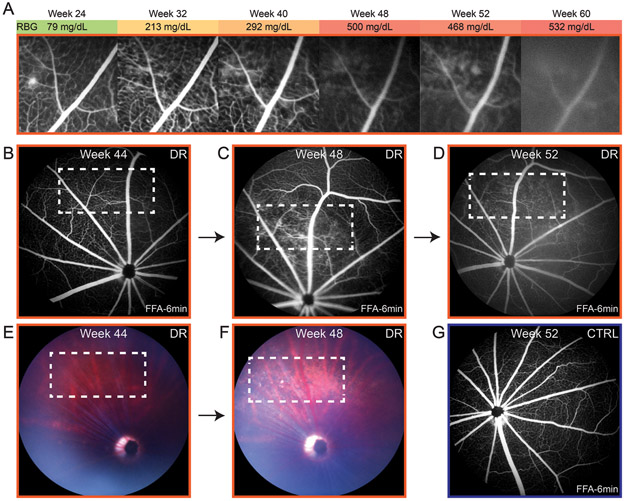
We performed fundus fluorescein angiography (FFA) on 40 animals (31 diabetic; 9 control) every 4 weeks from 20 to 60 weeks of age. Out of 31 diabetic rats, we only detected leakage in one, beginning with an isolated leak at 24 weeks old during pre-diabetes (Fig. 4A). However, 15 of the diabetic rats developed cataracts before 36 weeks of age and the presence of any leakage would likely have been obscured by poor image quality. None of the control rats developed retinopathy or demonstrated leakage (Fig. 4G). From the same animals, we further analyzed eyes from 28 diabetic rats (3 had died prematurely), and confirmed retinopathy in 23 rats using acellular capillary counts. To determine whether leakage was indeed a rare event, we selected 15 older diabetic rats, 60-82 weeks of age, not compromised by cataracts that had FFA imaging done at least once. Of these, we observed leakage in 5 of them. The progression of diabetic retinopathy in one rat is shown in figures 4B-D, where the leakage became apparent at 48 weeks by FFA (Fig. 4C). Additionally, the fundus looked abnormal at 48 weeks (Fig. 4F), with more light reflected in a damaged area and a few bright dense spots.
Figure 4.
Retinal vascular leakage in diabetic Nile rats. A: The progression of retinal leakage in a diabetic Nile rat. The reduced clarity of the FFA from 48 weeks onwards was not from continued leakage but rather, from cataract forming in that eye. In another diabetic rat, the area of progressive leakage (B-D) is shown with the corresponding fundus images (E and F). The white outline marks the area where leakage developed. G: An age-matched control to the diabetic rat in panel D. Orange outline = diabetic retinopathy. Blue outline = control.
As the retinal leakage progresses, it can result in edema and subsequent vision loss in patients. To detect edema in the Nile rat, we measured central retinal thickness. Compared to control rats without diabetes, 4 out of 7 diabetic retinas with retinopathy had increased retinal thickness relative to the controls (Supplementary Figure 3A). Interestingly, only the 4 out of 7 diabetic retinas with increased thickness presented with gliosis (Supplementary Figure 3B), suggesting that glial dysfunction could be linked to edema.
Capillary non-perfusion
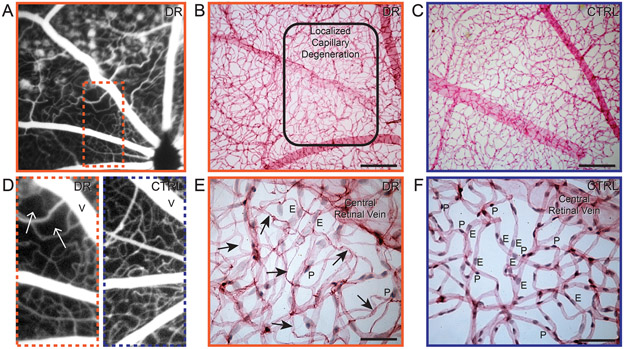
Clinically, capillary non-perfusion is described as localized areas void of patent blood vessels on the FFA and is a feature of diabetic retinal ischemia. Trypsin digest of post-mortem retinas of patients with diabetic retinal ischemia reveal significant areas of capillary loss, indicating capillary non-perfusion in that area [41]. A similar phenotype was observed in diabetic Nile rats. In the FFA of one diabetic Nile rat, in addition to the obvious leakage seen as small round pools of fluorescein, we observed an area with an abnormally low density of perfused retinal vessels near the optic nerve head (Fig. 5A). To highlight the sparse vessel density, a comparison image of a control rat is shown side-by-side (Fig. 5D). The margin of capillary non-perfusion was more clearly depicted in a trypsin digest of the same retina (Fig. 5B). Within this area, at higher magnification, almost all endothelial cells and pericytes were visibly absent, leaving several empty basement membrane tubes (Fig. 5E). This was in conspicuous contrast to age-matched rats without diabetes (Figs. 5C and F). Out of 64 diabetic retinas analyzed, we found 4 with capillary non-perfusion.
Figure 5.
Capillary non-perfusion in diabetic Nile rats. A: FFA of a 52-week-old Nile rat exhibiting leakage and capillary non-perfusion (inset dotted line). D: A magnified version of the orange dotted rectangle in panel A juxtaposed with a similar region in the retina of an age-matched control on the right. B: A trypsin digest of the same retina as panel A but eight weeks later, at 60 weeks old. The rounded rectangle shows the border of capillary non-perfusion, magnified in panel E. An age-matched control of panel B is shown in panel C, magnified in panel F. Scale bars for panels B and C = 200 μm. Scale bars for panels E and F = 50 μm. V = central retinal vein. Arrow = acellular capillary. E = endothelial cell. P = pericyte. Orange outline = diabetic retinopathy. Blue outline = control.
Proliferative diabetic retinopathy
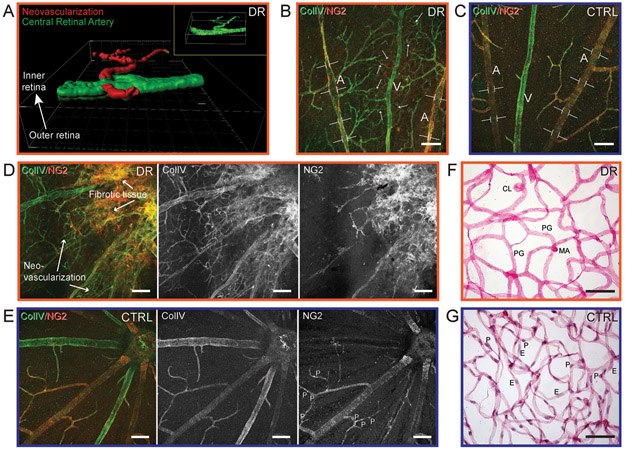
Proliferative diabetic retinopathy is an advanced stage of the disease and leads to loss of vision, generally from ischemia, hemorrhage and fibrosis [17, 42]. We identified two diabetic Nile rats with proliferative diabetic retinopathy, where the neovascularization appeared above the retinal surface based on confocal imaging. In the first rat, neovascularization stemming from one retinal artery was isolated digitally from a z-stack confocal image to illustrate the spatial location (Fig. 6A). Figures 6B, C and D were from the second rat with severe proliferative diabetic retinopathy, that presented with intraocular hemorrhage when alive. In advanced diabetic retinopathy, neovascularization often extends through the inner limiting membrane of the retina into the vitreous resulting in vitreous hemorrhage. In this rat, the central retinal arteries had uneven vessel caliber, depicted by brackets (Fig. 6B), compared to the homogenous vessel caliber in healthy rats (Fig. 6C). Intriguingly, aberrant neovascularization, evidenced by collagen IV labeling of dense tortuous fine vessels, appeared to be closer to the retinal vein (Fig. 6B). This is in line with the human disease, where the neovascularization develops from the venous side of the retinal circulation [41]. Coming from a location in this same retina closer to the optic nerve head, fibrotic tissue, as defined by morphology, can be observed (Fig. 6D), in contrast with healthy retinal vessels (Fig. 6E). Specifically, this compromised retina showed greatly reduced NG2-positive pericytes (Fig. 6D) compared to a healthy retina with evenly spaced pericytes along the vessels (Fig. 6E). The absence of both endothelial cells and pericytes was confirmed in the trypsin digest, performed on the same retina after immuno-labeling (Fig. 6F). In a healthy retina, the nuclei of the endothelial cells and pericytes were clearly stained (Fig. 6G). In figure 6F, a few stained nuclei appeared to be neither endothelial cells nor pericytes, but rather unwashed neuronal cells from the trypsin digest procedure. Additional vascular lesions in this retina included capillary loops, pericyte ghosts, and microaneurysms (Fig. 6F).
Figure 6.
Neovascularization in diabetic Nile rats. A: The spatial orientation of pre-retinal neovascularization in a rat with proliferative diabetic retinopathy. Using Imaris software, a smoothened surface was created from an isolated retinal artery stained with Col IV. The superficial retinal vessels were artificially colored in green and the pre-retinal neovascularization colored in red. B: Uneven caliber of retinal artery in a diabetic retina, highlighted by brackets and neovascularization, highlighted by multiple arrows, which is denser around the retinal vein. A = central retinal artery. V = central retinal vein. C: An age-matched control of panel B. D: Fibrotic tissue and neovascularization around the optic nerve head at the top right corner. Col IV highlights the neovascularization and NG2 highlights the absences of pericytes. E: An age-matched control of panel D. Panels B, D and F are from the same diabetic retina. F: A retinal trypsin digest micrograph. G: An age-matched control of panel F. CL = capillary loop. PG = pericyte ghost. MA = microaneurysm. E = endothelial cell. P = pericyte. Scale bar = 50μm. Orange outline = diabetic retinopathy. Blue outline = control.
Intraretinal microvascular abnormalities
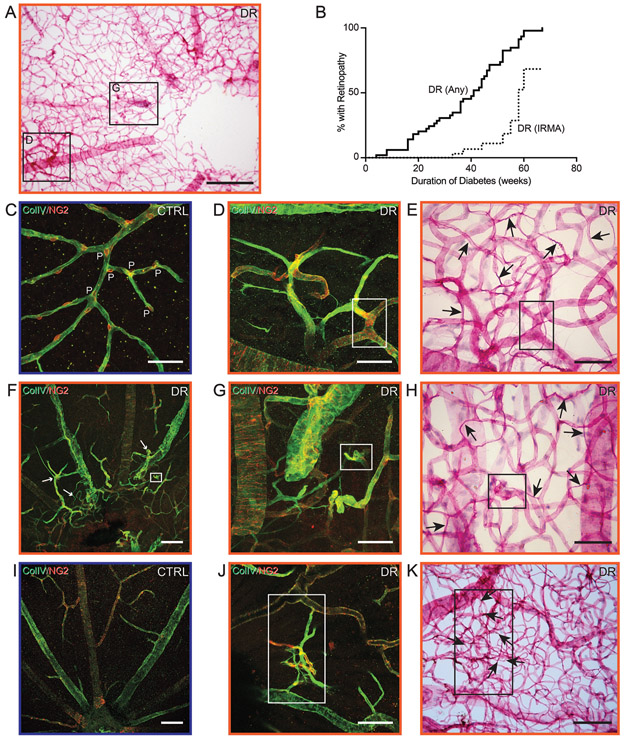
In patients, intraretinal microvascular abnormalities are a major risk factor for progression to proliferative diabetic retinopathy [43] and their fundus morphology is clearly defined, but this feature is rarely and vaguely described in animal models [44]. Upon post-mortem immunofluorescence analysis and trypsin digest of diabetic Nile rats, we identified 8 out of 45 with distinctive abnormalities within the retinal thickness (Figs. 7A and C) that involved microvascular torsion, much like intraretinal microvascular abnormalities in patients. These microvascular abnormalities were only seen with a prolonged duration of diabetes, with a dramatic increase at around 60 weeks of diabetes (Fig. 7B). Aforementioned microvascular abnormalities in the diabetic Nile rat included dilated tortuous capillaries (Figs. 7D and E), abnormally branched capillaries (Figs. 7G and H), and arteriolar-venular shunts (Figs. 7J and K). Evenly spaced pericytes were absent in these aberrant regions compared to elsewhere within the same retina (Fig. 7F). Additionally, these abnormal areas revealed an obviously higher density of acellular capillaries (Figs. 7E, H, and K).
Figure 7.
Intraretinal microvascular abnormalities in diabetic Nile rats. A: A retinal trypsin digest of a diabetic Nile rat with multiple regions of microvascular abnomalities. Insets are magnified as panels D and G. Scale bar = 200 μm. B: A Kaplan-Meier graph showing the percentage of diabetic Nile rats developing any retinopathy (>16.21 acellular capillaries/mm2) versus a proportion of them developing intraretinal microvascular abnormalities (confirmed by immunohistochemistry and trypsin digests). C: An age-matched control exhibiting evenly spaced pericytes along the retinal capillaries. P = pericyte. D: Loss of pericytes and abnormal branched capillaries. E: Same area as panel D, after trypsin digest. The insets in panels D and E mark the same vessel. F: Aberrant retinal vessels surrounding the optic nerve head, highlighted by white arrows. Age-matched control depicted in panel I. G: Magnified from panel F. H: Same area as panel G, after trypsin digest. The insets in panels F, G and H mark the same vessel. J: Another area with intraretinal microvascular abnormalities from the same retina but not within the field of view in panel A. K: Same area as panel J, after trypsin digest. The insets in panels J and K mark the same vessels. Black arrows = acellular capillaries. Scale bars in C-E, G, H, J and K = 50 μm. Scale bars in F and I = 100 μm.
Other retinal microvascular abnormalities in diabetic Nile rats
Microaneuryms, though frequently observed in humans, were only rarely observed in the Nile rat (Supplementary Fig. 4A). Other features found in diabetic Nile rats included capillary loops and re-duplications (Supplementary Figs. 4B and C), venous beading, dilated venules, venular occlusion, and arterial tortuosity (Supplementary Figs. 4D-I).
Spatial distribution of microglial cell infiltration
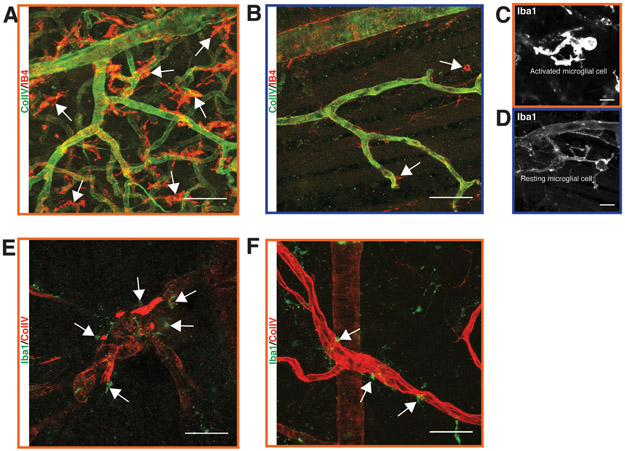
Our earlier data (Fig. 2) suggested that microglial infiltration begins near the time of the initial vascular changes in Nile rat diabetic retinopathy. In the Nile rat retina, we observed a wide distribution of microglial cells without specific patterns linked to retinopathy (Supplementary Fig. 5). We did not have identical spatial resolution for the microglial cell and acellular capillary distributions in the above data set to examine co-localization directly. In later studies, we examined several advanced diabetic retinas for the presence of vascular lesions and microglial cells. In the retina exhibiting proliferative diabetic retinopathy shown in figures 6B-D, a conspicuously high density of microglial cells covered the entire retina, the majority of which appeared to be activated microglial cells (Figs. 8A and C; control 8B and D). Microglial cells also tended to surround arteriolar and venular abnormalities (Figs. 8E and F). Our data suggests that inflammation and vascular changes are closely linked both temporally and spatially.
Figure 8.
Microglial infiltration during diabetic retinopathy in the Nile rat. A: Abnormally high density of microglial cells in a retina with proliferative diabetic retinopathy. B: An age-matched control of panel A. C: An activated microglial cell at high magnification from the same retina as in panel A. D: A resting microglial cell at high magnification from the same retina as in panel B. E: Several microglial cells surround a highly tortuous arteriolar structure in a diabetic retina. F: A few microglial cells surround a dilated venule in a diabetic retina. Scale bars of A, B, E and F = 50 μm. Scale bar of C and D = 10 μm.
Lipemia retinalis
Lipemia retinalis is a rare manifestation of hyperlipemia associated with diabetic patients, where the retinal veins and arteries are pink-to-creamy-white color on the fundus imaging [45]. 20% of Nile rats with diabetic retinopathy presented lipemia retinalis (Supplementary Fig. 6).
Discussion
The earliest changes that occur in the diabetic retina remain poorly understood, hindered by insufficient histological material from human donors and a lack of animal models that accurately mirror the human condition. Because of the limited resolution, clinical imaging studies cannot reveal the earliest cellular changes in diabetic retinopathy, and it is those earliest changes that should offer the greatest insights into the events that initiate the disease. Because appropriately staged human material is so difficult to obtain, more accurate animal models that mimic the natural history of diabetic retinopathy in humans are urgently needed. The Nile rat is a well-documented animal model for nutritionally induced type 2 diabetes, so here we sought to better document the temporal progression and range of lesions observed in diabetic retinopathy in this animal model.
It is challenging to pin down the sequence of events leading to the development of diabetic retinopathy. As with the human population, the progression of type 2 diabetes and subsequent development of diabetic retinopathy is highly variable in the Nile rats, thus a large sample size is required. To identify the earliest events, we selected young rats from 20 to 44 weeks of age. Since duration of diabetes is one of the most important risk factors for diabetic retinopathy, by conducting a linear regression study based on duration of diabetes, we highlighted the continuous relationship of observed cellular changes to the development of diabetic retinopathy.
After 36 weeks of diabetes, acellular capillaries increased by about 300% and pericytes decreased by about 25%, but a progressive endothelial cell loss was not obvious. At 0 weeks of diabetes, there were only ~10 acellular capillaries, ~950 endothelial cells, and ~700 pericytes per square millimeter of retina. Because of the very low initial number of acellular capillaries, a modest increase to ~30 acellular capillaries was statistically significant. The relatively large number of endothelial cells at 0 weeks and the variation in numbers between animals would explain why a loss of endothelial cells comparable to the increase in acellular capillaries would not yet be statistically significant during this early period. Nonetheless, there was already a significant decline in pericyte numbers during this period. Preferential loss of pericytes and accelerated accumulation of acellular capillaries are consistent with studies done with diabetic donor eyes without advanced retinopathy lesions [46, 47].
As acellular capillaries increased and pericytes decreased, microglial cells increased by about 20%, but retinal ganglion cell loss was not detected. This suggests that neurodegeneration, as typified by retinal ganglion cell loss, lags behind vascular degeneration and microglial cell infiltration during the development of retinopathy in the diabetic Nile rat. To further delineate the temporal sequence of events, we inspected vascular and microglial cellular changes in eleven individual rats, and found that some retinas with retinal vascular degeneration did not have increased microglial cells but all retinas with increased microglial cells also exhibited vascular degeneration. Taken together, our data support vascular degeneration as the initiating event of diabetic retinopathy in the Nile rat.
Our results document that the Nile rat exhibits a diabetic retinopathy that shares a range of lesions with the human condition (Fig. 9). Importantly, in this model, we found in the Nile rat retinal pathology similar to the three clinical conditions responsible for vision loss, namely edema, capillary non-perfusion and proliferative diabetic retinopathy. This animal model is not without its limitations, however. First, although the range of lesions overlaps considerably with the human condition, the frequency of some lesions, notably microaneurysms, differs considerably. Second, most of the older diabetic animals develop cataracts; so assessing the function of the retina in animals with advanced disease is difficult. And third, similar to the human condition, the timing of the onset of diabetes and the subsequent onset of diabetic retinopathy is variable and the experiments require prolonged timeframes of many months. However, because the onset of type 2 diabetes in the Nile rat can be consistently induced by dietary manipulations that parallel the dietary changes linked to the human condition, this animal model does have great promise for identifying and testing novel therapies for both type 2 diabetes and diabetic retinopathy.
Figure 9.
Progression of diabetic retinopathy in the Nile rat. In our cohort, 75% of diabetic rats ≥ 24 weeks old had increased acellular capillaries, mean RBG ≥ 128 mg/dL; duration of diabetes ≥ 8 weeks; 17% of diabetic rats ≥ 32 weeks old had lipemia retinalis, mean RBG ≥ 235 mg/dL; duration of diabetes ≥ 24 weeks, 23% of diabetic rats ≥ 45 weeks old had microvascular abnormalities, mean RBG ≥ 277 mg/dL, duration of diabetes ≥ 32 weeks; 3% of diabetic rats ≥ 52 weeks old had localized extensive capillary loss, mean RBG ≥ 237 mg/dL, duration of diabetes ≥ 30 weeks; 7% of diabetic rats ≥ 68 weeks old had proliferative diabetic retinopathy, mean RBG ≥ 448 mg/dL, duration of diabetes ≥ 48 weeks.
Supplementary Material
Acknowledgement
This study was supported by: The Garland Initiative for Vision funded by the William K. Bowes Jr. Foundation; NIH grant EY-019968 and core facility grants to the Waisman Center from NICHD (U54 HD090256) and to the NRI-MCDB Microscopy Facility from NSF MRI (DBI-1625770).
We thank the K.C. Hayes lab for the founder Nile rats of our colony and for valuable advice on Nile rat husbandry and nutrition. We also thank the W. Stallcup lab for their antibody gift.
Footnotes
Disclosure/Conflict of Interest
The authors declare no duality of interests.
References
- 1.Yau JW, Rogers SL, Kawasaki R, et al. Global prevalence and major risk factors of diabetic retinopathy. Diabetes Care 2012;35:556–64. [DOI] [PMC free article] [PubMed] [Google Scholar]
- 2.Zhou B, Lu Y, Hajifathalian K, et al. Worldwide trends in diabetes since 1980: a pooled analysis of 751 population-based studies with 4.4 million participants. Lancet 2016;387:1513–1530. [DOI] [PMC free article] [PubMed] [Google Scholar]
- 3.Chen MS, Kao CS, Chang CJ, et al. Prevalence and Risk-Factors of Diabetic-Retinopathy among Noninsulin-Dependent Diabetic Subjects. American Journal of Ophthalmology 1992;114:723–730. [DOI] [PubMed] [Google Scholar]
- 4.Yun JS, Lim TS, Cha SA, et al. Clinical Course and Risk Factors of Diabetic Retinopathy in Patients with Type 2 Diabetes Mellitus in Korea. Diabetes Metab J 2016;40:482–493. [DOI] [PMC free article] [PubMed] [Google Scholar]
- 5.Penman A, Hancock H, Papavasileiou E et al. Risk Factors for Proliferative Diabetic Retinopathy in African Americans with Type 2 Diabetes. Ophthalmic Epidemiol 2016; 23:88–93. [DOI] [PMC free article] [PubMed] [Google Scholar]
- 6.Ahmed RA, Khalil SN, and Al-Qahtani MA. Diabetic retinopathy and the associated risk factors in diabetes type 2 patients in Abha, Saudi Arabia. J Family Community Med 2016;23:18–24. [DOI] [PMC free article] [PubMed] [Google Scholar]
- 7.Rajalakshmi R, Amutha A, Ranjani H, et al. Prevalence and risk factors for diabetic retinopathy in Asian Indians with young onset type 1 and type 2 diabetes. J Diabetes Complications 2014;28:291–7. [DOI] [PubMed] [Google Scholar]
- 8.Yoshida Y, Hagura R, Hara Y, et al. Risk factors for the development of diabetic retinopathy in Japanese type 2 diabetic patients. Diabetes Res Clin Pract 2001;51:195–203. [DOI] [PubMed] [Google Scholar]
- 9.Lee R, Wong TY, and Sabanayagam C. Epidemiology of diabetic retinopathy, diabetic macular edema and related vision loss. Eye Vis (Lond) 2015;2:17. [DOI] [PMC free article] [PubMed] [Google Scholar]
- 10.Cogan DG, Toussaint D, and Kuwabara T. Retinal vascular patterns. IV. Diabetic retinopathy. Arch Ophthalmol 1961;66:366–78. [DOI] [PubMed] [Google Scholar]
- 11.Beltramo E and Porta M. Pericyte loss in diabetic retinopathy: mechanisms and consequences. Curr Med Chem 2013;20:3218–25. [DOI] [PubMed] [Google Scholar]
- 12.Kern TS and Engerman RL. Vascular lesions in diabetes are distributed non-uniformly within the retina. Exp Eye Res 1995;60:545–9. [DOI] [PubMed] [Google Scholar]
- 13.Powell ED and Field RA. Diabetic Retinopathy and Rheumatoid Arthritis. Lancet 1964;2:17–8. [DOI] [PubMed] [Google Scholar]
- 14.Wolter JR. Diabetic retinopathy. Am J Ophthalmol 1961;51:1123–41. [DOI] [PubMed] [Google Scholar]
- 15.Klein R, Klein BE, Moss SE, et al. The Wisconsin epidemiologic study of diabetic retinopathy. IV. Diabetic macular edema. Ophthalmology 1984;91:1464–74. [DOI] [PubMed] [Google Scholar]
- 16.Davis MD, Fisher MR, Gangnon RE, et al. Risk factors for high-risk proliferative diabetic retinopathy and severe visual loss: Early treatment diabetic retinopathy study report #18. Investigative Ophthalmology & Visual Science 1998;39:233–252. [PubMed] [Google Scholar]
- 17.Bresnick GH, De Venecia G, Myers FL, et al. Retinal ischemia in diabetic retinopathy. Arch Ophthalmol 1975;93:1300–10. [DOI] [PubMed] [Google Scholar]
- 18.Olivares AM, Althoff K, Chen GF, et al. Animal Models of Diabetic Retinopathy. Curr Diab Rep 2017;17:93. [DOI] [PMC free article] [PubMed] [Google Scholar]
- 19.Cai X and McGinnis JF. Diabetic Retinopathy: Animal Models, Therapies, and Perspectives. J Diabetes Res 2016;2016:3789217. [DOI] [PMC free article] [PubMed] [Google Scholar]
- 20.Jiang X, Yang L, and Luo Y, Animal Models of Diabetic Retinopathy. Curr Eye Res 2015;40:761–71. [DOI] [PubMed] [Google Scholar]
- 21.Volek JS, Phinney SD, Forsythe CE et al. Carbohydrate Restriction has a More Favorable Impact on the Metabolic Syndrome than a Low Fat Diet. Lipids 2009;44:297–309. [DOI] [PubMed] [Google Scholar]
- 22.Snorgaard O, Poulsen GM, Andersen HK, et al. Systematic review and meta-analysis of dietary carbohydrate restriction in patients with type 2 diabetes. Bmj Open Diabetes Research & Care 2017;5:e000354. [DOI] [PMC free article] [PubMed] [Google Scholar]
- 23.Chaabo F, Pronczuk A, Maslova E, et al. Nutritional correlates and dynamics of diabetes in the Nile rat (Arvicanthis niloticus): a novel model for diet-induced type 2 diabetes and the metabolic syndrome. Nutr Metab (Lond) 2010;7:29. [DOI] [PMC free article] [PubMed] [Google Scholar]
- 24.Bolsinger J, Pronczuk A, and Hayes KC. Dietary carbohydrate dictates development of Type 2 diabetes in the Nile rat. J Nutr Biochem 2013;24:1945–52. [DOI] [PubMed] [Google Scholar]
- 25.Yang K, Gotzmann J, Kuny S, et al. Five stages of progressive beta-cell dysfunction in the laboratory Nile rat model of type 2 diabetes. J Endocrinol 2016;229:343–56. [DOI] [PubMed] [Google Scholar]
- 26.Subramaniam A, Landstrom M, Luu A, et al. The Nile Rat (Arvicanthis niloticus) as a Superior Carbohydrate-Sensitive Model for Type 2 Diabetes Mellitus (T2DM). Nutrients 2018;10. [DOI] [PMC free article] [PubMed] [Google Scholar]
- 27.Noda K, Nakao S, Zandi S, et al. Retinopathy in a novel model of metabolic syndrome and type 2 diabetes: new insight on the inflammatory paradigm. FASEB J 2014;28:2038–46. [DOI] [PMC free article] [PubMed] [Google Scholar]
- 28.Han WH, Gotzmann J, Kuny S, et al. Modifications in Retinal Mitochondrial Respiration Precede Type 2 Diabetes and Protracted Microvascular Retinopathy. Invest Ophthalmol Vis Sci 2017;58:3826–3839. [DOI] [PubMed] [Google Scholar]
- 29.Noda K, Melhorn MI, Zandi S, et al. An animal model of spontaneous metabolic syndrome: Nile grass rat. FASEB J 2010;24:2443–53. [DOI] [PMC free article] [PubMed] [Google Scholar]
- 30.Bolsinger J, Landstrom M, Pronczuk A, et al. Low glycemic load diets protect against metabolic syndrome and Type 2 diabetes mellitus in the male Nile rat. J Nutr Biochem 2017;42:134–148. [DOI] [PubMed] [Google Scholar]
- 31.Nishiyama A, Lin XH, Giese N, et al. Co-localization of NG2 proteoglycan and PDGF alpha-receptor on O2A progenitor cells in the developing rat brain. J Neurosci Res 1996;43:299–314. [DOI] [PubMed] [Google Scholar]
- 32.Schmitz C, Eastwood BS, Tappan SJ, et al. Current automated 3D cell detection methods are not a suitable replacement for manual stereologic cell counting. Frontiers in Neuroanatomy 2014;8:27. [DOI] [PMC free article] [PubMed] [Google Scholar]
- 33.Chou JC, Rollins SD and Fawzi AA. Trypsin digest protocol to analyze the retinal vasculature of a mouse model. J Vis Exp 2013:e50489. [DOI] [PMC free article] [PubMed] [Google Scholar]
- 34.Dietrich N and Hammes HP. Retinal digest preparation: a method to study diabetic retinopathy. Methods Mol Biol 2012;933:291–302. [DOI] [PubMed] [Google Scholar]
- 35.Perez-Rovira A, MacGillivray T, Trucco E, et al. VAMPIRE: Vessel assessment and measurement platform for images of the REtina. Conf Proc IEEE Eng Med Biol Soc 2011;2011:3391–4. [DOI] [PubMed] [Google Scholar]
- 36.Brown WR. A review of string vessels or collapsed, empty basement membrane tubes. J Alzheimers Dis 2010;21:725–39. [DOI] [PMC free article] [PubMed] [Google Scholar]
- 37.Ashton N Studies of the Retinal Capillaries in Relation to Diabetic and Other Retinopathies. Br J Ophthalmol 1963;47:521–38. [DOI] [PMC free article] [PubMed] [Google Scholar]
- 38.Hammes HP, Feng Y, Pfister F, et al. Diabetic retinopathy: targeting vasoregression. Diabetes 2011;60:9–16. [DOI] [PMC free article] [PubMed] [Google Scholar]
- 39.Ding J, Ikram MK, Cheung CY, et al. Retinal vascular calibre as a predictor of incidence and progression of diabetic retinopathy. Clin Exp Optom 2012;95:290–6. [DOI] [PubMed] [Google Scholar]
- 40.Nguyen TT, Wang JJ, Sharrett AR, et al. Relationship of retinal vascular caliber with diabetes and retinopathy: the Multi-Ethnic Study of Atherosclerosis (MESA). Diabetes Care 2008;31:544–9. [DOI] [PubMed] [Google Scholar]
- 41.Curtis TM, Gardiner TA, and Stitt AW. Microvascular lesions of diabetic retinopathy: clues towards understanding pathogenesis? Eye (Lond) 2009;23:1496–508. [DOI] [PubMed] [Google Scholar]
- 42.Roy S, Amin S and Roy S. Retinal fibrosis in diabetic retinopathy. Exp Eye Res 2016;142:71–5. [DOI] [PMC free article] [PubMed] [Google Scholar]
- 43.Fundus photographic risk factors for progression of diabetic retinopathy. ETDRS report number 12. Early Treatment Diabetic Retinopathy Study Research Group. Ophthalmology 1991;98:823–33. [PubMed] [Google Scholar]
- 44.Kern TS and Engerman RL. Galactose-induced retinal microangiopathy in rats. Invest Ophthalmol Vis Sci 1995;36:490–6. [PubMed] [Google Scholar]
- 45.Fyfe WM, Hall MS and Scott JW. Lipaemia-Retinalis in Untreated Diabetes Mellitus. Archives of Disease in Childhood 1970;45:84–6. [DOI] [PMC free article] [PubMed] [Google Scholar]
- 46.Mizutani M, Kern TS and Lorenzi M. Accelerated death of retinal microvascular cells in human and experimental diabetic retinopathy. J Clin Invest 1996;97:2883–90. [DOI] [PMC free article] [PubMed] [Google Scholar]
- 47.Li W, Yanoff M, Liu X, et al. Retinal capillary pericyte apoptosis in early human diabetic retinopathy. Chin Med J (Engl) 1997;110:659–63. [PubMed] [Google Scholar]
Associated Data
This section collects any data citations, data availability statements, or supplementary materials included in this article.


