

Abstract
Objective
The first ever genome-wide association study (GWAS) of clinically defined gout cases and asymptomatic hyperuricaemia (AHUA) controls was performed to identify novel gout loci that aggravate AHUA into gout.
Methods
We carried out a GWAS of 945 clinically defined gout cases and 1003 AHUA controls followed by 2 replication studies. In total, 2860 gout cases and 3149 AHUA controls (all Japanese men) were analysed. We also compared the ORs for each locus in the present GWAS (gout vs AHUA) with those in the previous GWAS (gout vs normouricaemia).
Results
This new approach enabled us to identify two novel gout loci (rs7927466 of CNTN5 and rs9952962 of MIR302F) and one suggestive locus (rs12980365 of ZNF724) at the genome-wide significance level (p<5.0×10– 8). The present study also identified the loci of ABCG2, ALDH2 and SLC2A9. One of them, rs671 of ALDH2, was identified as a gout locus by GWAS for the first time. Comparing ORs for each locus in the present versus the previous GWAS revealed three ‘gout vs AHUA GWAS’-specific loci (CNTN5, MIR302F and ZNF724) to be clearly associated with mechanisms of gout development which distinctly differ from the known gout risk loci that basically elevate serum uric acid level.
Conclusions
This meta-analysis is the first to reveal the loci associated with crystal-induced inflammation, the last step in gout development that aggravates AHUA into gout. Our findings should help to elucidate the molecular mechanisms of gout development and assist the prevention of gout attacks in high-risk AHUA individuals.
Keywords: asymptomatic hyperuricemia, gout, genome-wide association study, uric acid, individually-tailored preemptive medicine
Key messeages.
What is already known about this subject?
We and others, in past genome-wide association studies (GWASs) of gout cases and normouricaemia controls, have identified multiple gout risk loci that elevate serum uric acid.
What does this study add?
We performed the first GWAS of clinically defined gout cases and asymptomatic hyperuricaemia (AHUA) controls.
This new approach identified two novel gout loci and one suggestive locus that aggravate AHUA into gout.
How might this impact on clinical practice or future developments?
This first discovery of ‘AHUA to gout’ loci using a new GWAS strategy will lead to an understanding of why only a proportion of hyperuricaemia cases develop gout.
These findings will assist physicians to identify, based on individual genetic differences, AHUA cases who need individually tailored pre-emptive medicine for gout.
Introduction
Gout is one of the the most common forms of inflammatory arthritis. It is induced by monosodium urate (MSU) crystals that result from elevated serum uric acid (SUA) level.1 The SUA level is determined by the excretion of uric acid via the urate transporters in the kidney and intestine,2 3 and the production of uric acid in the liver.2 While both genetic and environmental factors are known to cause hyperuricaemia and gout,4–9 these diseases are reported to have stronger genetic factors than many other common diseases.10 11 Thus far, a number of genes associated with SUA have been identified by genome-wide association studies (GWASs) of SUA,12–23 such as the urate transporter genes ABCG2 (also known as BCRP) and SLC2A9 (also known as GLUT9). We and others have performed GWASs of gout by comparing the genetic differences between gout cases and normouricaemia controls24–26 and have identified gout risk loci such as ABCG2 and SLC2A9: these are similar results to those from GWASs of SUA. Not all hyperuricaemia cases develop gout: the reason, we consider, is that there are at least two steps by which normouricaemic individuals develop gout. In the first step, the SUA of normouricaemic individuals elevates, creating asymptomatic hyperuricaemia (AHUA); and in the second step, MSU crystal-induced inflammation is experienced as a gout attack (figure 1). Urate transporters such as ABCG2, 4 5 27 SLC2A9, 28 SLC22A12 29 30 and SLC17A1 31 naturally play important roles in the first step, but there must be other loci for the second step that aggravates AHUA into a gout attack. In this study, for the first time, we performed a gout GWAS using clinically defined gout cases and AHUA controls to identify risk loci that uniquely influence the progression from AHUA to gout, as distinct from causing SUA elevation.
Figure 1.

Two steps in the development of gout. We performed, for the first time, a GWAS using clinically defined gout cases and AHUA controls to identify gout loci that influence the progression from hyperuricaemia to gout (the second step). Previous GWASs on gout were performed with gout cases and normouricaemics of which both SUA elevation (the first step) and the second step consisted; however, most of their identified loci were associated with the first step. Because only a proportion of AHUA individuals are known to develop gout, we hypothesised that the genetic effects at the second step would play important roles in crystal-induced inflammation as gout attack. AHUA, asymptomatic hyperuricaemia; GWAS, genome-wide association study; SUA, serum uric acid.
Methods
Study subjects
In the present study, we avoided the use of self-reported gout cases and AHUA controls and collected only clinically defined individuals.
All gout cases were clinically diagnosed with primary gout according to the criteria established by the American College of Rheumatology.32 All patients were assigned from Japanese male outpatients at the gout clinics of Midorigaoka Hospital (Osaka, Japan), Kyoto Industrial Health Association (Kyoto, Japan), Ryougoku East Gate Clinic (Tokyo, Japan), Nagase Clinic (Tokyo, Japan), Akasaka Central Clinic (Tokyo, Japan) and Jikei University Hospital (Tokyo, Japan). Patients with inherited metabolic disorders, including Lesch-Nyhan syndrome, were excluded. Finally, 2860 Japanese male gout cases were registered as valid case participants. Of these, 945 cases for GWAS stage were the same patients as reported previously.24 25
As AHUA controls, 3149 individuals were assigned from among Japanese men with a high SUA level (>7.0 mg/dL) without a history of gout, who were obtained from BioBank Japan18 33 and the Shizuoka, Daiko, Fukuoka, Saga and Kagoshima areas in the Japan Multi-Institutional Collaborative Cohort Study.34 35 The details of participants in this study are shown in the online supplementary table S1.
annrheumdis-2019-215521supp001.pdf (471.5KB, pdf)
Genotyping and quality control
Genome-wide genotyping was performed using Illumina HumanOmniExpress V.1.0 (Illumina) in 1948 individuals (945 cases and 1003 AHUA controls). The data sets were filtered individually on the basis of single nucleotide polymorphism (SNP) genotype missing call rates (>1%) and the Hardy-Weinberg equilibrium (HWE) in AHUA controls (p<1.0 × 10⁻⁶). We confirmed that all the subjects showed high genotype call rates (>98%). Pairwise identity by state was evaluated to identify pairs of individuals with cryptic relatedness.36 We confirmed that there was no pair showing cryptic relatedness greater than expected for second-degree relatives. We performed principal component analysis including our GWAS data set together with HapMap phase II samples37 38 as shown in the online supplementary figure S1, indicating that there are no outliers in our GWAS data. Finally, 569 200 SNPs passed filters for 1948 individuals (945 cases and 1003 controls).
At the first replication (REP1) stage, 1246 gout cases and 1186 AHUA controls were genotyped with a custom genotype platform using iSelect HD Custom Genotyping BeadChips (Illumina) on 897 SNPs, and another 253 gout cases were genotyped with Illumina HumanOmniExpress-24 V.1.0 (Illumina). Selected were 897 SNPs using the following criteria: (1) 1000 SNPs were selected as they showed an association (p<0.001 with Fisher’s exact test) in the GWAS stage with gout cases and AHUA controls. (2) After 103 undesignable SNPs had been eliminated, 897 SNPs were selected as the custom genotype platform. For quality control, the data set was filtered individually on the basis of SNP genotype missing call rates (>1%). We excluded subjects with low genotype call rates (<98%). Quality controls for 253 gout cases genotyped with Illumina HumanOmniExpress-24 V.1.0 (Illumina) were performed as described previously.24 For REP1 stage, 885 SNPs passed filters for 2685 individuals (1499 cases and 1186 controls) as shown in figure 2.
Figure 2.

Study design of GWAS of gout cases and asymptomatic hyperuricaemia controls. We performed a GWAS followed by two replication studies (REP1 and REP2 stages) with 2860 Japanese male gout cases and 3149 AHUA controls. Meta-analysis identified two novel loci (CNTN5 and MIR302F) and a suggestive locus (ZNF724) at the genome-wide significance level. AHUA, asymptomatic hyperuricaemia; GWAS, genome-wide association study; REP1, the first replication; REP2, the second replication.
As the criteria at the second replication (REP2) stage, 68 SNPs passing the significance threshold at p<1.0×10⁻⁴ in the meta-analysis among the GWAS and REP1 stages were used for the subsequent analyses. In addition to SNPs which had already been reported for gout-associated loci (ABCG2, ALDH2 and SLC2A9), we detected top-ranked SNPs among closely located SNPs. We then examined the pairwise linkage disequilibrium (LD) between SNP showing the most significant association and other SNPs. As shown in figure 2, in addition to 3 SNPs of ABCG2, ALDH2 and SLC2A9, we finally selected 12 SNPs that were independent of each other at r2<0.3 (see online supplementary table S2) for the REP2 stage.
The genotyping for 12 SNPs was performed using an allelic discrimination assay (Custom TaqMan Assay and By-Design, Thermo Fisher Scientific, Waltham, Massachusetts) with a LightCycler 480 (Roche Diagnostics, Mannheim, Germany).39 We confirmed that all 12 SNPs were of high call rate (>98%) and HWE in AHUA controls (p>0.001). After quality control, a statistical analysis was performed with 1376 individuals (416 gout cases and 960 AHUA controls). The details of participants in this study are shown in online supplementary table S1.
Comparison with previous GWAS
The ORs and 95% CIs of gout GWAS with AHUA controls were calculated by meta-analysis with GWAS and REP1 stages in this study, and those of gout GWAS with normouricaemic controls were obtained from our previous study.25
Statistical analysis
We conducted an association analysis using a 2×2 contingency table based on the allele frequency. For each of the filtered SNPs, the p value of association was assessed using Fisher’s exact test, and the OR and 95% CI were calculated. The quantile-quantile plot and the genomic inflation factor (λ) were used to test for the presence of systematic bias in the test statistics due to potential population stratification. The genomic inflation factor (λ) was 1.013, indicating a subtle inflation of p values (see online supplementary figure S2). The results from GWAS, in the first and second replication stages, were combined by meta-analysis.40 Inverse-variance fixed-effects model meta-analysis was used for estimating summary OR. Cochran’s Q test41 and the I2 statistic42 43 were examined to assess heterogeneity in ORs among the three studies. If heterogeneity was revealed by statistical testing (phet<0.05) or measurement (I2 >50%), we implemented a DerSimonian and Laird random-effects model meta-analysis.44 All statistical analyses were performed using PLINK V.1.07 and the software R V.3.1.145 with GenABEL and meta packages. The genome-wide significance threshold was set at α=5.0×10⁻⁸ to reveal any evidence of a significant association.
Results
Association analyses
The participants for the GWAS stage were genotyped using HumanOmniExpress V.1.0 (Illumina). Nine hundred forty-five clinically defined gout cases and 1003 AHUA controls passed rigorous quality control filtering (figure 2 and online supplementary figures S1 and S2).
The REP1 stage was then carried out by genotyping 885 SNPs, which showed associations at p<1.0×10⁻³ in the GWAS stage, using a custom genotype platform that employed iSelect HD Custom Genotyping BeadChips (Illumina) in a further 1499 gout cases and 1186 AHUA controls. A meta-analysis was also conducted among the GWAS and REP1 stages (figure 2).
As a result, we identified three loci showing the associations at the genome-wide significance level (p<5.0×10⁻⁸): rs2728125 of ABCG2 (p=6.58×10⁻²⁰; OR=0.67), rs671 of ALDH2 (p=4.44×10⁻¹⁴; OR=0.68) and rs1014290 of SLC2A9 (p=2.29×10⁻⁹; OR=1.30; figures 3 and 4, table 1). Of these, the loci of ABCG2 and SLC2A9 were also detected in the previous GWAS of gout cases and normouricaemia controls.24 rs671 of ALDH2 was identified as a gout-associated SNP in a subsequent fine mapping study.46 The present study therefore identified rs671 of ALDH2 as a gout locus by GWAS for the first time.
Figure 3.
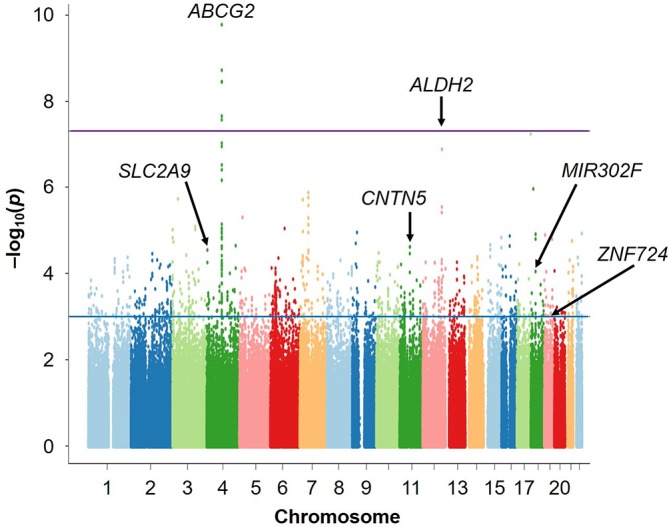
Manhattan plots of the present GWAS (Gout vs AHUA). The x-axis shows chromosomal positions and the y-axis shows −log10 p values. The upper purple horizontal line represents the genome-wide significance threshold (p=5.0×10⁻⁸). The lower blue line indicates the cut-off level for selecting SNPs for REP1 stage (p=1.0×10⁻³). The gene names of identified loci are also shown in the figure. AHUA, asymptomatic hyperuricaemia; GWAS, genome-wide association study; REP1, the first replication; SUA, serum uric acid.
Figure 4.

Regional association plots for the six loci identified in the present GWAS (gout vs AHUA). The vertical axis represents -log10 (p value) for assessment of the association of each SNP with gout. The highest association signal in each panel is located on (A) CNTN5, (B) MIR302F as novel loci and (C) ZNF724 as a suggestive locus and (D) ABCG2, (E) ALDH2 and (F) SLC2A9 as known loci. The region within 250 kb from the SNP indicating the lowest p value is shown. Top panel: plots of −log10 p values for the test of SNP association with gout in the GWAS stage. The SNP showing the lowest p value in the meta-analysis is depicted as a pink diamond. Other SNPs are colour coded according to the extent of linkage disequilibrium (measured in r2) with the SNP showing the lowest p value. Middle panel: recombination rates (centimorgans per MB) estimated from HapMap phase II data are plotted. Bottom panel: RefSeq genes. Genomic coordinates are based on NCBI human genome reference sequence build 37. Details of the results for the six loci are also shown in table 1. AHUA, asymptomatic hyperuricaemia; GWAS, genome-wide association study; NCBI, National Center for Biotechnology Information; SNP, single nucleotide polymorphism.
Table 1.
Five SNPs showing significant association at the genome-wide significance level and one suggestive SNP
| Allele* | GWAS stage‡ | REP1 stage§ | REP2 stage¶ | Meta-analysis** | ||||||||||||||||||
| Risk allele frequency | Risk allele frequency | Risk allele frequency | Fixed-effect model | Random-effect model | Cochran's Q | |||||||||||||||||
| SNP | A/B | Chr | Position† | Gene | Case | Control | OR (95% CI) | P value | Case | Control | OR (95% CI) | P value | Case | Control | OR (95% CI) | P value | OR (95% CI) | P value | OR (95% CI) | P value | P value | I 2 |
| rs2728125 | G/A | 4 | 89 001 893 | ABCG2 | 0.401 | 0.304 | 1.54 (1.35 to 1.76) | 1.76×10⁻¹⁰ | 0.400 | 0.313 | 1.46 (1.31 to 1.64) | 5.33×10⁻¹¹ | NA | NA | NA | NA | 1.49 (1.37 to 1.63) | 6.58×10⁻²⁰ | 1.49 (1.37 to 1.63) | 6.58×10⁻²⁰ | 0.57 | 0 |
| rs671 | C/T | 12 | 112 241 766 | ALDH2 | 0.821 | 0.751 | 1.52 (1.30 to 1.77) | 1.33×10⁻⁷ | 0.821 | 0.760 | 1.44 (1.26 to 1.65) | 5.94×10⁻⁸ | NA | NA | NA | NA | 1.47 (1.33 to 1.63) | 4.44×10⁻¹⁴ | 1.47 (1.33 to 1.63) | 4.44×10⁻¹⁴ | 0.62 | 0 |
| rs1014290 | T/C | 4 | 10 001 861 | SLC2A9 | 0.678 | 0.623 | 1.28 (1.12 to 1.46) | 2.75×10⁻⁴ | 0.674 | 0.611 | 1.31 (1.17 to 1.47) | 2.03×10⁻⁶ | NA | NA | NA | NA | 1.30 (1.19 to1.41) | 2.29×10⁻⁹ | 1.30 (1.19 to 1.41) | 2.29×10⁻⁹ | 0.76 | 0 |
| rs7927466 | A/G | 11 | 100 141 763 | CNTN5 | 0.976 | 0.953 | 1.99 (1.39 to 2.85) | 1.59×10⁻⁴ | 0.973 | 0.954 | 1.74 (1.30 to 2.33) | 2.29×10⁻⁴ | 0.976 | 0.954 | 1.91 (1.16 to 3.12) | 1.03×10⁻² | 1.85 (1.50 to 2.27) | 5.33×10⁻⁹ | 1.85 (1.50 to 2.27) | 5.33×10⁻⁹ | 0.84 | 0 |
| rs9952962 | C/T | 18 | 27 535 568 | MIR302F | 0.549 | 0.486 | 1.29 (1.14 to 1.46) | 8.07×10⁻⁵ | 0.547 | 0.506 | 1.18 (1.06 to 1.31) | 2.97×10⁻³ | 0.552 | 0.490 | 1.28 (1.09 to 1.51) | 2.92×10⁻³ | 1.24 (1.15 to 1.33) | 1.67×10⁻⁸ | 1.24 (1.15 to 1.33) | 1.67×10⁻⁸ | 0.50 | 0 |
| rs12980365 | A/G | 19 | 23 395 317 | ZNF724 | 0.976 | 0.957 | 1.84 (1.27 to 2.65) | 1.12×10⁻³ | 0.974 | 0.959 | 1.61 (1.19 to 2.18) | 1.97×10⁻³ | 0.975 | 0.948 | 2.09 (1.29 to 3.36) | 2.58×10⁻³ | 1.77 (1.43 to 2.18) | 9.76×10⁻⁸ | 1.77 (1.43 to 2.18) | 9.76×10⁻⁸ | 0.65 | 0 |
*Allele A is risk-associated allele, and allele B is non-risk-associated allele.
†SNP positions are based on NCBI human genome reference sequence Build 37.4.
‡945 gout cases and 1003 AHUA controls.
§1499 gout cases and 1186 AHUA controls.
¶416 gout cases and 960 AHUA controls.
**Meta-analyses of the combined GWAS and replication samples (2860 gout cases and 3149 controls of Japanese men).
AHUA, asymptomatic hyperuricaemia; Chr, Chromosome; GWAS, genome-wide association study;NCBI, National Center for Biotechnology Information; REP1, the first replication; REP2, the second replication;SNP, single nucleotide polymorphism.
To identify additional risk loci, we recruited independent participants comprising 416 gout cases and 960 AHUA controls. Twelve SNPs were selected for the REP2 stage by considering LD among 68 SNPs showing associations at p<1.0×10⁻⁴ in the meta-analysis among the GWAS and REP1 stages. Genotyping of these 12 SNPs was performed by TaqMan assay, and the meta-analysis was conducted among the GWAS, REP1 and REP2 stages (figure 2). Online supplementary tables S2A and S2B summarise the GWAS and replication study of three SNPs which have been reported to have gout-associated loci (ABCG2, ALDH2 and SLC2A9) and the 12 SNPs selected for the REP2 stage.
Finally, two novel loci achieved genome-wide significance in the meta-analysis of three stages (figures 3 and 4, table 1): an intronic SNP of CNTN5, rs7927466 (pmeta=5.33×10⁻⁹; OR=1.85) and an intergenic SNP located on near MIR302F, rs9952962 (pmeta=1.67×10⁻⁸; OR=0.81). In addition, an intergenic SNP nearing ZNF724 (rs12980365) showed a suggestive level of association (pmeta=9.76×10⁻⁸; OR=1.77).
Comparison with previous GWASs
We investigated whether or not these identified risk loci are associated with gout susceptibility via SUA elevation (the first step in figure 1). We compared the ORs for each locus in the present GWAS (gout vs AHUA) with those in the previous GWAS25 (gout vs normouricaemia): that is, the 3 loci identified in this study (‘AHUA to gout’ loci; CNTN5, MIR302F and ZNF724) and 10 previously identified risk loci25 (‘normouricaemia to gout’ loci; ABCG2, SLC2A9, CUX2, SLC22A12, GCKR, SLC17A1, HIST1H2BF-HIST1H4E, CNIH-2, NIPAL1 and FAM35A) (figure 5 and online supplementary table S3). Interestingly, when plotted, the ‘AHUA to gout’ loci and ‘normouricaemia to gout’ loci appeared as distinct patterns (figure 5). The ‘normouricaemia to gout’ loci trended under the oblique line, whereas all three ‘AHUA to gout’ loci were located above the oblique line, clearly indicating that these novel loci are associated with distinct mechanisms of gout development that differs from those of 10 known gout loci (see online supplementary table S3).25 It is consistent with the finding that ‘the ratio of the two ORs’ of each locus in the present GWAS (gout vs AHUA) is >1, whereas that of each locus in the previous GWAS (gout vs normouricaemia) is <1 (see online supplementary table S3).25 We also investigated the effect of each locus on SUA using the results from our recent GWAS meta-analysis of SUA with a total of 121 745 Japanese subjects47 and the results from GWAS meta-analysis of SUA with a total of 110 347 individuals of European ancestry within the Global Urate Genetics Consortium (GUGC).22 The association results for each locus are shown in online supplementary table S4. Both results are consistent with those of the present study (shown in figure 5). Furthermore, we also investigated the association results for three gout locus identified in the present GWAS from the result of the gout GWAS (gout vs non-gout) using a total of 69 374 individuals (2115 gout cases and 67 259 controls) of European ancestry within GUGC (see online supplementary table S5).22 The two SNPs that were polymorphic in European populations were evaluated. After Bonferroni correction (p<2.5×10–2=0.05/2), rs12980365 of ZNF724 showed a significant association with gout in persons of European ancestry (p=8.54 × 10⁻³, online supplementary table S5).
Figure 5.
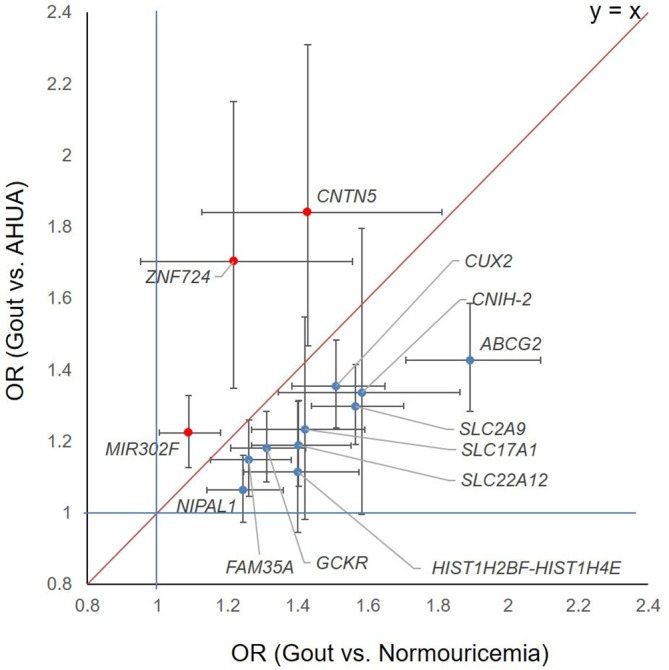
Comparison ORs for three gout loci by the present GWAS (gout vs AHUA) with ORs for 10 gout loci by the previous GWAS (gout vs normouricaemia). Dots represent ORs and lines represent 95% CIs. The horizontal axis shows ORs for gout compared with normouricaemia, and the vertical axis shows ORs for gout compared with AHUA, whereas 10 ’normouricaemia to gout’ loci are located under the oblique line, three novel ‘AHUA to gout’ loci are above it. AHUA, asymptomatic hyperuricaemia; GWAS, genome-wide association study.
Discussion
It is well known that gout has stronger genetic contributors than other common diseases, and that only a proportion of AHUA individuals develop gout, but no studies have hitherto reported the differences in genetic background between gout and AHUA. Through the present study, we first performed GWAS with gout cases and AHUA controls and identified two novel loci that have a stronger effect on the second step (AHUA to gout) in the development of gout. The present study detected the loci of ABCG2, SLC2A9 and ALDH2. One of them, rs671 of ALDH2, was identified as a gout locus by GWAS for the first time.
We have also discovered that rs7927466 of CNTN5 is a gout susceptibility locus. CNTN5 is a member of the contactin family, which mediates cell surface interactions during the development of the nervous system.48 49 There are several reports that CNTN5 is associated with neuropsychiatric disorders, such as autism spectrum disorder,50 51 attention deficit hyperactivity disorder52 and anorexia nervosa.53 Interestingly, CNTN5 has also been reported to be associated with inflammatory diseases including ankylosing spondylitis54 and Behçet disease.55 It has also been reported that another intronic SNP of CNTN5 (rs1813445) is associated with the response to anti-tumour necrosis factor therapy in rheumatoid arthritis56 and Crohn's disease.57 Since the present findings indicate that the SNPs of CNTN5 could be involved in the second step of gout development, it is assumed that CNTN5 polymorphisms could also cause inflammation at the joints where MSU crystals are deposited resulting from high SUA.
We also identified rs9952962, an SNP near MIR302F as a novel gout locus. MicroRNAs (miRNAs) were discovered in 199358: they are small non-coding RNA molecules which play an important role in regulating gene expression.59 It is reported that miR-302f is deregulated in gastric cancer60 and that chemotherapy modifies miR-302f expression in esophageal cancer.61 As several miRNAs have been identified as being involved in the pathogenesis of other non-infectious forms of inflammatory arthritis, including rheumatoid arthritis,62 63 some reports have also shown a relationship between miRNA and gouty arthritis.64–66 Our results might suggest that miR-302f affects the inflammation seen in gouty arthritis by modulating gene expression, although further analysis will be needed to elucidate the relationship between them.
We also identified rs12980365, an SNP of ZNF724, as a potential gout locus. However, there are no reports so far on ZNF724. It is of course possible that the identified loci in the present study are just surrogate markers and that other genes including ZNF730 and IPO5P1 near these SNPs are the true risk loci for gout development. The limitation is the lack of imputation because we applied the study design shown in figure 2. Further analysis of larger samples with imputation will be the key to identifying more gout loci.
The unique finding in the present study is that the novel loci for ‘AHUA to gout’ and known loci for ‘normouricaemia to gout’ appear to relate to different molecular mechanisms of gout development (figure 5 and online supplementary table S3). The ‘AHUA to gout’ loci identified in the present study appear to be involved in the second step of development from AHUA to gouty arthritis rather than the ‘normouricaemia to gout’ loci (figure 1). Since only a proportion of hyperuricaemia cases develop gout and most hyperuricaemia cases remain as AHUA cases, the molecules involved in this step are likely to play important roles in innate immunity and/or inflammation in response to MSU deposition.
The frequency of female gout cases is low (1.15% in our data) in Japan, which shows that analysing only male gout patients in the present study should be more appropriate for detecting genetic factors of gout. Because each locus identified in the present GWAS did not show a significant association with SUA in persons of European ancestry or in Japanese individuals (see online supplementary table S4), our findings show that they are not likely to be a locus that is associated with AHUA susceptibility. Interestingly, the present study also demonstrated that rs12980365 of ZNF724 showed a significant association with gout in persons of European ancestry within GUGC, which compared gout and non-gout individuals. This finding suggests that ZNF724 is a novel gout locus that aggravates AHUA into gout, also in individuals of European ancestry. However, since the GWAS within the GUGC was a study using non-gout individuals as controls, it is necessary to perform replication studies using AHUA as controls. Thus, further analyses of independent populations using AHUA controls will be required in the future (see online supplementary table S5).
This first discovery of ‘AHUA to gout’ loci using a new GWAS strategy will lead to elucidation of the molecular mechanism of the last step of gout development, which will clarify the individual genetic differences that explain why only a proportion of hyperuricaemia cases develop gout and to the prevention of gout attacks in high-risk AHUA individuals. These findings will assist physicians to identify AHUA cases who need adequate preemptive medicine for gout based on individual genetic differences.http://dx.doi.org/10.1136/annrheumdis-2019-215521
Acknowledgments
We would like to thank all the participants involved in this study. We are indebted to K Gotanda, M Miyazawa, Y Aoyagi, Y Aoki, K Maehara, M Kirihara, M Ishino and A Akashi (National Defense Medical College) for genetic analysis. We also thank S Ushida (Ikagaku), H Fujiwara (Midorigaoka Hospital) and N Hamajima (Nagoya University Graduate School of Medicine) for sample collection.
Footnotes
Handling editor: Josef S Smolen
YK, HN, AN, YO and KY contributed equally.
Correction notice: This article has been corrected since it published Online First. The section heading has been changed.
Contributors: H Nakaoka, KY, M Kubo, II, NS and H Matsuo conceived and designed this study. Y Kawamura, AN, YO, MS, M Nakatochi, Y Kamatani and AT assisted with research design. T Shimizu, HO, K Ooyama, M Nagase, YH, T Hosoya, KI and H Matsuo collected and analysed the clinical data of the cases. YO, YN, IS, AH, MH, RI, M Naito, KT, T Takezaki, KW, K Ohnaka, Y Kamatani, AT and M Kubo collected and analysed clinical data of controls. Y Kawamura, AN, KY, T Higashino, MS, YS, SS, M Kawaguchi, MT, M Nakajima, NS and H Matsuo performed genetics analysis. H Nakaoka, YO, MS, H Nakashima, TN, M Nakatochi, AT and II performed statistical analysis. Y Kawamura, AN, YO, T Higashino and H Matsuo analysed the data. H Matsuo organised this collaborative study. H Nakaoka, KY, T Higashino, KH, SK, HU, S Iwasawa, BS, TR, M Nakatochi, S Ichihara, MY, T Takada, T Saitoh, KA, KI, II and NS provided intellectual input and assisted with the preparation of the manuscript. Y Kawamura, H Nakaoka, AN, MS and H Matsuo wrote the manuscript.
Funding: The present study was supported by grants from the Ministry of Education, Culture, Sports, Science and Technology (MEXT) of Japan including KAKENHI grants (nos. 25293145, 221S0002, 16H06279 and 15K15227); the Ministry of Health, Labor and Welfare of Japan; the Ministry of Defense of Japan; the Japan Society for the Promotion of Science (JSPS); the Kawano Masanori Memorial Foundation for Promotion of Pediatrics and the Gout Research Foundation of Japan. The Japan Multi-Institutional Collaborative Cohort Study was supported by Grants-in-Aid for Scientific Research from MEXT, including those for Priority Areas of Cancer (no. 17015018) and Innovative Areas (no. 221S0001), as well as by a JSPS KAKENHI grant (no. 16H06277). This study was supported in part by funding from the BioBank Japan Project from the Japan Agency for Medical Research and Development, and the Ministry of Education, Culture, Sports, Science and Technology.
Competing interests: None declared.
Patient consent for publication: Obtained.
Ethics approval: This study was approved by the Institutional Ethical Committees (National Defense Medical College and Nagoya University). Written consent was obtained from all of its participants. All procedures involved in this study were performed in accordance with the Declaration of Helsinki.
Provenance and peer review: Not commissioned; externally peer reviewed.
Data availability statement: No additional data are available.
References
- 1. Roddy E, Mallen CD, Doherty M. Gout. BMJ 2013;347:f5648 10.1136/bmj.f5648 [DOI] [PubMed] [Google Scholar]
- 2. Ichida K, Matsuo H, Takada T, et al. Decreased extra-renal urate excretion is a common cause of hyperuricemia. Nat Commun 2012;3:764 10.1038/ncomms1756 [DOI] [PMC free article] [PubMed] [Google Scholar]
- 3. Matsuo H, Tsunoda T, Ooyama K, et al. Hyperuricemia in acute gastroenteritis is caused by decreased urate excretion via ABCG2. Sci Rep 2016;6:31003 10.1038/srep31003 [DOI] [PMC free article] [PubMed] [Google Scholar]
- 4. Matsuo H, Takada T, Ichida K, et al. Common defects of ABCG2, a high-capacity urate exporter, cause gout: a function-based genetic analysis in a Japanese population. Sci Transl Med 2009;1:5ra11 10.1126/scitranslmed.3000237 [DOI] [PubMed] [Google Scholar]
- 5. Woodward OM, Köttgen A, Coresh J, et al. Identification of a urate transporter, ABCG2, with a common functional polymorphism causing gout. Proc Natl Acad Sci U S A 2009;106:10338–42. 10.1073/pnas.0901249106 [DOI] [PMC free article] [PubMed] [Google Scholar]
- 6. Matsuo H, Ichida K, Takada T, et al. Common dysfunctional variants in ABCG2 are a major cause of early-onset gout. Sci Rep 2013;3:2014 10.1038/srep02014 [DOI] [PMC free article] [PubMed] [Google Scholar]
- 7. Williams PT. Effects of diet, physical activity and performance, and body weight on incident gout in ostensibly healthy, vigorously active men. Am J Clin Nutr 2008;87:1480–7. 10.1093/ajcn/87.5.1480 [DOI] [PMC free article] [PubMed] [Google Scholar]
- 8. Choi HK, Atkinson K, Karlson EW, et al. Alcohol intake and risk of incident gout in men: a prospective study. Lancet 2004;363:1277–81. 10.1016/S0140-6736(04)16000-5 [DOI] [PubMed] [Google Scholar]
- 9. Mikuls TR, Farrar JT, Bilker WB, et al. Gout epidemiology: results from the UK general practice research database, 1990-1999. Ann Rheum Dis 2005;64:267–72. 10.1136/ard.2004.024091 [DOI] [PMC free article] [PubMed] [Google Scholar]
- 10. Nakayama A, Matsuo H, Nakaoka H, et al. Common dysfunctional variants of ABCG2 have stronger impact on hyperuricemia progression than typical environmental risk factors. Sci Rep 2014;4:5227 10.1038/srep05227 [DOI] [PMC free article] [PubMed] [Google Scholar]
- 11. Dalbeth N, Merriman TR, Stamp LK. Gout. Lancet 2016;388:2039–52. 10.1016/S0140-6736(16)00346-9 [DOI] [PubMed] [Google Scholar]
- 12. Li S, Sanna S, Maschio A, et al. The GLUT9 gene is associated with serum uric acid levels in Sardinia and Chianti cohorts. PLoS Genet 2007;3:e194 10.1371/journal.pgen.0030194 [DOI] [PMC free article] [PubMed] [Google Scholar]
- 13. Döring A, Gieger C, Mehta D, et al. SLC2A9 influences uric acid concentrations with pronounced sex-specific effects. Nat Genet 2008;40:430–6. 10.1038/ng.107 [DOI] [PubMed] [Google Scholar]
- 14. Vitart V, Rudan I, Hayward C, et al. SLC2A9 is a newly identified urate transporter influencing serum urate concentration, urate excretion and gout. Nat Genet 2008;40:437–42. 10.1038/ng.106 [DOI] [PubMed] [Google Scholar]
- 15. McArdle PF, Parsa A, Chang Y-PC, et al. Association of a common nonsynonymous variant in GLUT9 with serum uric acid levels in old order Amish. Arthritis Rheum 2008;58:2874–81. 10.1002/art.23752 [DOI] [PMC free article] [PubMed] [Google Scholar]
- 16. Dehghan A, Köttgen A, Yang Q, et al. Association of three genetic loci with uric acid concentration and risk of gout: a genome-wide association study. Lancet 2008;372:1953–61. 10.1016/S0140-6736(08)61343-4 [DOI] [PMC free article] [PubMed] [Google Scholar]
- 17. Kolz M, Johnson T, Sanna S, et al. Meta-analysis of 28,141 individuals identifies common variants within five new loci that influence uric acid concentrations. PLoS Genet 2009;5:e1000504 10.1371/journal.pgen.1000504 [DOI] [PMC free article] [PubMed] [Google Scholar]
- 18. Kamatani Y, Matsuda K, Okada Y, et al. Genome-wide association study of hematological and biochemical traits in a Japanese population. Nat Genet 2010;42:210–5. 10.1038/ng.531 [DOI] [PubMed] [Google Scholar]
- 19. Yang Q, Köttgen A, Dehghan A, et al. Multiple genetic loci influence serum urate levels and their relationship with gout and cardiovascular disease risk factors. Circ Cardiovasc Genet 2010;3:523–30. 10.1161/CIRCGENETICS.109.934455 [DOI] [PMC free article] [PubMed] [Google Scholar]
- 20. Tin A, Woodward OM, Kao WHL, et al. Genome-wide association study for serum urate concentrations and gout among African Americans identifies genomic risk loci and a novel URAT1 loss-of-function allele. Hum Mol Genet 2011;20:4056–68. 10.1093/hmg/ddr307 [DOI] [PMC free article] [PubMed] [Google Scholar]
- 21. Sulem P, Gudbjartsson DF, Walters GB, et al. Identification of low-frequency variants associated with gout and serum uric acid levels. Nat Genet 2011;43:1127–30. 10.1038/ng.972 [DOI] [PubMed] [Google Scholar]
- 22. Köttgen A, Albrecht E, Teumer A, et al. Genome-wide association analyses identify 18 new loci associated with serum urate concentrations. Nat Genet 2013;45:145–54. 10.1038/ng.2500 [DOI] [PMC free article] [PubMed] [Google Scholar]
- 23. Okada Y, Sim X, Go MJ, et al. Meta-analysis identifies multiple loci associated with kidney function-related traits in east Asian populations. Nat Genet 2012;44:904–9. 10.1038/ng.2352 [DOI] [PMC free article] [PubMed] [Google Scholar]
- 24. Matsuo H, Yamamoto K, Nakaoka H, et al. Genome-wide association study of clinically defined gout identifies multiple risk loci and its association with clinical subtypes. Ann Rheum Dis 2016;75:652–9. 10.1136/annrheumdis-2014-206191 [DOI] [PMC free article] [PubMed] [Google Scholar]
- 25. Nakayama A, Nakaoka H, Yamamoto K, et al. GWAS of clinically defined gout and subtypes identifies multiple susceptibility loci that include urate transporter genes. Ann Rheum Dis 2017;76:869–77. 10.1136/annrheumdis-2016-209632 [DOI] [PMC free article] [PubMed] [Google Scholar]
- 26. Li C, Li Z, Liu S, et al. Genome-wide association analysis identifies three new risk loci for gout arthritis in Han Chinese. Nat Commun 2015;6:7041 10.1038/ncomms8041 [DOI] [PMC free article] [PubMed] [Google Scholar]
- 27. Higashino T, Takada T, Nakaoka H, et al. Multiple common and rare variants of ABCG2 cause gout. RMD Open 2017;3:e000464 10.1136/rmdopen-2017-000464 [DOI] [PMC free article] [PubMed] [Google Scholar]
- 28. Matsuo H, Chiba T, Nagamori S, et al. Mutations in glucose transporter 9 gene SLC2A9 cause renal hypouricemia. Am J Hum Genet 2008;83:744–51. 10.1016/j.ajhg.2008.11.001 [DOI] [PMC free article] [PubMed] [Google Scholar]
- 29. Enomoto A, Kimura H, Chairoungdua A, et al. Molecular identification of a renal urate anion exchanger that regulates blood urate levels. Nature 2002;417:447–52. 10.1038/nature742 [DOI] [PubMed] [Google Scholar]
- 30. Sakiyama M, Matsuo H, Shimizu S, et al. The effects of URAT1/SLC22A12 nonfunctional variants, R90H and W258X, on serum uric acid levels and gout/hyperuricemia progression. Sci Rep 2016;6:20148 10.1038/srep20148 [DOI] [PMC free article] [PubMed] [Google Scholar]
- 31. Chiba T, Matsuo H, Kawamura Y, et al. NPT1/SLC17A1 is a renal urate exporter in humans and its common gain-of-function variant decreases the risk of renal underexcretion gout. Arthritis Rheumatol 2015;67:281–7. 10.1002/art.38884 [DOI] [PubMed] [Google Scholar]
- 32. Wallace SL, Robinson H, Masi AT, et al. Preliminary criteria for the classification of the acute arthritis of primary gout. Arthritis Rheum 1977;20:895–900. 10.1002/art.1780200320 [DOI] [PubMed] [Google Scholar]
- 33. Nakamura T, Shi D, Tzetis M, et al. Meta-analysis of association between the ASPN D-repeat and osteoarthritis. Hum Mol Genet 2007;16:1676–81. 10.1093/hmg/ddm115 [DOI] [PubMed] [Google Scholar]
- 34. Hamajima N, J-MICC Study Group . The Japan Multi-Institutional Collaborative Cohort Study (J-MICC study) to detect gene-environment interactions for cancer. Asian Pac J Cancer Prev 2007;8:317–23. [PubMed] [Google Scholar]
- 35. Wakai K, Hamajima N, Okada R, et al. Profile of participants and genotype distributions of 108 polymorphisms in a cross-sectional study of associations of genotypes with lifestyle and clinical factors: a project in the Japan Multi-Institutional Collaborative Cohort (J-MICC) Study. J Epidemiol 2011;21:223–35. 10.2188/jea.JE20100139 [DOI] [PMC free article] [PubMed] [Google Scholar]
- 36. Purcell S, Neale B, Todd-Brown K, et al. PLINK: a tool set for whole-genome association and population-based linkage analyses. Am J Hum Genet 2007;81:559–75. 10.1086/519795 [DOI] [PMC free article] [PubMed] [Google Scholar]
- 37. Patterson N, Price AL, Reich D. Population structure and eigenanalysis. PLoS Genet 2006;2:e190 10.1371/journal.pgen.0020190 [DOI] [PMC free article] [PubMed] [Google Scholar]
- 38. Price AL, Patterson NJ, Plenge RM, et al. Principal components analysis corrects for stratification in genome-wide association studies. Nat Genet 2006;38:904–9. 10.1038/ng1847 [DOI] [PubMed] [Google Scholar]
- 39. Sakiyama M, Matsuo H, Akashi A, et al. Independent effects of ADH1B and ALDH2 common dysfunctional variants on gout risk. Sci Rep 2017;7:2500 10.1038/s41598-017-02528-z [DOI] [PMC free article] [PubMed] [Google Scholar]
- 40. Nakaoka H, Inoue I. Meta-analysis of genetic association studies: methodologies, between-study heterogeneity and winner's curse. J Hum Genet 2009;54:615–23. 10.1038/jhg.2009.95 [DOI] [PubMed] [Google Scholar]
- 41. Cochran WG. The combination of estimates from different experiments. Biometrics 1954;10:101–29. 10.2307/3001666 [DOI] [Google Scholar]
- 42. Higgins JPT, Thompson SG. Quantifying heterogeneity in a meta-analysis. Stat Med 2002;21:1539–58. 10.1002/sim.1186 [DOI] [PubMed] [Google Scholar]
- 43. Higgins JPT, Thompson SG, Deeks JJ, et al. Measuring inconsistency in meta-analyses. BMJ 2003;327:557–60. 10.1136/bmj.327.7414.557 [DOI] [PMC free article] [PubMed] [Google Scholar]
- 44. DerSimonian R, Laird N. Meta-analysis in clinical trials. Control Clin Trials 1986;7:177–88. 10.1016/0197-2456(86)90046-2 [DOI] [PubMed] [Google Scholar]
- 45. R Development Core Team R: A Language and Environment for Statistical Computing. Vienna: R. Foundation for Statistical Computing, 2006. [Google Scholar]
- 46. Sakiyama M, Matsuo H, Nakaoka H, et al. Identification of rs671, a common variant of ALDH2, as a gout susceptibility locus. Sci Rep 2016;6:25360 10.1038/srep25360 [DOI] [PMC free article] [PubMed] [Google Scholar]
- 47. Nakatochi M, Kanai M, Nakayama A, et al. Genome-wide meta-analysis identifies multiple novel loci associated with serum uric acid levels in Japanese individuals. Commun Biol 2019;2:115 10.1038/s42003-019-0339-0 [DOI] [PMC free article] [PubMed] [Google Scholar]
- 48. Ogawa J, Kaneko H, Masuda T, et al. Novel neural adhesion molecules in the Contactin/F3 subgroup of the immunoglobulin superfamily: isolation and characterization of cDNAs from rat brain. Neurosci Lett 1996;218:173–6. 10.1016/S0304-3940(96)13156-6 [DOI] [PubMed] [Google Scholar]
- 49. Shimoda Y, Watanabe K. Contactins: emerging key roles in the development and function of the nervous system. Cell Adh Migr 2009;3:64–70. 10.4161/cam.3.1.7764 [DOI] [PMC free article] [PubMed] [Google Scholar]
- 50. Poot M. A candidate gene association study further corroborates involvement of contactin genes in autism. Mol Syndromol 2014;5:229–35. 10.1159/000362891 [DOI] [PMC free article] [PubMed] [Google Scholar]
- 51. van Daalen E, Kemner C, Verbeek NE, et al. Social responsiveness Scale-aided analysis of the clinical impact of copy number variations in autism. Neurogenetics 2011;12:315–23. 10.1007/s10048-011-0297-2 [DOI] [PMC free article] [PubMed] [Google Scholar]
- 52. Lionel AC, Crosbie J, Barbosa N, et al. Rare copy number variation discovery and cross-disorder comparisons identify risk genes for ADHD. Sci Transl Med 2011;3:95ra75 10.1126/scitranslmed.3002464 [DOI] [PubMed] [Google Scholar]
- 53. Nakabayashi K, Komaki G, Tajima A, et al. Identification of novel candidate loci for anorexia nervosa at 1q41 and 11q22 in Japanese by a genome-wide association analysis with microsatellite markers. J Hum Genet 2009;54:531–7. 10.1038/jhg.2009.74 [DOI] [PubMed] [Google Scholar]
- 54. Jung S-H, Yim S-H, Hu H-J, et al. Genome-wide copy number variation analysis identifies deletion variants associated with ankylosing spondylitis. Arthritis Rheumatol 2014;66:2103–12. 10.1002/art.38650 [DOI] [PubMed] [Google Scholar]
- 55. Ortiz-Fernández L, Carmona F-D, Montes-Cano M-A, et al. Genetic analysis with the immunochip platform in Behçet disease. Identification of residues associated in the HLA class I region and new susceptibility loci. PLoS One 2016;11:e0161305 10.1371/journal.pone.0161305 [DOI] [PMC free article] [PubMed] [Google Scholar]
- 56. Umiċeviċ Mirkov M, Cui J, Vermeulen SH, et al. Genome-wide association analysis of anti-TNF drug response in patients with rheumatoid arthritis. Ann Rheum Dis 2013;72:1375–81. 10.1136/annrheumdis-2012-202405 [DOI] [PMC free article] [PubMed] [Google Scholar]
- 57. Thomas D, Gazouli M, Karantanos T, et al. Association of rs1568885, rs1813443 and rs4411591 polymorphisms with anti-TNF medication response in Greek patients with Crohn's disease. World J Gastroenterol 2014;20:3609–14. 10.3748/wjg.v20.i13.3609 [DOI] [PMC free article] [PubMed] [Google Scholar]
- 58. Lee RC, Feinbaum RL, Ambros V. The C. elegans heterochronic gene lin-4 encodes small RNAs with antisense complementarity to lin-14. Cell 1993;75:843–54. 10.1016/0092-8674(93)90529-Y [DOI] [PubMed] [Google Scholar]
- 59. Krol J, Loedige I, Filipowicz W. The widespread regulation of microRNA biogenesis, function and decay. Nat Rev Genet 2010;11:597–610. 10.1038/nrg2843 [DOI] [PubMed] [Google Scholar]
- 60. Yao Y, Suo A-L, Li Z-F, et al. MicroRNA profiling of human gastric cancer. Mol Med Rep 2009;2:963–70. 10.3892/mmr_00000199 [DOI] [PubMed] [Google Scholar]
- 61. Hummel R, Wang T, Watson DI, et al. Chemotherapy-induced modification of microRNA expression in esophageal cancer. Oncol Rep 2011;26:1011–7. 10.3892/or.2011.1381 [DOI] [PubMed] [Google Scholar]
- 62. Ceribelli A, Yao B, Dominguez-Gutierrez PR, et al. MicroRNAs in systemic rheumatic diseases. Arthritis Res Ther 2011;13:229 10.1186/ar3377 [DOI] [PMC free article] [PubMed] [Google Scholar]
- 63. Duroux-Richard I, Jorgensen C, Apparailly F. What do microRNAs mean for rheumatoid arthritis? Arthritis Rheum 2012;64:11–20. 10.1002/art.30651 [DOI] [PubMed] [Google Scholar]
- 64. Zhang Q-B, Qing Y-F, Yin C-C, et al. Mice with miR-146a deficiency develop severe gouty arthritis via dysregulation of TRAF 6, IRAK 1 and NALP3 inflammasome. Arthritis Res Ther 2018;20:45 10.1186/s13075-018-1546-7 [DOI] [PMC free article] [PubMed] [Google Scholar]
- 65. Zhou W, Wang Y, Wu R, et al. MicroRNA-488 and -920 regulate the production of proinflammatory cytokines in acute gouty arthritis. Arthritis Res Ther 2017;19:203 10.1186/s13075-017-1418-6 [DOI] [PMC free article] [PubMed] [Google Scholar]
- 66. Papanagnou P, Stivarou T, Tsironi M. The role of miRNAs in common inflammatory arthropathies: osteoarthritis and gouty arthritis. Biomolecules 2016;6:44 10.3390/biom6040044 [DOI] [PMC free article] [PubMed] [Google Scholar]
Associated Data
This section collects any data citations, data availability statements, or supplementary materials included in this article.
Supplementary Materials
annrheumdis-2019-215521supp001.pdf (471.5KB, pdf)