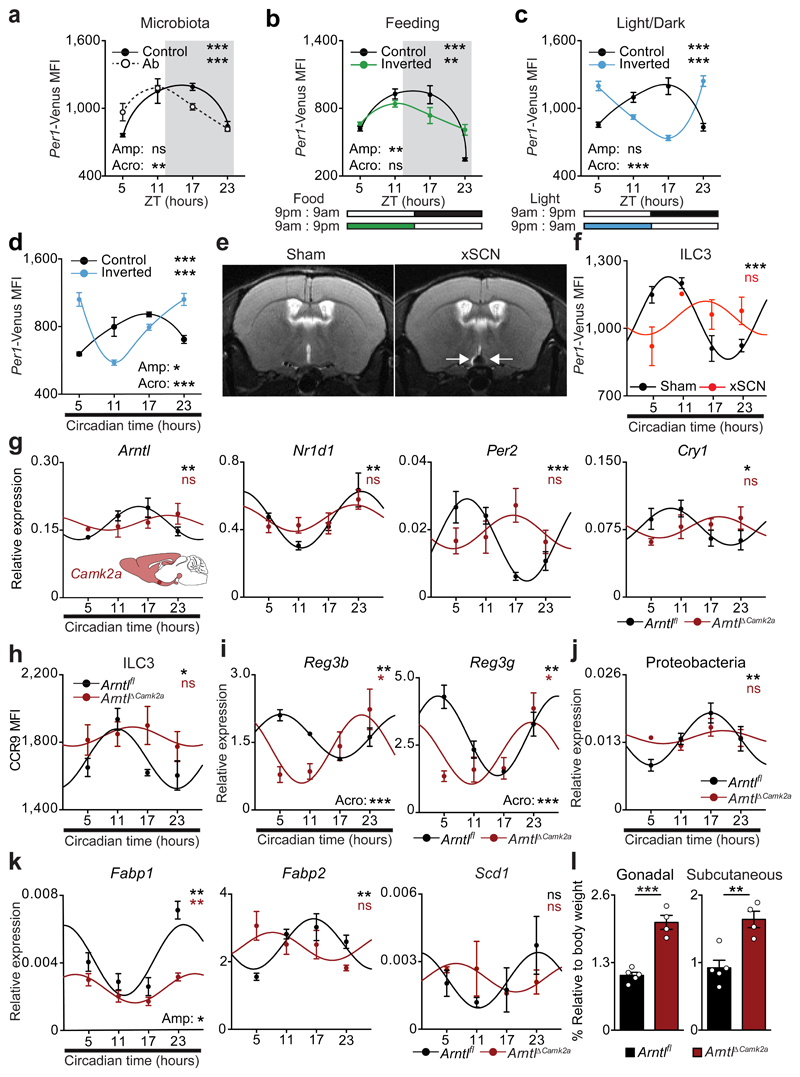
Figure 4. Light-entrained and brain-tuned cues shape intestinal ILC3.
a, Antibiotic treatment. Per1Venus in gut ILC3. n=3. b, Restricted and inverted feeding. Per1Venus in gut ILC3. n=3. c, Opposing light-dark cycles. Per1Venus in gut ILC3. n=3. d, Opposing light-dark cycles followed by constant darkness. Per1Venus in gut ILC3. n=3. e, Magnetic resonance imaging of sham and SCN ablated (xSCN) mice. n=11. f, g, Enteric ILC3. n=3. h, Gut ILC3. n=3. i, Epithelial reactivity genes. n=3. j, Proteobacteria. n=4. k, Epithelial lipid transporter genes. n=3. l, Adipose tissue. Arntlfl n=5, ArntlΔCamk2a n=4. (a,b) White/Grey: light/dark period. Mean and error bars: s.e.m.. (a-l) n represents biologically independent animals. (a-d;f-k) Cosinor analysis; (f-k) Cosine fitted curves; amplitude (Amp) and acrophase (Acro) were extracted from the Cosinor model. (l) two-tailed unpaired Student t-test. *P<0.05; **P<0.01; ***P<0.001; ns not significant.

