Abstract
Background: Mounting evidence has shown that long non-coding RNAs (lncRNAs) play critical regulation roles in the progression of various cancers. However, the biological role and clinical value of lncRNA FOXD2-AS1 in papillary thyroid cancer (PTC) remain to be elucidated. Methods: The expression of FOXD2-AS1 in PTC tissues and cell lines was evaluated by RT-qPCR and in situ hybridization. The association between FOXD2-AS1 expression levels and clinicopathologic features was analyzed through tissue microarray. The biological function of FOXD2-AS1 in PTC cells was determined both in vitro through CCK-8, EdU staining, colony formation and cell invasion assays and in vivo through a xenograft tumor model. Functional and pathway enrichment analysis were also conducted to analyze the molecular mechanism. Results: FOXD2-AS1 was significantly upregulated in PTC tissues, and high FOXD2-AS1 expression was positively associated with malignant potential factors in PTC patients. In addition, high level of FOXD2-AS1 expression was an unfavorable independent prognostic biomarker for patients with PTC. Moreover, we found that knockdown of FOXD2-AS1 could effectively inhibit PTC cell proliferation and invasion in vitro and suppress tumor growth of PTC in vivo. Bioinformatics analysis indicated that activation of cell cycle and apoptosis pathways might be involved in the oncogenic function of FOXD2-AS1 in PTC. Moreover, we demonstrated that FOXD2-AS1 directly interacted with miR-185-5p as miRNA sponge and overexpression of FOXD2-AS1 partially reversed the suppressive effect of miR-185-5p in TPC cells. Conclusion: Our findings suggest FOXD2-AS1 functions as an oncogene and promotes the tumor progression and metastasis in PTC, which might serve as a promising prognostic biomarker and potential therapeutic target for PTC patients.
Keywords: FOXD2-AS1, papillary thyroid cancer, metastasis, tumor progression, apoptosis
Introduction
Thyroid cancer (THCA) represents the most common endocrine malignancy occurring thyroid worldwide, especially in China [1]. The most common pathological type of thyroid cancer is papillary thyroid carcinoma (PTC), ranking more than 70% diagnosed thyroid cancer cases. To date, surgery, radiation and chemotherapy are the conventional therapeutic strategies for PTC [2]. Though treatments have been improved dramatically in recent years, high frequencies of recurrence and metastasis greatly impede the clinical prognosis of PTC patients and remain the major causes of PTC related death [3]. Nevertheless, the molecular and functional mechanisms underlying PTC progression are not fully understood.
Long non-coding RNAs (lncRNAs) are a class of linear transcripts with >200 nucleotides and regulate gene expression through multiple regulatory mechanisms [4]. Mounting evidence has shown that lncRNAs participate in diverse biological processes, including cancer development and metastasis [5,6]. Various lncRNAs have been identified as cancer-related lncRNAs in the tumorigenesis [7]. For instance, MALAT1 has been reported to be closely involved in the progression of multiple cancers [8-11]. HOTAIR exhibits pro-oncogenic function in various types of cancers [12]. Multiple lncRNAs, such as TUG1, PANDAR, SPRY4-IT and CRNDE are reported to play crucial roles in thyroid cancer [13-15].
LncRNA FOXD2-AS1, which locates in the chromosomal region of 1p33, is highly expressed in multiple carcinomas and is associated with poor prognosis of various cancers, including esophageal squamous cell carcinoma, colorectal cancer, lung cancer and bladder cancer [16-22]. However, whether lncRNA FOXDA-AS1 is involved in the thyroid cancer progression remains unclear.
Here, we first demonstrated that FOXD2-AS1 was upregulated in PTC tissues and cell lines. FOXD2-AS1 knockdown inhibited cell proliferation and invasion of PTC cells in vitro, as well as suppressed PTC tumor growth in vivo. Furthermore, high level of FOXD2-AS1 was an independent unfavorable prognostic biomarker for patients with PTC, which led to remarkably shorter overall survival (OS) rates compared to those in patients with low expression level of FOXD2-AS1. We revealed that activation of the cell cycle and apoptosis pathway was involved in the oncogenic function of FOXD2-AS1 in PTC. Moreover, we demonstrated that FOXD2-AS1 directly interacted with miR-185-5p and FOXD2-AS1/miR-185-5p axis regulated progression and metastasis of PTC. Our findings suggest that lncRNA FOXD2-AS1 might be served as a novel prognostic biomarker and potential therapeutic target in PTC.
Materials and methods
PTC specimens and cell lines
PTC specimens and surrounding non-tumorous tissues were obtained from PTC patients undergoing tumor resection at the department of thyroid surgery, The Affiliated Cancer Hospital of Zhengzhou University (Zhengzhou, China). All patients were informed with consent and completed follow-up data records. The study was approved by the research ethics committee of The Affiliated Cancer Hospital of Zhengzhou University and conducted in accordance with the Declaration of Helsinki Principles. Human PTC cell lines (BHP5-16, CGTH-W3, BCPAP, and TPC-1) and nonmalignant thyroid cell line Nthy-ori3-1 was purchased from the Cell Bank of Shanghai Institute of Cell Biology, and cultured in RPMI 1640 medium (Gibco, USA) supplemented with 10% fetal bovine serum (Clark, USA), 100 U/ml Penicillin, and 100 mg/ml Streptomycin at 37°C under 5% CO2 in a humidified incubator.
Bioinformatics analysis
The mRNA expression profiles and follow-up clinical information of thyroid cancer patients were obtained from public database The Cancer Genome Atlas (TCGA). The TCGA thyroid cancer cohort (hereafter referred to as TCGA-THCA cohort) contained 510 thyroid cancer tissues and 58 surrounding non-tumorous tissues. The raw data was processed and analyzed by BRB-array tools as described previously [23,24].
Quantitative real-time PCR and Western blot analysis
The Quantitative real-time PCR processes were carried out on ABI7300 real-time PCR system (Applied Biosystems, USA) as described previously [25]. GAPDH was used as internal control for lncRNA and mRNA, and Ct method (2-ΔΔCt) values were normalized to GAPDH levels. Western blot analysis was performed as described previously [25]. All the original western blot images were shown in Supplementary Figure 2.
Tissue microarray construction
160 papillary carcinoma specimens and 90 normal specimens were used for tissue microarray (TMA) construction. The process of TMA construction were performed as described previously [26].
In situ hybridization
In situ hybridization (ISH) was performed to detect FOXD2-AS1 expression in tissue microarrays using digoxigenin-labeled sense and antisense FOXD2-AS1 probes (BOSTER Biological, China) as described previously [27]. Briefly, slides were de-paraffined and rehydrated for 40 min, then FOXD2-AS1 probes were added for hybridization at 50°C for 1 h. Next, slides were washed and incubated with an antibody against digoxigenin (Roche, Germany) at 4°C overnight. The reaction was terminated by washing with water for 5 min. FOXD2-AS1 probe signal was counterstaining using DAB kit (BOSTER, China).
SiRNA/shRNA transfection
SiRNA or shRNA used to knockdown FOXD2-AS1 was designed and provided by Hanbio company (Shanghai, China). Briefly, cells were seeded into a 12-well plate at a density of 1 × 10⁵ cells/well. SiRNA or shRNA transfection was conducted using LipoFiter (Hanbio, China) according the manufacturer’s recommended process.
Cell proliferation assays
Cell viability was determined using Cell Counting kit-8 (CCK-8) (Dojindo, Japan). Briefly, Thyroid cancer cells were seeded into 96-well plates at a density of 5000 cells/well and then working reagent (10 μl per well) was added into each well at indicated time points. Absorbance at 490 nm was assessed using a microplate reader (Bio-Rad Laboratories, USA). For the colony formation assay, dispensed cells were seeded in 6-well plates and cultured for 15 days. The colonies were fixed and stained with crystal violet solution, and then calculated (defined as >50 cells).
5-ethynyl-20-deoxyuridine (EdU) staining assay
Cell division was evaluated using EdU Kit (RiboBio, China). Cells were seeded into 96-well plates at a density of 3000 cells/well and then 50 mM EdU solution was added to the medium. After 24 h, cells were fixed with 4% formaldehyde and permeabilized with Triton X-100. The processed cells were incubated with EDU reaction cocktail and counterstained with DAPI. The staining results were recorded under a fluorescence microscopy. Five randomly chosen fields were photographed and the numbers of EdU incorporated cells were calculated.
Cell invasion assay
Cell invasion was assessed using Matrigel-coated membranes (BD, USA) in 24-well dishes follow the manufacturers’ manual. Cells invaded through the membrane filter were fixed and stained with 0.5% crystal violet and then counted under a microscope.
Luciferase reporter assay
WT or mutated FOXD2-AS1 was cloned into luciferase reporter vector pGL3-Luc (Promega, USA). HEK293 cells were transfected with luciferase reporter vectors containing WT or mutated FOXD2-AS1 sequences, together with miR-185-5p mimics or negative control. Relative luciferase activity was measured 48 h later using a luciferases assay kit (Promega, USA) following the manufacturer’s protocol.
Xenograft tumor model
All animal studies were carried out with the approval of the The Affiliated Cancer Hospital of Zhengzhou University Animal Care and Use Committee. Male BALB/c nude mice (5-6 week old, 18-22 g weight) were obtained from Hunan SJA Laboratory Animal Company (Changsha, China) and maintained under a specific pathogen-free condition. A total of 1 × 10⁷ viable cells were injected subcutaneously into the right flanks of the mice. Tumor sizes were measured using a vernier caliper every week and tumor volume was calculated using the formula: (length × width2)/2. Tumors were also photographed with an IVIS@ Lumina II system (Caliper Life Sciences, USA) every other week. At 5 weeks after implantation, the mice were euthanized and tumors weights were measured.
Statistical analysis
All statistical analyses were conducted using SPSS version 23.0 software. All in vitro and in vivo experimental results were expressed as mean ± standard deviation (SD) at least three independent experiments, and analyzed with Student’s t-test (two-tailed) and Mann-Whitney test. The clinicopathological factors differences between FOXD2-AS1 high or low expression groups were analyzed via Chi-square test. The Kaplan-Meier and log-rank test method was performed to determine survival rate. P values less than 0.05 were considered to be statistically significant.
Results
LncRNA FOXD2-AS1 is upregulated and significantly correlated with poor prognosis in thyroid cancer cohort from TCGA dataset
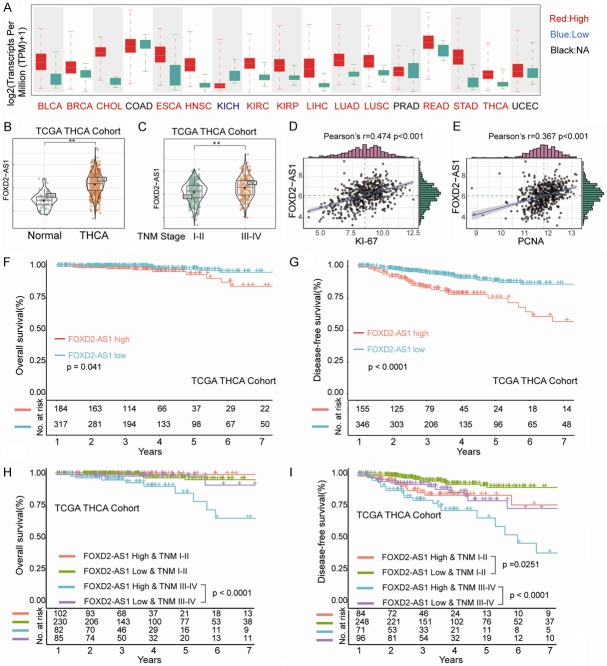
We first examined the expression pattern of lncRNA FOXD2-AS1 in various types of common solid cancers based on the results from TCGA database analysis (Figure 1A). We found that FOXD2-AS1 was highly expressed in multiple cancer types including thyroid cancer (Figure 1A and 1B). In addition, FOXD2-AS1 expression was remarkably higher in thyroid cancer patients with advanced TNM stage (III-IV) in comparison with that in patients with TNM stage I-II (Figure 1C). Moreover, Pearson correlation analysis showed that FOXD2-AS1 expression was significantly positively associated with the expression of Ki67 and PCNA, two proliferation markers of neoplasm (Figure 1D and 1E). Kaplan-Meier analysis suggested that high FOXD2-AS1 expression was associated with significantly shorter overall survival (OS) and disease-free survival (DFS) in TCGA-THCA cohorts (Figure 1F and 1G). Furthermore, advanced TNM stage (stage III-IV) patients with high FOXD2-AS1 expression had shorter OS than those with low FOXD2-AS1 expression (Figure 1H), while early TNM stage (stage I-II) and advanced TNM stage (stages III-IV) patients with high FOXD2-AS1 expression had worse DFS than those with low FOXD2-AS1 expression (Figure 1I), indicating that expression level of FOXD2-AS1 might be a potential prognostic biomarker for THCA patients with different TNM stages.
Figure 1.
LncRNA FOXD2-AS1 is upregulated and significantly correlated with poor prognosis in thyroid cancer cohort from TCGA dataset. A. Expression levels of FOXD2-AS1 in different types of solid cancers were analyzed based on TCGA dataset. BLCA, bladder cancer; BRCA, breast cancer; CHOL, cholangiocarcinoma; COAD, colon cancer; ESCA, esophagus cancer; HNSC, head-Neck squamous cell carcinoma; KICH, kidney chromophobe; KIRC, renal cancer; KIRP, kidney renal papillary cell carcinoma; LIHC, liver cancer; LUAD, lung cancer; LUSC, Lung squamous Cell Carcinoma; PRAD, prostate adenocarcinoma; READ, rectal cancer; STAD, stomach cancer; THCA, thyroid cancer; UCEC, uterine Corpus endometrial carcinoma; B. Expression levels of FOXD2-AS1 in THCA and normal control tissues were analyzed based on TCGA THCA cohort. Data were presented as mean ± SD, Student’s t-test, **P<0.01. C. Expression levels of FOXD2-AS1 in TCGA THCA cohort with different TNM stages were analyzed. Data were presented as mean ± SD, Student’s t-test, **P<0.01. D, E. Correlation analysis between the expression levels of FOXD2-AS1 and Ki67 or PCNA. F, G. Kaplan-Meier analysis of overall survival (OS) or disease-free survival (DFS) in THCA cohort with high or low expression levels of FOXD2-AS1. H, I. Kaplan-Meier analysis of OS or DFS in THCA cohort with high or low expression levels of FOXD2-AS1 at different TNM stages. Survival analysis was evaluated using the Kaplan-Meier method and assessed using the log-rank test. *P<0.05 and **P<0.01.
LncRNA FOXD2-AS1 is markedly upregulated in PTC and positively associated with aggressive phenotypes and poor prognosis
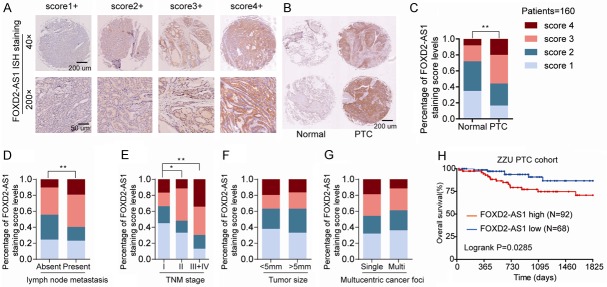
To further explore FOXD2-AS1 expression in PTC, we performed in situ hybridization (ISH) to measure FOXD2-AS1 expression in PTC tissues and matched adjacent normal tissues in a PTC tissue microarray (TMA) containing 160 PTC and paired normal tissues. As shown in Figure 2A, we scored FOXD2-AS1 expression into four levels according to the FOXD2-AS1 ISH staining intensity. We observed that FOXD2-AS1 was dramatically upregulated in PTC tissues compared with that in non-tumor thyroid tissues (Figure 2B and 2C). In addition, FOXD2-AS1 expression was remarkably correlated with the presence of lymph node metastasis (Figure 2D) and TNM stages (Figure 2E), while no statistically significant relationship were observed with tumor size (Figure 2F) and multucentric cancer foci (Figure 2G). Kaplan-Meier analysis revealed that high-level expression of FOXD2-AS1 was associated with poor OS (Figure 2H). A detailed summary of the correlation between FOXD2-AS1 expression and the clinico-pathological features of PTC patients was listed in Table 1.
Figure 2.
LncRNA FOXD2-AS1 is markedly upregulated in PTC and positively associated with aggressive phenotypes and poor prognosis. A. Representative FOXD2-AS1 ISH staining patterns with diferent scores in PTC tissues. B, C. Representative photographs of FOXD2-AS1 ISH staining in PTC tissues and normal samples (left) and Distribution of FOXD2-AS1 ISH staining scores distribution in 160 PTC and adjacent normal tissues from tissue microarray. D-G. Distribution of FOXD2-AS1 ISH staining scores in PTC tissues based on lymph node metastasis, TNM classification, tumor size, or multucentric cancer foci. H. Kaplan-Meier survival analysis of the overall survival in 160 PTC patients with different FOXD2-AS1 expression levels. The clinicopathological factors differences between FOXD2-AS1 high or low expression groups were analyzed via Chi-square test. Survival analysis was evaluated using the Kaplan-Meier method and assessed using the log-rank test. *P<0.05 and **P<0.01.
Table 1.
Clinicopathological characteristics and expression of FOXD2-AS1 in studied PTC patients
| Clinicopathological variables features | FOXD2-AS1 expression | P-value | ||
|---|---|---|---|---|
|
| ||||
| Low expression (n = 68) | High expression (n = 92) | |||
| Age (years) | ≤45 | 40 (58.8) | 64 (69.6) | 0.150 |
| >45 | 28 (41.2) | 28 (30.4) | ||
| Gender | Male | 37 (62.5) | 56 (67.2) | 0.413 |
| Female | 31 (37.5) | 36 (32.7) | ||
| Multicentric Cancer | Single | 35 (67.5) | 40 (58.2) | 0.316 |
| Foci | Multi | 33 (32.5) | 52 (41.8) | |
| TNM stage | Stage I-II | 39 (57.3) | 35 (38.1) | 0.015 |
| Stage III-IV | 29 (42.6) | 57 (61.9) | ||
| Surgical procedure | Subtotal thyroidectomy | 36 (52.9) | 50 (54.3) | 0.859 |
| Thyroidectomy | 32 (47.1) | 42 (45.7) | ||
| Tumor size(mm) | >5 | 27 (39.7) | 25 (27.1) | 0.094 |
| <5 | 41 (60.3) | 67 (72.9) | ||
| Lymph metastasis | No | 45 (66.2) | 42 (45.7) | 0.009 |
| Yes | 23 (33.8) | 50 (54.3) | ||
High expression of FOXD2-AS1 is an independent adverse prognostic factor in PTC patients
Subsequently, we further evaluated the relationship between FOXD2-AS1 expression levels and PTC patients’ clinico-pathological features. Univariate Cox analysis results indicated that lymph node metastasis, TNM stage, and FOXD2-AS1 expression were correlated with the OS (Table 2). In addition, multivariate analysis using the Cox proportional hazard model showed that FOXD2-AS1 expression was an unfavorable independent prognostic biomarker for patients with PTC (P = 0.021, Table 2) and TNM stage (P = 0.001, Table 2). These findings identified that overexpression of FOXD2-AS1 was closely associated with poor prognosis of PTC patients, indicating that FOXD2-AS1 might served as a promising prognostic biomarker in PTC.
Table 2.
Univariate and multivariate analyses of overall survival of studied PTC patients
| Univariate analysis | Multivariate analysis | ||||||
|---|---|---|---|---|---|---|---|
|
|
|
||||||
| HR | 95% CI | P value | HR | 95% CI | P value | ||
| Univariate and multivariate analysis of overall survival in PTC patients (n = 160) | |||||||
| Age | 1.227 | 0.722-1.648 | 0.681 | ||||
| Gender | 0.829 | 0.567-1.392 | 0.371 | ||||
| Multicentric Cancer Foci | 1.255 | 0.911-1.391 | 0.221 | ||||
| TNM stage | 2.497 | 1.609-3.345 | 0.002 | 1.917 | 1.358-2.492 | 0.001 | |
| Surgical procedure | 1.110 | 1.017-1.754 | 0.263 | ||||
| Tumor size | 1.135 | 0.983-1.585 | 0.431 | ||||
| Lymph metastasis | 2.653 | 2.193-3.621 | 0.000 | 2.368 | 2.091-3.475 | <0.001 | |
| FOXD2-AS1 expression | 2.043 | 1.759-3.012 | 0.004 | 1.832 | 1.673-2.226 | 0.021 | |
FOXD2-AS1 knockdown inhibits PTC cell proliferation and invasion in vitro
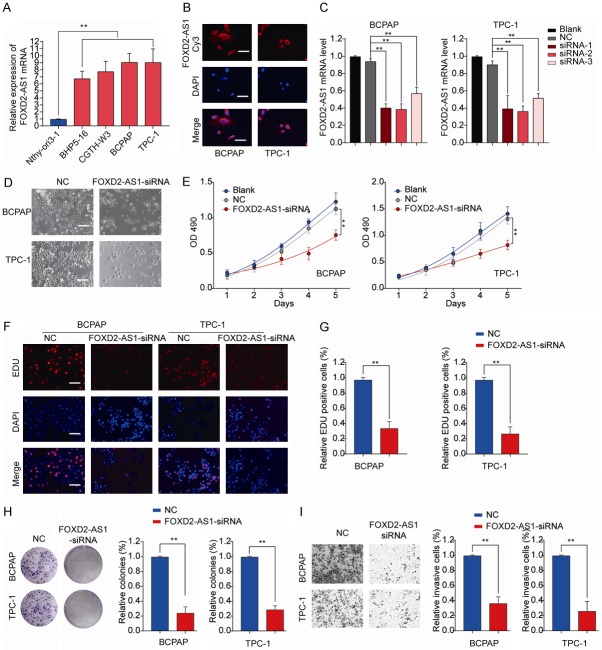
To investigate the function of FOXD2-AS1 in PTC, we measured the expression of FOXD2-AS1 in various human PTC cell lines. As shown in Figure 3A, compared with the normal thyroid cell line Nthy-ori3-1, four different PTC cell lines (BHP5-16, CGTH-W3, BCPAP, and TPC-1) all had significant higher FOXD2-AS1 expression.
Figure 3.
FOXD2-AS1 knockdown inhibits PTC cell proliferation and invasion in vitro. A. The expression levels of FOXD2-AS1 in normal human thyroid cell line thyroid cell line Nthy-ori3-1 and PTC cell lines (BHP5-16, CGTH-W3, BCPAP and TPC-1) were analyzed by RT-qPCR. B. Representative micrographs of FISH staining showing FOXD2-AS1 (red) and nuclei stained with DAPI (blue) in BCPAP and TPC-1 cells. Scale bars = 50 μm. C. RT-qPCR analysis of FOXD2-AS1 expression in BCPAP or TPC-1 cells, or cells transfected with negative control (NC), FOXD2-AS1 siRNA 1/2/3. D. Representative images of PTC cells transfected with NC or FOXD2-AS1-siRNA in 96-well plate. Scale bars = 50 μm. BCPAP or TPC-1 cells were transfected with NC, FOXD2-AS1-siRNA or left untreated (Blank). E. Cell proliferation of BCPAP or TPC-1 cells was assessed by CCK8 assay at indicated time points. F, G. Cell division of BCPAP or TPC-1 cells was analyzed by EDU staining. Scale bars = 50 μm. H. The colony number of BCPAP or TPC-1 was measured by colony formation assay and counted under a microscope. I. Cell invasion of BCPAP or TPC-1 was analyzed by transwell assay. Data are presented as mean ± SD; Student’s t-test, *P<0.05 and **P<0.01.
BCPAP and TPC-1 with relative higher FOXD2-AS1 expression were used for subsequent experiments. Fluorescent In Situ Hybridization (FISH) results showed that FOXD2-AS1 was mainly located in the cytoplasm (Figure 3B). BCPAP and TPC-1 cells were transfected with siRNAs targeting FOXD2-AS1 and the knockdown efficiency was evaluated by RT-qPCR (Figure 3C). The most efficient siRNA-2 was used for the further loss-of-function test (referred as FOXD2-AS1-siRNA). Cell proliferation was markedly inhibited in PTC cells transfected with FOXD2-AS1 siRNA (Figure 3D and 3E). In addition, the proportion of division cells after FOXD2-AS1 knockdown was significantly decreased in BCPAP and TPC-1 cells as shown by EdU assay (Figure 3F and 3G). Silencing FOXD2-AS1 drastically impeded colony formation of PTC cells (Figure 3H). Moreover, we observed that downregulation of FOXD2-AS1 dramatically suppressed invasive ability in PTC cells (Figure 3I). Collectively, our findings indicated that FOXD2-AS1 knockdown inhibited PTC cell proliferation and invasion in vitro.
FOXD2-AS1 knockdown suppresses tumor growth in vivo
In light of the effects of FOXD2-AS1 on PTC cells in vitro, we investigated whether FOXD2-AS1 knockdown could suppress PTC tumorigenesis in vivo. TPC-1 cells stably knockdown FOXD2-AS1 (sh-FOXD2-AS1) or negative control (sh-NC) were subcutaneously implanted into nude mice and tumor growth was monitored. We found that nude mice implanted with FOXD2-AS1-silenced TPC-1 cells showed a significantly decreased tumor growth compared that in sh-NC control group (Figure 4A). Consistently, bioluminescent signal assays also revealed suppressed tumorigenesis in sh-FOXD2-AS1 group (Figure 4B and 4C). Tumor weights were markedly decreased in the sh-FOXD2-AS1 group compared with that in control group (Figure 4D). The FOXD2-AS1 knockdown efficiency was confirmed in tumor tissues from sh-FOXD2-AS1 group (Figure 4E). IHC analysis revealed that Ki-67 expression was significant downregulated in xenograft tumors derived from sh-FOXD2-AS1 group compared to that in the sh-NC group (Figure 4F and 4G). Taken together, these results suggest the pro-oncogenic role of FOXD2-AS1 in PTC tumorigenesis in vivo.
Figure 4.
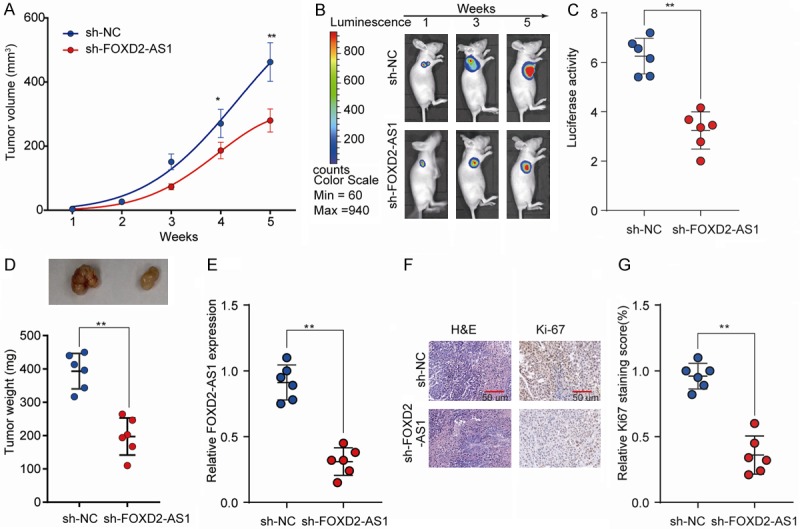
FOXD2-AS1 knockdown suppresses PTC tumorigenesis in vivo. TPC-1 cells stably knockdown FOXD2-AS1 (sh-FOXD2-AS1) or negative control (sh-NC) were injected subcutaneously into nude mice and tumor growth was monitored. A. Tumor growth curves of sh-FOXD2-AS1 and sh-NC groups were determined based on tumor volume measured every week. B, C. The luciferase activity of PTC tumor in nude mice of sh-FOXD2-As1 or sh-NC group was recorded using a live imaging system detecting the luciferase signal. D. Tumor weights of tumors from sh-FOXD2-AS1 and sh-NC groups were analyzed at week 5. E. Relative FOXD2-AS1 expression in tumor tissues of sh-FOXD2-AS1 or NC group was analyzed by RT-qPCR. F. Representative photographs of H&E and Ki-67 staining of tumor tissues from sh-FOXD2-AS1 or NC group. G. Quantification of relative Ki-67 staining scores in tumor sections from the sh-FOXD2-AS1 or NC group. Data are presented as mean ± SD; Student’s t-test, *P<0.05 and **P<0.01.
Bioinformatics analysis of key pathways regulated by FOXD2-AS1 in TCGA-THCA cohort
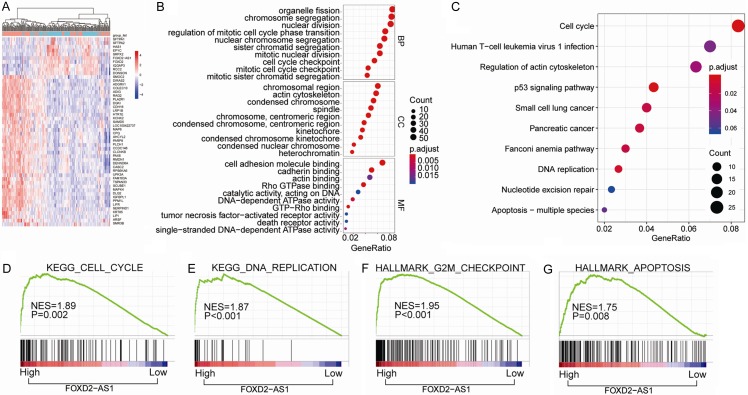
We further investigated the key genes and pathways regulated by FOXD2-AS1 through functional and pathway enrichment analysis of TCGA-THCA cohort. Differential gene expression analysis based on the expression levels of FOXD2-AS1 was shown in Figure 5A. Cell cycle and apoptosis pathway were remarkably enriched in FOXD2-AS1 high expression group through cluster profile gene ontology (GO) and Kyoto Encyclopedia of Genes and Genomes (KEGG) analysis (Figure 5B and 5C). To this end, we speculated that FOXD2-AS1 might regulate cell cycle and apoptosis in THCA development. Gene Set Enrichment Analysis (GSEA) further showed that there were positive significantly correlation between the FOXD2-AS1 expression and cell cycle (Figure 5D), DNA replication (Figure 5E), G2M checkpoint (Figure 5F) and apoptosis (Figure 5G) gene signatures.
Figure 5.
Bioinformatics analysis of key pathways regulated by FOXD2-AS1 in TCGA-THCA cohort. (A) The heatmap of the differential gene expression analysis based on the expression levels of FOXD2-AS1. (B, C) GO enrichment analysis (B) and KEGG pathway enrichment analysis (C) of the top 800 genes with highest FOXD2-AS1 correlation coefficient. (D-G) GSEA analysis of the correlation between FOXD2-AS1 expression with gene signatures of cell cycle (D), DNA replication (E), G2M checkpoint (F) and apoptosis (G) in TCGA-THCA cohort. KEGG pathway enrichment and GO analysis for DEGs were conducted using DAVID (Database for Annotation, Visualization and Integrated Discovery). Pathways with P<0.05 were identified as significance. Gene set enrichment analysis (GSEA) software was acquired from the Broad Institute at MIT. The phenotype labels were generated according to the expression level of FOXD2-AS1. P<0.05 and FDR Q<0.25 were set as the default parameters to generate enrichment results.
To further verify whether cell apoptosis and cell cycle were regulated by FOXD2-AS1, we measured apoptosis-related key genes and cell-cycle-related signature genes in TPC-1 or BCPAP cells transfected with FOXD2-AS1-siRNA or NC control. The results showed that FOXD2-AS1 knockdown dramatically inhibited anti-apoptotic gene Bcl-2 expression while significantly enhanced proapoptotic molecules Bax, Bak, Cleaved Caspase 3, and Cytochrome C expression in both TPC-1 and BCPAP cells (Figure 6A). In addition, silencing FOXD2-AS1 decreased the expression of cell cycle-related genes such as CDK2, Cyclin D2 and Cyclin B1 (Figure 6B). Consistently, IHC staining of xenograft tumor tissues from sh-NC or these findings further confirmed that cell apoptosis and cell cycle process were regulated by FOXD2-AS1 during PTC development (Supplementary Figure 1).
Figure 6.
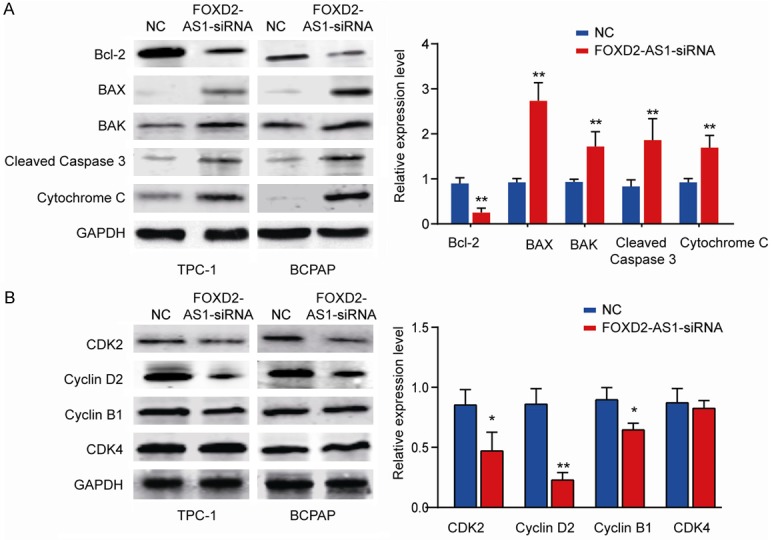
FOXD2-AS1 regulates expression of cell apoptosis and cell cycle-related signature genes. TPC-1 or BCPAP cells were transfected with FOXD2-AS1-siRNA or NC control. A. Cell apoptosis-related genes (Bcl-2, Bax, Bak, Cleaved-Caspase 3 and Cytochrome C) were analyzed by western blot. B. Cell cycle-related genes (CDK2, CDK4, Cyclin B1 and Cyclin D1) were analyzed by western blot. GAPDH was used as an internal control. Data are presented as mean ± SD; Student’s t-test, *P<0.05 and **P<0.01.
LncRNA FOXD2-AS1 directly interacts with miR-185-5p as miRNA sponge
To investigate the underlying mechanism by which FOXD2-AS1 regulates PTC progression and metastasis, we performed bioinformatics analysis using DIANA to search for the potential targets of FOXD2-AS1. As shown in Figure 7A, miR-185-5p shared complementary binding sites with FOXD2-AS1. We also confirmed that the expression of miR-185-5p in THCA tissues was markedly lower than that in normal control tissues (Figure 7B). Consistently, the results showed that PTC cell lines (BHP5-16, CGTH-W3, BCPAP and TPC-1) had significantly lower miR-185-5p expression in comparison with that in nonmalignant thyroid cell line Nthy-ori3-1 (Figure 7C). Previous study has shown that multiple lncRNAs are known to function as competing endogenous RNA (ceRNAs) for specific miRNAs [28]. While overexpression FOXD2-AS1 significantly inhibited miR-185-5p expression (Figure 7D), miR-185-5p mimics dramatically decreased FOXD2-AS1 expression level (Figure 7E). Luciferase reporter assay was performed to evaluate the relationship between FOXD2-AS1 and miR-185-5p. Co-transfection of luciferase reporter vector FOXD2-AS1 WT with miR-185-5p mimics significantly reduced the luciferase activity compared with that in FOXD2-AS1 Mut & miR-185-5p group (P<0.001) (Figure 7F). In contrast, no significant difference was detected in the relative luciferase activity between FOXD2-AS1 MUT and FOXD2-AS1 MUT & miR-185-5p mimics groups (Figure 7F). Moreover, miR-185-5p expression was negatively correlated with FOXD2-AS1 expression in PTC tissues (Figure 7G).
Figure 7.
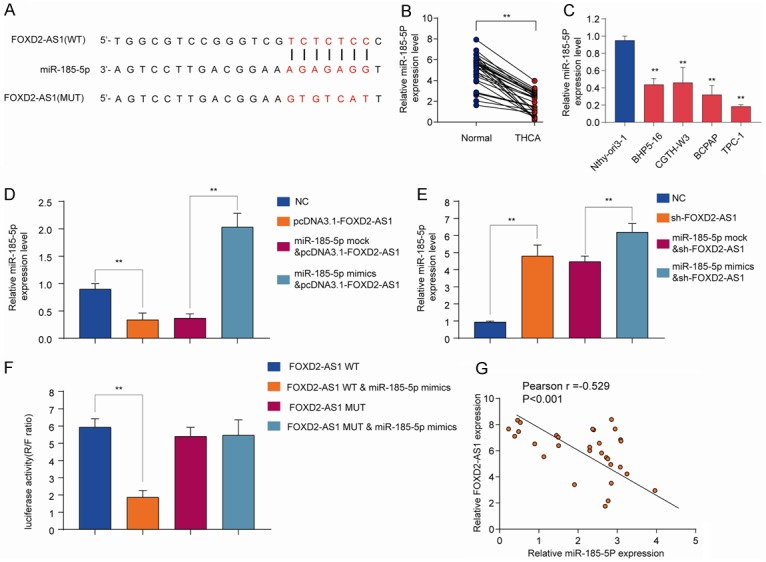
FOXD2-AS1 directly interacts with miR-185-5p as miRNA sponge. (A) Diagram of the putative binding sites of miR-185-5p on FOXD2-AS1 (WT) and the mutated sequences of FOXD2-AS1 (MUT). (B) The expression levels of miR-185-5p in THCA tissues and normal control tissues were analyzed by qRT-PCR. (C) The expression levels of miR-185-5p in PTC cell lines (BHP5-16, CGTH-W3, BCPAP and TPC-1) and nonmalignant thyroid cell line Nthy-ori3-1 were analyzed by qRT-PCR. (D, E) HEK293 cells were transfected with negative control (NC), pcDNA3.1-FOXD2-AS1, miR-185-5p mock, or miR-185-5p mimics and the expression of miR-185-5p (D) or FOXD2A-AS1 (E) was analyzed by qRT-PCR 48 h later. (F) The WT or mutated FOXD2-AS1 was fused to the luciferase-coding region and co-transfected into HEK293T cells with miR-185-5p mimics. Relative luciferase activity was determined 48 h after transfection. (G) Pearson correlation analysis of FOXD2-AS1 expression and miR-185-5p expression in PTC tissues. Data are presented as mean ± SD; Student’s t-test, *P<0.05 and **P<0.01. Pearson analysis was used to calculate the correlation between the expression of FOXD2-AS1 and miR-185-5p.
Overexpression of FOXD2-AS1 partially reverses the suppressive effect of miR-185-5p in TPC cells
To further validate the interaction between miR-185-5p and FOXD2-AS1, BCPAP or TPC-1 cells were transfected with miR-185-5p mimics or mock control, with/without FOXD2-AS1 overexpression vector. Cell proliferation assessed by CCK-8, colony formation and transwell assays showed that while overexpression of miR-185-5p suppressed cell proliferation, colony formation and cell invasion of BCPAP or TPC-1 cells, overexpression of FOXD2-AS1 partially reversed the suppressive effect of miR-185-5p in these cells (Figure 8A-C). We also detected that miR-185-5p overexpression significantly inhibited the expression of Cyclin D2, Wnt1 and TGFβR2, and overexpression of FOXD2-AS1 partially restored the expression levels of these proteins (Figure 8D). These results confirmed the interaction between miR-185-5p and FOXD2-AS1 cooperatively regulates TPC cells proliferation and invasion.
Figure 8.
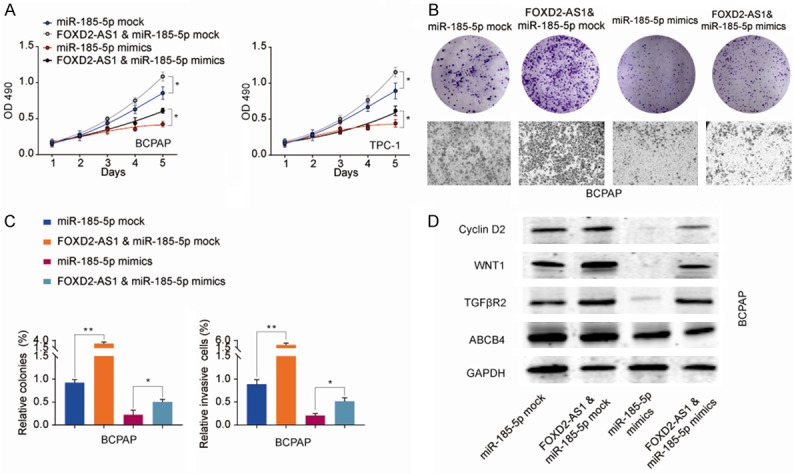
Overexpression of FOXD2-AS1 partially reverses the suppressive effect of miR-185-5p in TPC cells. BCPAP or TPC-1 cells were transfected with miR-185-5p mock or miR-185-5p mimics, with or without FOXD2-AS1 overexpression vector. A. Cell proliferation of BCPAP or TPC-1 was analyzed at indicated time points by CCK-8 kit. B, C. Colony formation and cell invasion of BCPAP cells were analyzed by colony formation assay and transwell assay, respectively. D. The protein expression of Cyclin D2, Wnt1, and TGFβR2 in BCPAP cells transfected with miR-185-5p mock or miR-185-5p mimics, with or without FOXD2-AS1 overexpression vector was analyzed by western blot. Data are presented as the mean ± SD; Using the Student’s t-test for statistical analysis. *P<0.05 and **P<0.01.
Discussion
Although surgical resection combined with radiation and chemotherapy greatly improves the prognosis of patients with PTC in recent decades, the clinical treatment outcomes of PTC patients with invasive or metastatic diseases remains poor [3]. Therefore, exploration of underlying mechanisms and identifying novel biomarkers are urgently needed for PTC treatment.
Increasing evidence has demonstrated that lncRNA plays a crucial role in multiple cancers, including PTC [7]. For instance, LSINCT5 was upregulated in gastric cancer and could impair cell growth and induce apoptosis through regulating the epithelial-mesenchymal transition (EMT) [29]. In prostate cancer, LncRNA TINCR was identified as tumor suppressive gene and associated with poor prognosis [30]. In PTC, several cancer-related lncRNAs have been identified, such as HOTAIR, GAS8-AS1, LPAR4, PROX1-AS1 and so on [13,14,31-33]. In the present study, we focused on a novel cancer-associated lncRNA, FOXD2-AS1, which was remarkably upregulated in PTC tissues than corresponding normal tissues (Figure 1B). Upregulated FOXD2-AS1 was correlated with lymph node metastasis and advanced TNM stage (Table 1 and Figure 1C). Additional, FOXD2-AS1 could be employed as an independent prognostic biomarker for PTC patients (Table 2). Consistent results about the clinical value of FOXD2-AS1 were reported in other cancers, such as esophageal squamous cell carcinoma, bladder cancer, lung cancer and colorectal cancer [16-22]. These findings indicate that FOXD2-AS1 plays a crucial role in PTC progression and might served as a prognostic biomarker.
Limitless proliferation is the hallmarks of neoplasm. Loss-of-function experiment revealed that FOXD2-AS1 silencing markedly attenuated PTC cell proliferation and metastasis in vitro, and suppressed tumor growth in vivo (Figures 3 and 4). Similar to our founding, Zhu et al. reported that FOXD2-AS1 played a critical role in cell proliferation through its interaction with miR-185-5p, regulating EMT and Notch signaling pathway in colorectal cancer [21,22]. In bladder cancer, FOXD2-AS1 could promote bladder cancer progression and accelerate the gemcitabine-resistance [16,20]. FOXD2-AS1 also was identified as oncogene in nasopharyngeal carcinoma, esophageal squamous cell carcinoma and lung cancer through promoting tumor proliferation [17-19]. Taken together, our results confirm that silencing FOXD2-AS1 in PTC cells can significantly impede the cell proliferation abilities and indicate FOXD2-AS1 may be a potential therapeutic target for PTC.
After illuminating the oncogenic role of FOXD2-AS1 in PTC, we further explored the underlying mechanisms of FOXD2-AS1 involved in malignant phenotypes. Through functional and pathway enrichment analysis, we revealed a positive correlation between high FOXD2-AS1 expression and cell cycle and apoptosis (Figure 5B and 5C). In addition, FOXD2-AS1 expression was positively related with cell cycle and apoptosis related genes through GSEA analysis (Figure 5D-G). These data were consistent with results of EdU assay that showed a suppressed cell division in FOXD2-AS1 silencing PTC cells (Figure 3F). The pro-apoptosis roles of lncRNA have been reported in several other cancers. In hepatocellular carcinoma, Chen et al. reported that downregulated lncRNA OGFRP1 could inhibit cell cycle and apoptosis [34]. Li et al. observed that LncRNA TUG1 might function as a tumor suppressor through promoting cell apoptosis in glioma [35]. Similar results were observed in many other cancer-related lncRNAs, such as GAS5, HOTAIR, MALAT1 and PANDAR [13,36-38]. Our findings indicate that apoptosis may be involved in tumorigenesis and cancer progression regulated by FOXD2-AS1, although other factors could not be excluded and further experimentation is required.
Previous studies has documented that multiple lncRNAs are known to function as competing endogenous RNA (ceRNAs) for specific miRNAs [28,39,40]. We further demonstrated that FOXD2-AS1 directly interacts with miR-185-5p as miRNA sponge and overexpression of FOXD2-AS1 partially reverses the suppressive effect of miR-185-5p in TPC cells (Figures 7 and 8). The tumor suppressor role of miR-185-5p has been reported in various cancers including non-small cell lung cancer, triple negative breast cancer and gastric cancer [41-43]. Thus, our results suggest that lncRNA FOXD2-AS1 functions as a ceRNA and competitively binds to miR-185-5p in TPC.
Conclusion
In summary, our findings find that lncRNA FOXD2-AS1 is highly expressed in PTC and associated with poor prognosis, indicating FOXD2-AS1 may be a promising prognostic biomarker. Further, we identify the FOXD2-AS1/miR-185-5p axis functions in the regulation of progression and metastasis in PTC, which needs further study to reveal its clinic diagnosis value.
Acknowledgements
This study was supported by funding from the National Natural Science Foundation of China (81372863); Foundation of Henan university of science and technology innovation team funding (19IRTSTH002); The funding body had no role in the design of the study, in the collection, analysis, and interpretation of the data, or in the manuscript writing.
Disclosure of conflict of interest
None.
Supporting Information
References
- 1.Cabanillas ME, Mcfadden DG, Durante C. Thyroid cancer. Lancet. 2016;388:2783. doi: 10.1016/S0140-6736(16)30172-6. [DOI] [PubMed] [Google Scholar]
- 2.Kitahara CM, Sosa JA. The changing incidence of thyroid cancer. Nat Rev Endocrinol. 2016;12:646. doi: 10.1038/nrendo.2016.110. [DOI] [PMC free article] [PubMed] [Google Scholar]
- 3.Li N, Du XL, Reitzel LR, Xu L, Sturgis EM. Impact of enhanced detection on the increase in thyroid cancer incidence in the united states: review of incidence trends by socioeconomic status within the surveillance, epidemiology, and end results registry, 1980-2008. Thyroid. 2013;23:103–10. doi: 10.1089/thy.2012.0392. [DOI] [PMC free article] [PubMed] [Google Scholar]
- 4.Iyer MK, Niknafs YS, Malik R, Singhal U, Sahu A, Hosono Y, Barrette TR, Prensner JR, Evans JR, Zhao S. The landscape of long noncoding RNAs in the human transcriptome. Nat Genet. 2015;47:199–208. doi: 10.1038/ng.3192. [DOI] [PMC free article] [PubMed] [Google Scholar]
- 5.Wapinski O, Chang HY. Long noncoding RNAs and human disease. Trends Cell Biol. 2011;21:354–61. doi: 10.1016/j.tcb.2011.04.001. [DOI] [PubMed] [Google Scholar]
- 6.Prensner JR, Chinnaiyan AM. The emergence of lncRNAs in cancer biology. Cancer Discov. 2011;1:391–407. doi: 10.1158/2159-8290.CD-11-0209. [DOI] [PMC free article] [PubMed] [Google Scholar]
- 7.Yang G, Lu X, Yuan L. LncRNA: a link between RNA and cancer. Biochimica Et Biophysica Acta. 2014;1839:1097–1109. doi: 10.1016/j.bbagrm.2014.08.012. [DOI] [PubMed] [Google Scholar]
- 8.Gutschner T, Hämmerle M, Diederichs S. MALAT1-a paradigm for long noncoding RNA function in cancer. J Mol Med (Berl) 2013;91:791–801. doi: 10.1007/s00109-013-1028-y. [DOI] [PubMed] [Google Scholar]
- 9.Xie JJ, Li WH, Li X, Ye W, Shao CF. LncRNA MALAT1 promotes colorectal cancer development by sponging miR-363-3p to regulate EZH2 expression. J Biol Regul Homeost Agents. 2019;33:331–343. [PubMed] [Google Scholar]
- 10.Chen Y, Huang W, Sun W, Zheng B, Wang C, Luo Z, Wang J, Yan W. LncRNA MALAT1 promotes cancer metastasis in osteosarcoma via activation of the PI3K-Akt signaling pathway. Cell Physiol Biochem. 2018;51:1313–1326. doi: 10.1159/000495550. [DOI] [PubMed] [Google Scholar]
- 11.Xu Y, Zhang X, Hu X, Zhou W, Zhang P, Zhang J, Yang S, Liu Y. The effects of lncRNA MALAT1 on proliferation, invasion and migration in colorectal cancer through regulating SOX9. Mol Med. 2018;24:52. doi: 10.1186/s10020-018-0050-5. [DOI] [PMC free article] [PubMed] [Google Scholar]
- 12.Bhan A, Mandal SS. LncRNA HOTAIR: a master regulator of chromatin dynamics and cancer. Biochim Biophys Acta. 2015;1856:151–64. doi: 10.1016/j.bbcan.2015.07.001. [DOI] [PMC free article] [PubMed] [Google Scholar]
- 13.Li Z, Gao B, Hao S, Tian W, Chen Y, Wang L, Zhang X, Luo D. Knockdown of lncRNA-PANDAR suppresses the proliferation, cell cycle and promotes apoptosis in thyroid cancer cells. EXCLI J. 2017;16:354–362. doi: 10.17179/excli2017-113. [DOI] [PMC free article] [PubMed] [Google Scholar]
- 14.Sun H, He L, Ma L, Lu T, Wei J, Xie K, Wang X. LncRNA CRNDE promotes cell proliferation, invasion and migration by competitively binding miR-384 in papillary thyroid cancer. Oncotarget. 2017;8:110552–110565. doi: 10.18632/oncotarget.22819. [DOI] [PMC free article] [PubMed] [Google Scholar]
- 15.Zhou H, Sun Z, Li S, Wang X, Zhou X. LncRNA SPRY4-IT was concerned with the poor prognosis and contributed to the progression of thyroid cancer. Cancer Gene Ther. 2017;53:11012. doi: 10.1038/s41417-017-0003-0. [DOI] [PubMed] [Google Scholar]
- 16.An Q, Zhou L, Xu N. Long noncoding RNA FOXD2-AS1 accelerates the gemcitabine-resistance of bladder cancer by sponging miR-143. Biomed Pharmacother. 2018;103:415–420. doi: 10.1016/j.biopha.2018.03.138. [DOI] [PubMed] [Google Scholar]
- 17.Bao J, Zhou C, Zhang J, Mo J, Ye Q, He J, Diao J. Upregulation of the long noncoding RNA FOXD2-AS1 predicts poor prognosis in esophageal squamous cell carcinoma. Cancer Biomark. 2018;21:527–533. doi: 10.3233/CBM-170260. [DOI] [PubMed] [Google Scholar]
- 18.Chen G, Sun W, Hua X, Zeng W, Yang L. Long non-coding RNA FOXD2-AS1 aggravates nasopharyngeal carcinoma carcinogenesis by modulating miR-363-5p/S100A1 pathway. Gene. 2018;645:76–84. doi: 10.1016/j.gene.2017.12.026. [DOI] [PubMed] [Google Scholar]
- 19.Rong L, Zhao R, Lu J. Highly expressed long non-coding RNA FOXD2-AS1 promotes non-small cell lung cancer progression via Wnt/β-catenin signaling. Biochem Biophys Res Commun. 2017;484:586–591. doi: 10.1016/j.bbrc.2017.01.141. [DOI] [PubMed] [Google Scholar]
- 20.Su F, He W, Chen C, Liu M, Liu H, Xue F, Bi J, Xu D, Zhao Y, Huang J. The long non-coding RNA FOXD2-AS1 promotes bladder cancer progression and recurrence through a positive feedback loop with Akt and E2F1. Cell Death Dis. 2018;9:233. doi: 10.1038/s41419-018-0275-9. [DOI] [PMC free article] [PubMed] [Google Scholar]
- 21.Yang X, Duan B, Zhou X. Long non-coding RNA FOXD2-AS1 functions as a tumor promoter in colorectal cancer by regulating EMT and Notch signaling pathway. Eur Rev Med Pharmacol Sci. 2017;21:3586–3591. [PubMed] [Google Scholar]
- 22.Zhu Y, Qiao L, Zhou Y, Ma N, Wang C, Zhou J. Long non-coding RNA FOXD2-AS1 contributes to colorectal cancer proliferation through its interaction with microRNA-185-5p. Cancer Sci. 2018;109:2235–2242. doi: 10.1111/cas.13632. [DOI] [PMC free article] [PubMed] [Google Scholar]
- 23.Bao J, Yu Y, Chen J, He Y, Chen X, Ren Z, Xue C, Liu L, Hu Q, Li J, Cui G, Sun R. MiR-126 negatively regulates PLK-4 to impact the development of hepatocellular carcinoma via ATR/CHEK1 pathway. Cell Death Dis. 2018;9:1045. doi: 10.1038/s41419-018-1020-0. [DOI] [PMC free article] [PubMed] [Google Scholar]
- 24.Zhang J, He Y, Yu Y, Chen X, Cui G, Wang W, Zhang X, Luo Y, Li J, Ren F. Upregulation of miR-374a promotes tumor metastasis and progression by downregulating LACTB and predicts unfavorable prognosis in breast cancer. Cancer Med. 2018 doi: 10.1002/cam4.1576. [Epub ahead of print] [DOI] [PMC free article] [PubMed] [Google Scholar]
- 25.Peng S, Geng J, Sun R, Tian Z, Wei H. Polyinosinic-polycytidylic acid liposome induces human hepatoma cells apoptosis which correlates to the up-regulation of RIG-I like receptors. Cancer Sci. 2009;100:529–536. doi: 10.1111/j.1349-7006.2008.01062.x. [DOI] [PMC free article] [PubMed] [Google Scholar]
- 26.He Y, Xue C, Yu Y, Chen J, Chen X, Ren F, Ren Z, Cui G, Sun R. CD44 is overexpressed and correlated with tumor progression in gallbladder cancer. Cancer Manag Res. 2018;10:3857–3865. doi: 10.2147/CMAR.S175681. [DOI] [PMC free article] [PubMed] [Google Scholar]
- 27.He Y, Chen X, Yu Y, Li J, Hu Q, Xue C, Chen J, Shen S, Luo Y, Ren F. LDHA is a direct target of miR-30d-5p and contributes to aggressive progression of gallbladder carcinoma. Mol Carcinog. 2018;57:772–783. doi: 10.1002/mc.22799. [DOI] [PubMed] [Google Scholar]
- 28.Su X, Xing J, Wang Z, Chen L, Cui M, Jiang B. microRNAs and ceRNAs: RNA networks in pathogenesis of cancer. Chin J Cancer Res. 2013;25:235–239. doi: 10.3978/j.issn.1000-9604.2013.03.08. [DOI] [PMC free article] [PubMed] [Google Scholar]
- 29.Qi P, Lin W, Zhang M, Huang D, Ni S, Zhu X, Bai Q, Sheng W, Du X, Zhou X. E2F1 induces LSINCT5 transcriptional activity and promotes gastric cancer progression by affecting the epithelial-mesenchymal transition. Cancer Manag Res. 2018;10:2563–2571. doi: 10.2147/CMAR.S171652. [DOI] [PMC free article] [PubMed] [Google Scholar]
- 30.Dong L, Ding H, Li Y, Xue D, Liu Y. LncRNA TINCR is associated with clinical progression and serves as tumor suppressive role in prostate cancer. Cancer Manag Res. 2018;10:2799–2807. doi: 10.2147/CMAR.S170526. [DOI] [PMC free article] [PubMed] [Google Scholar]
- 31.Pan W, Zhou L, Ge M, Zhang B, Yang X, Xiong X, Fu G, Zhang J, Nie X, Li H. Whole exome sequencing identifies lncRNA GAS8-AS1 and LPAR4 as novel papillary thyroid carcinoma driver alternations. Hum Mol Genet. 2016;25:1875–84. doi: 10.1093/hmg/ddw056. [DOI] [PubMed] [Google Scholar]
- 32.Qin Y, Sun W, Zhang H, Zhang P, Wang Z, Dong W, He L, Zhang T, Shao L, Zhang W. LncRNA GAS8-AS1 inhibits cell proliferation through ATG5-mediated autophagy in papillary thyroid cancer. Endocrine. 2018;59:555–564. doi: 10.1007/s12020-017-1520-1. [DOI] [PubMed] [Google Scholar]
- 33.Wang XM, Liu Y, Fan YX, Liu Z, Yuan QL, Jia M, Zushi G, Gu L, Lu XB. LncRNA PTCSC3 affects drug resistance of anaplastic thyroid cancer through STAT3/INO80 pathway. Cancer Biol Ther. 2018;19:590–597. doi: 10.1080/15384047.2018.1449610. [DOI] [PMC free article] [PubMed] [Google Scholar]
- 34.Chen W, You J, Zheng Q, Zhu Y. Downregulation of lncRNA OGFRP1 inhibits hepatocellular carcinoma progression by AKT/mTOR and Wnt/β-catenin signaling pathways. Cancer Manag Res. 2018;10:1817–1826. doi: 10.2147/CMAR.S164911. [DOI] [PMC free article] [PubMed] [Google Scholar]
- 35.Li J, Meng Z, Gang A, Ma Q. LncRNA TUG1 acts as a tumor suppressor in human glioma by promoting cell apoptosis. Exp Biol Med (Maywood) 2016;241:644–9. doi: 10.1177/1535370215622708. [DOI] [PMC free article] [PubMed] [Google Scholar]
- 36.Kim K, Jutooru I, Chadalapaka G, Johnson G, Frank J, Burghardt R, Kim S, Safe S. HOTAIR is a negative prognostic factor and exhibits pro-oncogenic activity in pancreatic cancer. Oncogene. 2013;32:1616–1625. doi: 10.1038/onc.2012.193. [DOI] [PMC free article] [PubMed] [Google Scholar]
- 37.Pickard MR, Williams GT. The hormone response element mimic sequence of GAS5 lncRNA is sufficient to induce apoptosis in breast cancer cells. Oncotarget. 2016;7:10104–10116. doi: 10.18632/oncotarget.7173. [DOI] [PMC free article] [PubMed] [Google Scholar]
- 38.Zhang M, Gu H, Xu W, Zhou X. Down-regulation of lncRNA MALAT1 reduces cardiomyocyte apoptosis and improves left ventricular function in diabetic rats. Int J Cardiol. 2016;203:214–6. doi: 10.1016/j.ijcard.2015.10.136. [DOI] [PubMed] [Google Scholar]
- 39.Zhang C, Wang C, Jia Z, Tong W, Liu D, He C, Huang X, Xu W. Differentially expressed mRNAs, lncRNAs, and miRNAs with associated co-expression and ceRNA networks in ankylosing spondylitis. Oncotarget. 2017;8:113543–113557. doi: 10.18632/oncotarget.22708. [DOI] [PMC free article] [PubMed] [Google Scholar]
- 40.Zhang G, Li S, Lu J, Ge Y, Wang Q, Ma G, Zhao Q, Wu D, Gong W, Du M, Chu H, Wang M, Zhang A, Zhang Z. LncRNA MT1JP functions as a ceRNA in regulating FBXW7 through competitively binding to miR-92a-3p in gastric cancer. Mol Cancer. 2018;17:87. doi: 10.1186/s12943-018-0829-6. [DOI] [PMC free article] [PubMed] [Google Scholar]
- 41.Li S, Ma Y, Hou X, Liu Y, Li K, Xu S, Wang J. MiR-185 acts as a tumor suppressor by targeting AKT1 in non-small cell lung cancer cells. Int J Clin Exp Pathol. 2015;8:11854–11862. [PMC free article] [PubMed] [Google Scholar]
- 42.Tang H, Liu P, Yang L, Xie X, Ye F, Wu M, Liu X, Chen B, Zhang L, Xie X. miR-185 suppresses tumor proliferation by directly targeting E2F6 and DNMT1 and indirectly upregulating BRCA1 in triple-negative breast cancer. Mol Cancer Ther. 2014;13:3185–3197. doi: 10.1158/1535-7163.MCT-14-0243. [DOI] [PubMed] [Google Scholar]
- 43.Tan Z, Jiang H, Wu Y, Xie L, Dai W, Tang H, Tang S. miR-185 is an independent prognosis factor and suppresses tumor metastasis in gastric cancer. Mol Cell Biochem. 2014;386:223–231. doi: 10.1007/s11010-013-1860-y. [DOI] [PubMed] [Google Scholar]
Associated Data
This section collects any data citations, data availability statements, or supplementary materials included in this article.


