Abstract
Triple-negative breast cancer (TNBC) is an important histological subtype of breast cancer. Abnormal GPER expression has been reported in human breast cancer. However, the functional mechanism of GPER through carcinoma-associated fibroblast (CAF) in TNBC needed further investigations. The proliferation and cycle progression of the MDA-MB-231 cells were respectively analyzed by CCK-8 assay and flow cytometry, while cell migration and invasion were examined by wound healing assay and transwell assay. GPER expression in TNBC tissues and MDA-MB-231 cells was investigated by RT-qPCR, western blotting and immunohistochemistry. Collagen-1 was measured using ELISA. In addition, the role of GPER through CAF was investigated through cells were transfected with GPER interference plasmid and treated with GPER agonist, respectively. The transfection effects were verified by RT-qPCR. The results demonstrated that CAF could promote proliferation, migration and invasion of MDA-MB-231 cells compared with normal fibroblast (NF). GPER expression was decreased in TNBC tissues and MDA-MB-231 cells in comparison with the adjacent normal tissues and MCF-10A cells. GPER expression could affect the expression of Coll-1 in CAF. Downregulation of GPER inhibited Coll-1 expression in CAF, thereby inducing the decrease of cell proliferation, arrest of S phase and suppression of migration and invasion of MDA-MB-231 cells, while GPER agonist could be resulted in the opposite effects. In conclusion, the present data demonstrated that GPER promoted proliferation, migration and invasion of TNBC cells through CAF. Furthermore, GPER expression was positively related to the prognosis of TNBC.
Keywords: G protein coupled receptor (GPER), proliferation, migration, invasion, TNBC, carcinoma-associated fibroblast (CAF)
Introduction
Breast cancer is one of the biggest threats to the life of women worldwide, and is currently the most common malignant tumor among women. Triple-negative breast cancer (TNBC) is a special subtype in breast cancer, which is negative to estrogen receptors, progesterone receptors and human epidermal growth factor receptor 2 (HER2) and positive to G protein coupled receptor (GPER) to achieve estrogenic effects [1]. Although the diagnosis and treatment level of breast cancer was improved to reduce the morality in breast cancer, the treatment for TNBC was still limited. Therefore, it is of great significance to find molecular biological factors that can affect or predict the prognosis of TNBC and explore its influence mechanism to understand the occurrence and development of TNBC.
GPER has been identified as a new membrane-bound estrogen receptor involved in the rapid nongenomic effects of estrogen and GPER regulates the proliferative effects of estrogen through transactivating epidermal growth factor receptor (EGFR) in breast cancer cells [2,3]. Previous studies demonstrated that GPER expression was correlated with the occurrence of breast cancer. For instance, Filardo et al. discovered that approximately 40% of the primary breast ductal carcinoma tissue samples presented low or undetectable expression of GPER, and GPER expression was related to positive ER, HER2 overexpression, tumor size and distant metastasis [4]. Similarly, Poola et al. found that GPER expression was decreased in breast cancer tissue and low-expression of GPER remained a significant unfavorable factor for the prognosis of breast cancer [5]. Therefore, GPER may be considered as a target for endocrine therapy in patients with TNBC.
Tumors are not composed of single homogeneous tumor cells in vivo. Tumor microenvironment including tumor cells, mesenchymal cells and extracellular components, affected the process of growth, invasion, and migration of tumor cells to promote the occurrence and development of tumors together through various growth factors, hormones and cytokines [6]. Tumor-associated fibroblast (CAF) is a special kind of fibroblast around the tumor and one of the main components in tumor microenvironment. Many studies showed that CAF possessed stronger abilities of proliferation, migration and collagen secretion than normal fibroblast (NF) and could promote the migration and invasion of breast cancer cells [7-9]. 80% of fibroblasts around breast cancer are activated into CAF which was related to tumor size, lymph node metastasis and tumor histologic grade, as well as recurrence, metastasis and poor prognosis of breast cancer patients [10,11]. In advanced breast cancer, large amounts of lysyl oxidase (LOX) were secreted by CAF to promote collagen expression and matrix reconstruction while LOX inhibitor could delay tumor progression [12]. The vitro experiments showed that GPER could be expressed in breast cancer CAF and affected the proliferation and migration of breast cancer cells in response to estrogen signal [13,14]. Therefore, the mechanism of GPER in breast cancer may be related to CAF in tumor microenvironment. Nevertheless, in TNBC, the role of GPER through CAF is not entirely clear.
Here, the present study was aimed to investigate the role of GPER through CAF in TNBC cells and the underlying molecular mechanism.
Materials and methods
Clinical samples
The experimental design was authorized by the Human Ethics Committee Review Board of Jiangsu Cancer Hospital, Nanjing, Jiangsu, China. Six patients have signed consent forms. Those breast cancer tissues and paired adjacent normal tissues were collected from six patients who were diagnosed with TNBC at Jiangsu Cancer Hospital according to the principles of the Declaration of Helsinki. All the tissues were assessed and determined by pathologists. Breast cancer tissues and paired adjacent normal tissues were snap-frozen in liquid nitrogen and then stored at -80°C until further use.
TNBC cell line culture
MDA-MB-231 cell line was purchased from the Cell Bank of Shanghai (Shanghai, China). Cells were routinely cultured in Dulbecco’s modified Eagle’s medium (Gibco; Thermo Fisher Scientific, Inc., Waltham, MA, USA) supplemented with 10% fetal bovine serum (FBS) at 37°C with 5% CO2 in a humidified atmosphere.
CAF and NF culture
CAF was given by the scientific research team headed by Tengye Yu in Jiangxi Cancer Hospital. NF (no. MZ-M0014) was bought from Mingzhou biotechnology co., LTD (https://www.mingzhoubio.com/). CAF conditioned medium (CAF-CM) and NF conditioned medium (NF-CM) were prepared as follows: CAF or NF in logarithmic phase was harvested and 20 mL cell suspension (106 cells per milliliter) was seeded onto a cell culture bottle. When cells reached 80% confluence, the supernatants were transferred to centrifuge tubes and centrifuged at 1000 rpm for 20 min. After centrifugation, cell debris was removed and the supernatants was stored at -20°C until further use.
Co-culture of MDA-MB-231 cells and CAF or NF
MDA-MB-231 cells were placed into a 24-well plate (Costar, Corning, NY, USA) and CAF or NF were placed into 24-well Transwell chambers (Millipore, Massachusetts, USA). The cells cannot penetrate the membrane of the Transwell because the membrane aperture was 0.4 μM. Then, Transwell chambers were placed above the 24-well plate for the co-culture of MDA-MB-231 cells and CAF or NF over five days in the same culture condition mentioned above.
CCK-8 assay
Cell Counting Kit-8 (CCK8) (Dojindo Molecular Technologies, Shanghai, China) assay was applied to the evaluation of MDA-MB-231 cells proliferation. Briefly, MDA-MB-231 cells (5×10³ cells per well) were seeded into a 96-well plate and cultured at 37°C with 5% CO2 in a humidified atmosphere. After 48 h of incubation, 10 μL CCK8 solution was added into each well. Finally, the optical density value was measured at 450 nm by a microplate reader (Model 680; Bio-Rad, Hercules, CA, USA). All experiments were repeated at least three times.
Flow cytometry analysis
After co-culture and transfection, the apoptosis of MDA-MB-231 cells was evaluated by the Annexin V-phycoerythrin (PE)/propidium iodide (PI) apoptosis detection kit (BD Biosciences, Franklin Lakes, NJ, USA) according to the manufacturer’s instructions. Briefly, cells were harvested and washed by PBS buffer thirdly, then resuspended in 100 μL buffer solution and stained with 5 μL Annexin V-PE and 5 μL PI in the dark for 10 min at room temperature. Finally, ending buffer was added, and the cells were then analyzed by a flow cytometry cytometer (BD Biosciences) within 1 h after the reaction halted.
Wound healing assay
MDA-MB-231 cells were plated into 6-well plate (Costar) and a confluent monolayer of cells in complete medium was developed. A liner wound across the center of monolayer was formed with a plastic pipette tip. The wounded cellular monolayer was washed twice with PBS, and then incubated in fresh culture medium. Then, cells were observed under a phase-contrast microscope (Olympus, Guangzhou, China) and photographed at different time points. Finally, central wound edges at time 0 day, 3 days and 5 days were recorded using PowerShot G10 camera (Canon, Tokyo, Japan) and the areas of cell frontiers bordering the wound in images were calculated using Imagepro Plus software.
Transwell assay
Invasion assay was conducted in 24-well Transwell chambers (Millipore) according to the manufacturer’s manual. Briefly, transwell membranes were pre-coated with 10 μL of fibronectin (Sciencell, Los Angeles, USA) and 50 μL of matrigel (BD Biosciences) and incubated at 37°C with 5% CO2 for 24 h. Then, 500 μL serum-free cell suspension (105 cells per chamber) was added to the upper chamber and 500 μL DMEM (Gibco; Thermo Fisher Scientifc, Inc.) with 10% FBS was added to the lower chamber as a chemoattractant. After the incubation at 37°C with 5% CO2 for 24 h, the invasive cells at the bottom of the membrane were fixed with methanol for 30 min at room temperature, followed by the stain with hematoxylin for 5 min at room temperature. A microscope was then used to count the stained cells at 100× magnification. Tests were repeated three times.
Western blot analysis
The expression level of GPER in breast tissues or breast cells was analyzed by the western blot analysis. Human breast tissues were minced, placed into a homogenizer and smashed three times in cell lysis buffer (cat no. P0013; Beyotime Biotechnology Co., Shanghai, China), phenylmethylsulfonyl fluoride (PMSF, a serine protease inhibitor) (Chunshi Biotechnology Co., Ltd., Shanghai, China), and phenol sulfotransferase (PST, a phosphatase inhibitor) (Abcam Trading Co., Ltd., Shanghai, China) using ultrasonic cell crushing device (Xianghu Science and Technology Development Co., Ltd., Beijing, China). Then, the tissue homogenate was kept at low temperature for 30 min and transferred to a 1.5 ml centrifuge tube, after which centrifuged at 4°C for 30 min. The total breast tissue proteins were in the upper supernatant which was collected, divided into the centrifuge tubes and preserved at low temperature. The total breast cell proteins were extracted with a lysis buffer according to the manufacturer’s protocol. The protein concentration was detected by a BCA Protein Assay Kit (Pierce; Thermo Fisher Scientific, Inc.).
20 μg of protein was separated on 12% SDS-PAGE gels and transferred to polyvinylidene fluoride (PVDF) membranes (Merck Millipore, Billerica, MA, USA). 5% nonfat milk in TBST (Tris-buffered saline plus 0.1% Tween 20) was needed to block non-specific binding and then membranes were incubated with primary antibody against GPER (item no. ALO-AER-050-0.2; AmyJet Scientific Inc, Wuhan, China) and GAPDH (cat no. 5174; Cell Signaling Technology, Inc.; dilution, 1:1,000) overnight at 4°C, followed by incubation with anti-rabbit horseradish peroxidase-linked IgG secondary antibody (cat no. 7074; Cell Signaling Technology, Inc.; dilution, 1:2,000) at room temperature for 2-3 h. GAPDH was used to correct the protein expression. Finally, the protein bands were obtained by an enhanced chemiluminescence detection system (Super Signal West Dura Extended Duration Substrate; Thermo Fisher Scientific, Inc.).
RT-qPCR analysis
The expression of GPER in breast tissues was determined using PCR. Total RNA from breast tissue homogenates or breast cells was isolated with TRIzol reagent (Invitrogen; Thermo Fisher Scientific, Inc.) according to the manufacturer’s protocol. 2 μg of total RNA was applied for the generation of cDNA with PrimeScript Reverse Transcription Reagent kit (Takara Biotechnology Co., Ltd., Beijing, China) and then the real-time PCR was conducted using Taqman Universal Master Mix II (Invitrogen; Thermo Fisher Scientific, Inc.) according to the manufacturer’s protocols. The amplification conditions were as follows: 95°C for 10 min, followed by 38 cycles of 95°C for 10 sec and 58°C for 60 sec. All data was normalized to the internal control GAPDH. The primer sequences for qPCR were as follows: GAPDH forward, 5’-GAAGGTGAAGGTCGGAGTC-3’, and reverse, 5’-GAAGATGGTGATGGGATTTC-3’; GPER forward, 5’-ACACACCTGGGTGGACACAA-3’ and reverse, 5’-GGAGCCAGAAGCCACATCTG-3’. The 2-ΔΔCq method was used to quantify the relative gene expression levels.
GPER interference plasmid construction and transfection
In GenBank, the mRNA sequences of GPER gene were founded. Briefly, two pairs of siRNA oligonucleotides precursors and a couple of negative control sequence for GPER gene were designed and synthesized by Invitrogen’s online design tool in accordance with the design principles of siRNA. After that, GPER interference plasmid was constructed according to the instructions of plasmid construction kit.
At 24 h before transfection, CAF (106 cells per well) were reseeded into 12-well plates and incubated at 37°C with 5% CO2. Cells were transfected with three kinds of plasmids using Lipofectamine® 2000 (Invitrogen; Thermo Fisher Scientific, Inc.) reagents following the manufacturers’ protocols. The experimental groups were divided into four groups: GPER inhibitor-1 group (si-GPER-1), GPER inhibitor-2 group (si-GPER-2), blank plasmid group (siRNA-NC), control group. The level of transcription was determined by RT-qPCR and western blot to verify the effect of transfection.
Immunohistochemistry (IHC)
The breast tissues were fixed in 4% paraformaldehyde and embedded in paraffin. The paraffin-embedded breast tissues were totally sliced into 5 μm thick tissue sections. Then, the slides were dewaxed, hydrated, and incubated with 3% H2O2 for 10 min to inactivate the endogenous peroxidase and then rinsed with water and PBS respectively three times. To block the nonspecific bindings of the first antibody, 10% goat serum was added onto the tissue slides and incubated for 10 min at room temperature. Then, the tissue sections were incubated with GPER antibodies (item no. ALO-AER-050-0.2; AmyJet Scientific Inc.) at 37°C for 2 h. After washed with PBS three times, tissue slides were incubated with the secondary HRP-conjugated antibody (Santa Cruz Biotech, Inc. Dexas, USA) at 37°C for 30 min. Then, tissue sections were washed by PBS three times, followed by the coloration with DAB substrate chromogen solution (Histolab Products AB, Goteborg, Sweden). Finally, tissue slides were counterstained with hematoxylin, then observed with a microscope (Carl Zeiss, Germany) and photographed with a digital camera (Carl Zeiss).
Immunofluorescence staining
Immunofluorescence staining was performed to detect the expression of α-smooth muscle actin (α-SMA) and fibroblast activation protein (FAP) in CAF or NF according to the standard protocols. Briefly, cells were fixed with 4% paraformaldehyde for 15 min, washed with PBS three times and permeabilized by 1% Triton X-100 for 20 min at room temperature. After washed with PBS three times, cells were blocked with 10% goat serum for 30 min at room temperature and incubated with primary antibodies against α-SMA (cat no. 56856; Cell Signaling Technology, Inc. Danvers, Massachusetts, USA; dilution, 1:200) and FAP (cat no. 71094; Santa Cruz Biotech, Inc.; dilution, 1:200) overnight at 4°C. Then, cells were washed with PBST three times and incubated with anti-mouse Alexa Fluor 488 (cat no. P0188; Beyotime Institution of Biotechnology, Haimen, China; dilution, 1:1,000) secondary antibodies for 30 min at room temperature. Again washed with PBST three times, cells were stained with DAPI (Beyotime Institution of Biotechnology) for 5 min at room temperature. Finally, images were obtained using a fluorescence microscope (Carl Zeiss).
Enzyme-linked immunosorbent assay (ELISA)
The level of Coll-1 in the culture supernatant of CAF or NF was respectively determined by ELISA using human Coll-1 ELISA kit (SenBeiJia Biological Technology Co., Ltd., Nanjing, China) according to the manufacturer’s instruction.
Statistical analysis
Numerical data were represented as the mean ± standard deviation. Statistical analysis was performed with the SPSS software (version 22.0, Chicago, IL, USA). Statistical significance was determined using the Student t test or the single factor variance analysis. P<0.05 was identified to be statistically significant.
Results
CAF promotes the proliferation, invasion and migration of TNBC cells
The proliferation, invasion and migration of TNBC cells were successively analyzed by CCK-8 assay, wound healing assay and transwell assay. The cell cycle of TNBC cells was determined by flow cytometry. MDA-MB-231 cells were respectively co-cultured with CAF and NF for 120 h and the cell viability was recorded at 24 h, 48 h, 72 h, 96 h and 120 h. As shown in Figure 1A, the viability of TNBC cells which were co-cultured with CAF was higher than co-cultured with NF at five time points. Compared with the NF+MDA-MB-231 group, the number of MDA-MB-231 cells in S phase was more (Figure 1B and 1C). As shown in Figure 2A and 2B, the scratch was becoming narrowed and the scratch of MDA-MB-231 cells in CAF-CM was smaller than the cells in NF-CM. The number of MDA-MB-231 cells in CAF-CM were more than the cells in NF-CM at 3D and 5D (Figure 2C and 2D). Therefore, proliferation, invasion and migration of TNBC cells were all enhanced with the co-culture of CAF.
Figure 1.
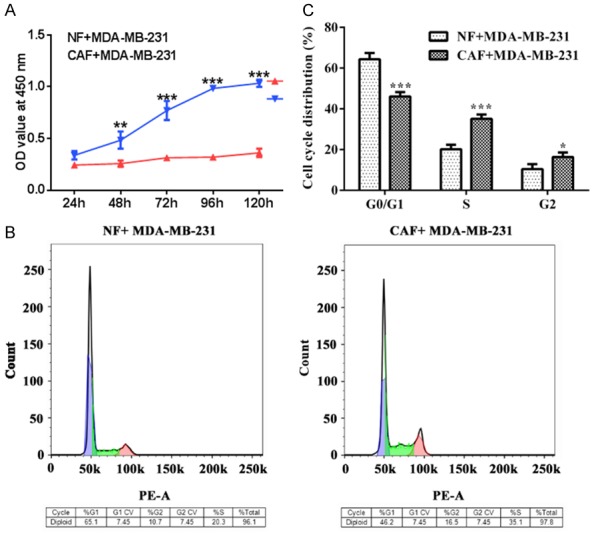
CAF promotes the proliferation of TNBC cells. A. The viability of MDA-MB-231 cells in NF and CAF was detected by CCK-8 assay. ***P<0.001 vs. CAF+MDA-MB-231 group. B, C. The cell cycle of MDA-MB-231 cells in NF and CAF was detected by the flow cytometry. *P<0.05 and ***P<0.001 vs. G0/G1.
Figure 2.
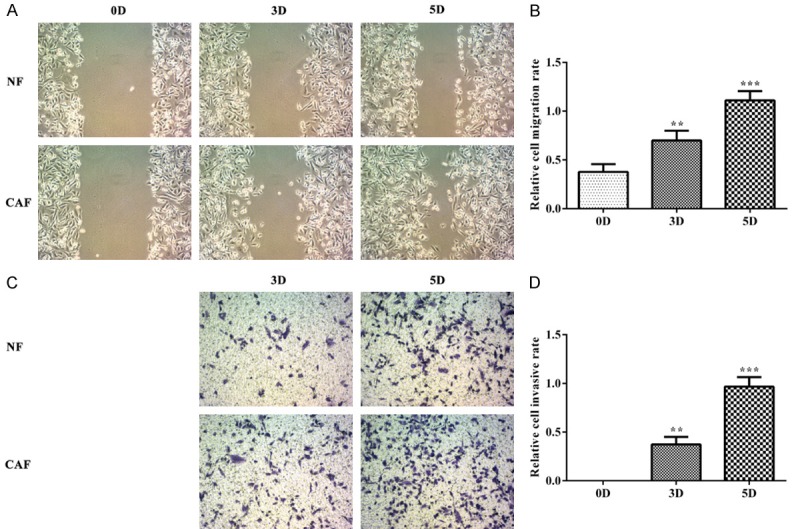
CAF promotes the invasion and migration of TNBC cells. A, B. The cell invasion was analyzed by the wound healing assay. **P<0.01 and ***P<0.001 vs. 0D group. C, D. The cell migration was analyzed by the transwell assay. **P<0.01 and ***P<0.001 vs. 0D group.
GPER is down-regulated in TNBC tissues and cells
As shown in Figure 3A and 3B, the expression of GPER mRNA and GPER was decreased in breast cancer tissues (patient group) compared with the adjacent cancer tissues (control group) which was same with the result of IHC (Figure 3C). Compared with MCF-10A, the expression of GPER mRNA and GPER in MDA-MB-231 cells was decreased (Figure 3D and 3E). Therefore, these results indicated that GPER expression was decreased in TNBC tissues and cells.
Figure 3.
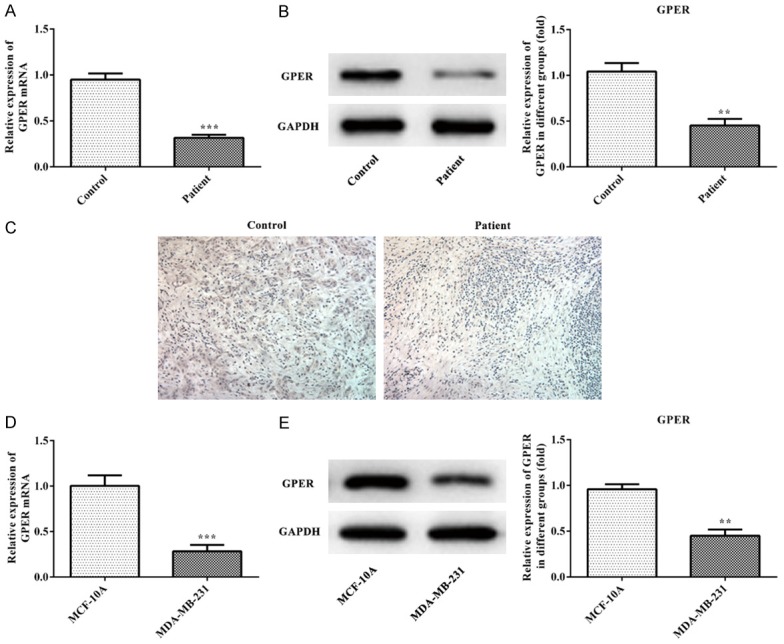
GPER is down-regulated in TNBC tissues and cells. A. The expression of GPER mRNA in TNBC tissues was analyzed by the RT-qPCR analysis. ***P<0.001 vs. control group. B. The expression of GPER in TNBC tissues was analyzed by the western blot analysis. ***P<0.001 vs. control group. C. The expression of GPER of TNBC tissues was detected by the immunofluorescence staining. D. The expression of GPER mRNA in TNBC cells was analyzed by the RT-qPCR analysis. ***P<0.001 vs. MCF-10A group. E. The expression of GPER in TNBC cells was analyzed by the western blot analysis. **P<0.01 vs. MCF-10A group.
The effect of GPER expression level on the ability of CAF to secrete collagen
RT-qPCR and western blot were applied to the detection of GPER expression in CAF and NF. Compared with the NF group, the expression of GPER mRNA and GPER in CAF group was increased (Figure 4A and 4B) and Type I collagen expression in CAF group was higher than that in NF group (Figure 4C). Therefore, the GPER overexpression could promote the secretion of collagen in CAF.
Figure 4.
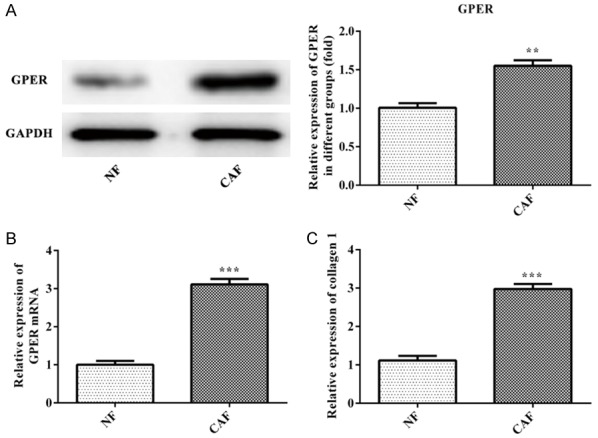
GPER promotes the secretion of collagen in CAF. A. The expression of GPER in CAF was analyzed by the western blot analysis. **P<0.01 vs. NF group. B. The expression of GPER mRNA in CAF was analyzed by the RT-qPCR analysis. ***P<0.001 vs. NF group. C. The expression of collagen 1 was analyzed by the ELISA. ***P<0.001 vs. NF group.
The effect of up-regulated GPER or down-regulated GPER on Coll-1 expression in CAF cells
The transfection effect of si-GPER-1, si-GPER-2 and siRNA-NC in CAF cells was determined with RT-qPCR and western blot. The results showed that GPER expression in si-GPER-1 and si-GPER-2 groups were smaller than siRNA-NC and control groups, and GPER expression in si-GPER-1 group was lower than that in si-GPER-2 group (Figure 5A and 5B). The GPER expression in si-GPER-1 group was chosen for the subsequent experiment. As shown in Figure 5C and 5D, the results from ELISA and western blot indicated that Coll-1 expression in CAF cells was decreased in si-GPER-1 group compared with siRNA-NC and control groups while Coll-1 expression in CAF cells was increased in OHT group compared with siRNA-NC and control groups. Therefore, up-regulated GPER could facilitate the expression of Coll-1 and down-regulated GPER could suppress the expression of Coll-1 in CAF cells.
Figure 5.
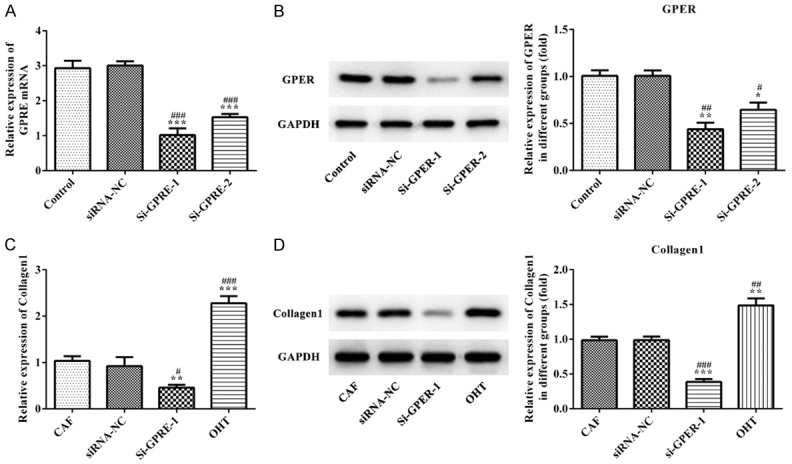
The effect of GPER expression on Collagen 1 expression in CAF cells. A. RT-qPCR analysis was applied to detect the expression of GPER mRNA after transfection. ***P<0.001 vs. control group, ###P<0.001 vs. siRNA-NC group. B. Western blot analysis was applied to detect the GPER expression after transfection. *P<0.05 and **P<0.01 vs. control group, #P<0.05 and ##P<0.01 vs. siRNA-NC group. C. RT-qPCR analysis was used to detect the expression of Collagen 1 mRNA affected by GPER expression. **P<0.01 and ***P<0.001 vs. control group, #P<0.05 and ###P<0.001 vs. siRNA-NC group. D. Western blot analysis was used to detect the Collagen 1 expression affected by GPER expression. **P<0.01 and ***P<0.001 vs. control group, ##P<0.01 and ###P<0.001 vs. siRNA-NC group.
The effect of up-regulated GPER or down-regulated GPER on the proliferation, invasion and migration of TNBC cells
As shown in Figure 6A, the cell viability of MDA-MB-231 cells in CAF-siRNA-GPER group was lower while the cell viability of MDA-MB-231 cells in OHT group was higher than that in NF group. The results of flow cytometry revealed that the number of MDA-MB-231 cells in S phase of OHT group was more while the number of MDA-MB-231 cells in S phase of CAF-siRNA-GPER group was less than that in NF control group (Figure 6B and 6C). From 3D to 5D, compared with the CAF-siRNA-NC group, the invasion and migration ability of MDA-MB-231 cells in CAF-siRNA-GPER group was gradually decreased while the invasion and migration ability of MDA-MB-231 cells in OHT group was gradually increased (Figure 6D-G). Therefore, GPER overexpression in CAF could promote the proliferation, invasion and migration of TNBC cells while GPER inhibition in CAF could suppress the proliferation, invasion and migration of TNBC cells.
Figure 6.
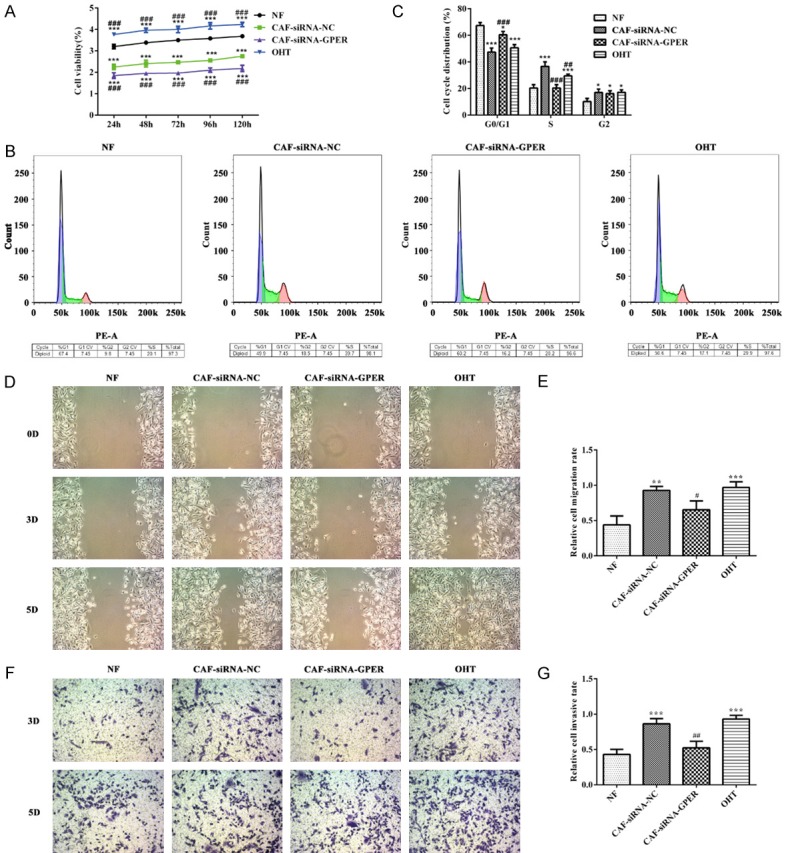
The effect of GPER expression on the proliferation, invasion and migration of TNBC cells. A. CCk-8 assay was used to determine the cell viability affected by GPER expression. ***P<0.001 vs. NF group, ###P<0.001 vs. CAF+siRNA-NC group. B, C. Flow cytometry was used to determine the cell cycle affected by GPER expression. *P<0.05 and ***P<0.001 vs. NF group, ##P<0.01 and ###P<0.001 vs. CAF+siRNA-NC group. D, E. Wound healing assay was applied to analyze the cell invasion affected by GPER expression. **P<0.01 and ***P<0.001 vs. NF group, #P<0.05 vs. CAF+siRNA-NC group. F, G. Transwell assay was applied to analyze the cell migration affected by GPER expression. ***P<0.001 vs. NF group, ##P<0.01 vs. CAF+siRNA-NC group.
Discussion
TNBC is a tumor with poor prognosis which often occurred in women between the ages of 45 to 60 and accounts for approximately 18% in breast cancer [15,16]. And, TNBC tends to transfer to other organs such as lung and brain [17,18]. Therefore, it is very important to find an effective approach to treat TNBC. In this study, we investigated the promotion effect of CAF, GPER expression in cancer tissues, cancer cells and CAF, and the effect of CAF on the proliferation, invasion and migration of cancer cells via changing the expression of GPER.
The GPER, initially called GPR30, is an alternate estrogen receptor with a structure different from ERα and ERβ, and mainly mediates a rapid non-genomic response [19,20]. Recently, many studies indicated that GPER was related to the rapid actions exerted by estrogens [21-23]. Previous investigations verified that estrogenic GPER signaling could regulate the promotion effects in breast cancer and the tumor microenvironment [24-27]. Ernesto Cortes et al. demonstrated that tamoxifen could inhibit cell differentiation and invasion through regulating the GPER expression in pancreatic ductal adenocarcinoma (PDAC). GPER regulated the stromal function in tumor microenvironment of PDAC [28]. Overall, GPER is involved in the development of breast cancer through regulating the tumor microenvironment. Here, we found that GPER was down-regulated in the breast cancer tissues and cells. GPER expression in CAF was high than that in NF, which could promote the proliferation, invasion and migration of cancer cells.
CAF is the major component of tumor microenvironment and possess the ability of promoting the proliferation, migration and collagen secretion. CAFs are discovered in nearly all solid tumor tissues and functioned crucially in the progress of malignant cancer [29]. CAFs promoted the tumor progress through intercellular interaction or cross-talk with tumor cells by secreting growth factors, cytokines, and exosomes [30]. In this experiment, we demonstrated that high GPER expression in CAF presented high expression of Coll-1 compared with that in NF. In addition, GPER overexpression in CAF promoted the proliferation, invasion and migration of cancer cells.
In conclusion, our current study verified that GPER promoted proliferation, migration and invasion of TNBC cells through CAF. GPER expression was decreased in the breast cancer tissues and cells while GPER expression was increased in CAF compared with that in NF. And, GPER overexpression in CAF could promote the expression of Coll-1 while down-regulated GPER in CAF could inhibit the expression of Coll-1. In addition, up-regulated GPER in CAF could promote the proliferation, invasion and migration of cancer cells while down-regulated GPER in CAF was the opposite effect on cancer cells.
Acknowledgements
Jiangsu Provincial Medical Youth Talent from the Project of Invigorating Health Care through Science, Technology Education (QNRC2016661); Jiangsu Provincial Talent on Maternal and Child Health (FRC201759).
Disclosure of conflict of interest
None.
References
- 1.Hudis CA, Gianni L. Triple-negative breast cancer: an unmet medical need. Oncologist. 2011;16(Suppl 1):1–11. doi: 10.1634/theoncologist.2011-S1-01. [DOI] [PubMed] [Google Scholar]
- 2.Rae JM, Johnson MD. What does an orphan G-protein-coupled receptor have to do with estrogen? Breast Cancer Res. 2005;7:1–2. doi: 10.1186/bcr1330. [DOI] [PMC free article] [PubMed] [Google Scholar]
- 3.Prossnitz ER, Oprea TI, Sklar LA, Arterburn JB. The ins and outs of GPR30: a transmembrane estrogen receptor. J Steroid Biochem Mol Biol. 2008;109:350–353. doi: 10.1016/j.jsbmb.2008.03.006. [DOI] [PMC free article] [PubMed] [Google Scholar]
- 4.Filardo EJ, Graeber CT, Quinn JA, Resnick MB, Giri D, Delellis RA, Steinhoff MM, Sabo E. Distribution of GPR30, a seven membrane-spanning estrogen receptor, in primary breast cancer and its association with clinicopathologic determinants of tumor progression. Clin Cancer Res. 2006;12:6359–6366. doi: 10.1158/1078-0432.CCR-06-0860. [DOI] [PubMed] [Google Scholar]
- 5.Poola I, Abraham J, Liu A, Marshalleck JJ, DeWitty RL. The cell surface estrogen receptor, G protein-coupled receptor 30 (GPR30), is markedly down regulated during breast tumorigenesis. Breast Cancer. 2008;1:65–78. doi: 10.4137/bcbcr.s557. [DOI] [PMC free article] [PubMed] [Google Scholar]
- 6.Marx J. Cancer biology. All in the stroma: cancer’s cosa nostra. Science. 2008;320:38–41. doi: 10.1126/science.320.5872.38. [DOI] [PubMed] [Google Scholar]
- 7.Peng Q, Zhao L, Hou Y, Sun Y, Wang L, Luo H, Peng H, Liu M. Biological characteristics and genetic heterogeneity between carcinoma-associated fibroblasts and their paired normal fibroblasts in human breast cancer. PLoS One. 2013;8:e60321. doi: 10.1371/journal.pone.0060321. [DOI] [PMC free article] [PubMed] [Google Scholar]
- 8.Peng Q, Luo H, Sun Y, Peng H, Wang L, Zhao L, Liu M. Biological characteristics of carcinoma-associated fbroblasts in human breast cancer microenvironment. Tumor. 2013;33:855–861. doi: 10.1371/journal.pone.0060321. [DOI] [PMC free article] [PubMed] [Google Scholar]
- 9.Jung YY, Kim HM, Koo JS. The role of cancer-associated fibroblasts in breast cancer pathobiology. Histol Histopathol. 2015;31:371. doi: 10.14670/HH-11-700. [DOI] [PubMed] [Google Scholar]
- 10.El-Gendi SM, Mostafa MF, El-Gendi AM. Stromal caveolin-1 expression in breast carcinoma. Correlation with early tumor recurrence and clinical outcome. Pathol Oncol Res. 2011;18:459–469. doi: 10.1007/s12253-011-9469-5. [DOI] [PubMed] [Google Scholar]
- 11.Pula B, Jethon A, Piotrowska A, Gomulkiewicz A, Owczarek T, Calik J, Wojnar A, Witkiewicz W, Rys J, Ugorski M, Dziegiel P, Podhorska-Okolow M. Podoplanin expression by cancer-associated fibroblasts predicts poor outcome in invasive ductal breast carcinoma. Histopathology. 2011;59:1249–1260. doi: 10.1111/j.1365-2559.2011.04060.x. [DOI] [PubMed] [Google Scholar]
- 12.Hasebe T, Mukai K, Tsuda H, Ochiai A. New prognostic histological parameter of invasive ductal carcinoma of the breast: clinicopathological significance of fibrotic focus. Pathol Int. 2000;50:263–272. doi: 10.1046/j.1440-1827.2000.01035.x. [DOI] [PubMed] [Google Scholar]
- 13.De Francesco EM, Lappano R, Santolla MF, Marsico S, Caruso A, Maggiolini M. HIF-1α/GPER signaling mediates the expression of VEGF induced by hypoxia in breast cancer associated fibroblasts (CAFs) Breast Cancer Res. 2013;15:R64. doi: 10.1186/bcr3458. [DOI] [PMC free article] [PubMed] [Google Scholar]
- 14.Ren J, Guo H, Wu H, Tian T, Dong D, Zhang Y, Sui Y, Zhang Y, Zhao D, Wang S, Li Z, Zhang X, Liu R, Qian J, Wei H, Jiang W, Liu Y, Li Y. GPER in CAFs regulates hypoxia-driven breast cancer invasion in a CTGF-dependent manner. Oncol Rep. 2015;33:1929–37. doi: 10.3892/or.2015.3779. [DOI] [PubMed] [Google Scholar]
- 15.Foulkes WD, Smith IE, Reis-Filho JS. Triple-negative breast cancer. New Engl J Med. 2010;363:1938–1948. doi: 10.1056/NEJMra1001389. [DOI] [PubMed] [Google Scholar]
- 16.Carey L, Winer E, Viale G, Cameron D, Gianni L. Triple-negative breast cancer: disease entity or title of convenience? Nat Rev Clin Oncol. 2010;7:683–692. doi: 10.1038/nrclinonc.2010.154. [DOI] [PubMed] [Google Scholar]
- 17.Fulford LG, Reis JS, Ryder K, Jones C, Gillett CE, Hanby A, Easton D, Lakhani SR. Basal-like grade III invasive ductal carcinoma of the breast: patterns of metastasis and long-term survival. Breast Cancer Res. 2007;9:R4. doi: 10.1186/bcr1636. [DOI] [PMC free article] [PubMed] [Google Scholar]
- 18.Dent R, Hanna WM, Trudeau M, Rawlinson E, Sun P, Narod SA. Pattern of metastatic spread in triple-negative breast cancer. Breast Cancer Res Treat. 2009;115:423–428. doi: 10.1007/s10549-008-0086-2. [DOI] [PubMed] [Google Scholar]
- 19.Dennis MK, Burai R, Ramesh C, Petrie WK, Alcon SN, Nayak TK, Bologa CG, Leitao A, Brailoiu E, Deliu E. In vivo effects of a GPR30 antagonist. Nat Chem Biol. 2009;5:421. doi: 10.1038/nchembio.168. [DOI] [PMC free article] [PubMed] [Google Scholar]
- 20.Pupo M, Marcello M, Maria AM. GPER mediates non-genomic effects of estrogen. Methods Mol Biol. 2016;1366:471–488. doi: 10.1007/978-1-4939-3127-9_37. [DOI] [PubMed] [Google Scholar]
- 21.Ho MX. The involvement of estrogen receptor (ER) and G protein-coupled estrogen receptor (GPR30) in rapid cellular signaling of phytoestrogens in osteoblasts. Hong Kong Polytechnic University. 2014 [Google Scholar]
- 22.Prossnitz ER, Maggiolini M. Mechanisms of estrogen signaling and gene expression via GPR30. Mol Cell Endocrinol. 2009;308:32–38. doi: 10.1016/j.mce.2009.03.026. [DOI] [PMC free article] [PubMed] [Google Scholar]
- 23.Prossnitz ER, Barton M. The G-protein-coupled estrogen receptor GPER in health and disease. Nat Rev Endocrinol. 2011;7:715–26. doi: 10.1038/nrendo.2011.122. [DOI] [PMC free article] [PubMed] [Google Scholar]
- 24.Cirillo F, Pellegrino M, Malivindi R, Rago V, Avino S, Muto L, Dolce V, Vivacqua A, Rigiracciolo DC, De Marco P, Sebastiani A, Abonante S, Nakajima M, Lappano R, Maggiolini M. GPER is involved in the regulation of the estrogen-metabolizing CYP1B1 enzyme in breast cancer. Oncotarget. 2017;8:106608–106624. doi: 10.18632/oncotarget.22541. [DOI] [PMC free article] [PubMed] [Google Scholar]
- 25.Lappano R, Maggiolini M. GPER is involved in the functional liaison between breast tumor cells and cancer-associated fibroblasts (CAFs) J Steroid Biochem Mol Biol. 2018;176:49–56. doi: 10.1016/j.jsbmb.2017.02.019. [DOI] [PubMed] [Google Scholar]
- 26.De Marco P, Lappano R, De Francesco EM, Cirillo F, Pupo M, Avino S, Vivacqua A, Abonante S, Picard D, Maggiolini M. GPER signalling in both cancer-associated fibroblasts and breast cancer cells mediates a feedforward IL1β/IL1R1 response. Sci Rep. 2016;6:24354. doi: 10.1038/srep24354. [DOI] [PMC free article] [PubMed] [Google Scholar]
- 27.Rigiracciolo DC, Scarpelli A, Lappano R, Pisano A, Santolla MF, Avino S, De Marco P, Bussolati B, Maggiolini M, De Francesco EM. GPER is involved in the stimulatory effects of aldosterone in breast cancer cells and breast tumor-derived endothelial cells. Oncotarget. 2016;7:94–111. doi: 10.18632/oncotarget.6475. [DOI] [PMC free article] [PubMed] [Google Scholar]
- 28.Cortes E, Sarper M, Robinson B, Lachowski D, Chronopoulos A, Thorpe SD, Lee DA, Del Rio Hernandez AE. GPER is a mechanoregulator of pancreatic stellate cells and the tumor microenvironment. EMBO Rep. 2019;20:e46556. doi: 10.15252/embr.201846556. [DOI] [PMC free article] [PubMed] [Google Scholar]
- 29.Liu M, Casimiro MC, Wang C, Shirley LA, Jiao X, Katiyar S, Ju X, Li Z, Yu Z, Zhou J, Johnson M, Fortina P, Hyslop T, Windle JJ, Pestell RG. p21CIP1 attenuates Ras- and c-Myc-dependent breast tumor epithelial mesenchymal transition and cancer stem cell-like gene expression in vivo. Proc Nati Acad Sci U S A. 2009;106:19035–19039. doi: 10.1073/pnas.0910009106. [DOI] [PMC free article] [PubMed] [Google Scholar]
- 30.Lee TH, D’Asti E, Magnus N, Al-Nedawi K, Meehan B, Rak J. Microvesicles as mediators of intercellular communication in cancer-the emerging science of cellular ‘debris’. Semin Immunopathol. 2011;33:455–467. doi: 10.1007/s00281-011-0250-3. [DOI] [PubMed] [Google Scholar]


