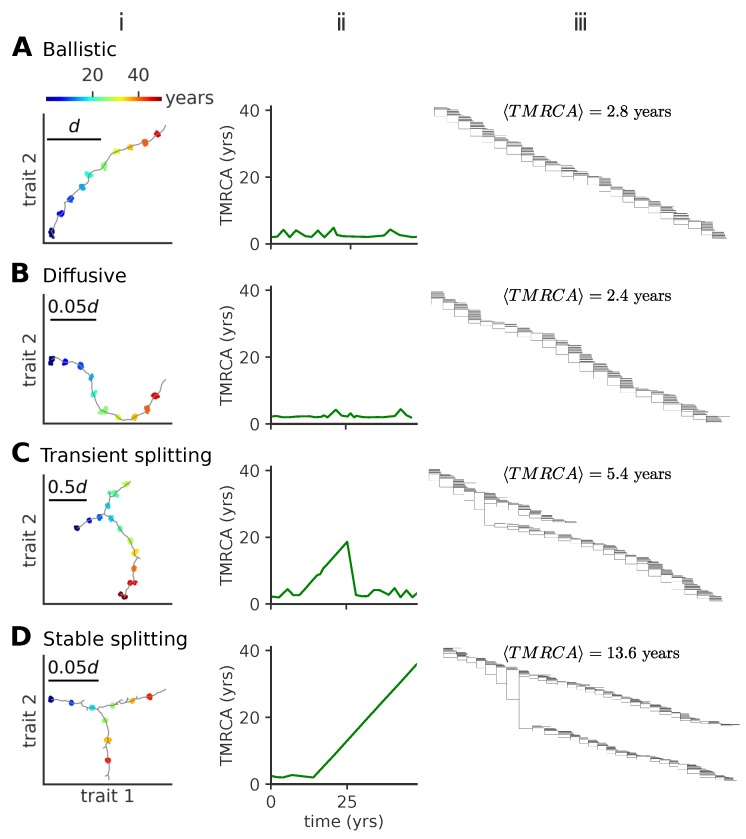
Figure 2.
Modes of antigenic evolution: (A) ballistic regime, (B) diffusive regime, (C) transient splitting regime, and (D) stable splitting regime. (i): examples of trajectories of the population in phenotypic space (in units of d); (ii): the time to most recent common ancestor (TMRCA); (iii): phylogenetic tree of the population across time. In (iii), we give the mean TMRCA for the plotted sample trees. When viruses evolve in a single lineage, the phylogenetic tree shows a single trunk dominating evolution. When viruses split into more lineages, the phylogenetic tree shows different lineages evolving independently. Each lineage diffuses in phenotypic space with a persistence length that depends itself on the model parameters. In these simulations, viral population size is not constrained, but parameters are tuned to approach a target fraction of infected hosts, . Parameters are (A) , , (B) , (C) , , (D) , .

