

Abstract
The ATP-binding cassette transporter P-glycoprotein (P-gp) is known to limit both brain penetration and oral bioavailability of many chemotherapy drugs. Although US Food and Drug Administration guidelines require that potential interactions of investigational drugs with P-gp be explored, often this information does not enter the literature. In response, we developed a high-throughput screen to identify substrates of P-gp from a series of chemical libraries, testing a total of 10,804 compounds, most of which have known mechanisms of action. We used the CellTiter-Glo viability assay to test library compounds against parental KB-3-1 human cervical adenocarcinoma cells and the colchicine-selected subline KB-8-5-11 that overexpresses P-gp. KB-8-5-11 cells were also tested in the presence of a P-gp inhibitor (tariquidar) to assess reversibility of transporter-mediated resistance. Of the tested compounds, a total of 90 P-gp substrates were identified, including 55 newly identified compounds. Substrates were confirmed using an orthogonal killing assay against human embryonic kidney-293 cells overexpressing P-gp. We confirmed that AT7159 (cyclin-dependent kinase inhibitor), AT9283, (Janus kinase 2/3 inhibitor), ispinesib (kinesin spindle protein inhibitor), gedatolisib (PKI-587, phosphoinositide 3-kinase/mammalian target of rampamycin inhibitor), GSK-690693 (AKT inhibitor), and KW-2478 (heat-shock protein 90 inhibitor) were substrates. In addition, we assessed direct ATPase stimulation. ABCG2 was also found to confer high levels of resistance to AT9283, GSK-690693, and gedatolisib, whereas ispinesib, AT7519, and KW-2478 were weaker substrates. Combinations of P-gp substrates and inhibitors were assessed to demonstrate on-target synergistic cell killing. These data identified compounds whose oral bioavailability or brain penetration may be affected by P-gp.
SIGNIFICANCE STATEMENT
The ATP-binding cassette transporter P-glycoprotein (P-gp) is known to be expressed at barrier sites, where it acts to limit oral bioavailability and brain penetration of substrates. In order to identify novel compounds that are transported by P-gp, we developed a high-throughput screen using the KB-3-1 cancer cell line and its colchicine-selected subline KB-8-5-11. We screened the Mechanism Interrogation Plate (MIPE) library, the National Center for Advancing Translational Science (NCATS) pharmaceutical collection (NPC), the NCATS Pharmacologically Active Chemical Toolbox (NPACT), and a kinase inhibitor library comprising 977 compounds, for a total of 10,804 compounds. Of the 10,804 compounds screened, a total of 90 substrates were identified of which 55 were novel. P-gp expression may adversely affect the oral bioavailability or brain penetration of these compounds.
Introduction
The ATP-binding cassette (ABC) P-glycoprotein transporters [P-gp, encoded by the MDR1 gene and later renamed ABC family member B1 (ABCB1)] and ABC family member G2 (ABCG2, or breast cancer resistance protein, encoded by the ABCG2 gene) play major roles in limiting the oral bioavailability of compounds and preventing drug ingress at the blood-brain barrier (BBB) by keeping toxins, drugs, and other compounds out of the brain (Gottesman et al., 2016). Soon after its identification as a drug transporter, P-gp was found to be expressed in the small intestine and colon, liver, pancreas, and kidney (Thiebaut et al., 1987), and pharmacokinetic studies in mice deficient for one of the murine homologs of human ABCB1, Mdr1a (renamed Abcb1a), demonstrated increased bioavailability of orally administered paclitaxel compared with wild-type mice (Sparreboom et al., 1997). Likewise, ABCG2 was detected in the small intestine and colon (Maliepaard et al., 2001; Fetsch et al., 2006) and the role of ABCG2 in limiting oral uptake of topotecan was confirmed in mice lacking Abcg2, the murine homolog of ABCG2 (Jonker et al., 2000; Basseville et al., 2016).
In addition to being highly expressed in the gastrointestinal tract, in the brush border of renal proximal tubule cells, and on the apical surface of hepatocytes (Thiebaut et al., 1987; Fetsch et al., 2006; Huls et al., 2008), both P-gp and ABCG2 are expressed at high levels on the apical side of capillary endothelial cells in the brain (Thiebaut et al., 1987, 1989; Cordon-Cardo et al., 1989; Cooray et al., 2002). The protective role of P-gp was demonstrated in 1994 when Schinkel et al. (1994) found that deletion of Abcb1a in mice resulted in acute sensitivity to the acaricide ivermectin owing to a 90-fold increase in brain penetration of the drug. Brain penetration of the P-gp substrate drug vinblastine was increased 20-fold in Abcb1a-deficient mice (Schinkel et al., 1994). Subsequent to the discovery of ABCG2, mice deficient in the two murine homologs of human ABCB1 (Abcb1a/1b) and Abcg2 were generated. The murine models highlighted a compensatory and possibly a cooperative role for the two transporters at the BBB, limiting the brain penetration of chemotherapeutic agents, in particular kinase inhibitors (Basseville et al., 2016). In a recent example, 24 hours after mice were given an oral dose of the BCR-ABL kinase inhibitor ponatinib, mice lacking Abcg2 expression had a 2.2-fold increase in brain concentration compared with wild-type mice, mice lacking Abcb1a/1b had a 1.9-fold increase, and mice lacking Abcb1a/1b and Abcg2 had a 25.5-fold increase (Kort et al., 2017). The mouse studies highlight not only the protective and complementary role of the transporters at the BBB but also their importance in thwarting effective delivery of chemotherapy to the brain (Robey et al., 2018). However, mouse models may slightly overestimate the contribution of P-gp at the human BBB, owing to higher levels at the mouse BBB (Chu et al., 2013).
Because transporters affect drug efficacy and pharmacokinetics, it is important to know which compounds are substrates. This can affect decisions on how a drug is administered or whether the drug might be effective in the treatment of neurologic diseases, and against drug-resistant tumor cells. This information is also valuable for designing preclinical efficacy studies in mice. Although the FDA offers guidelines for determining the interaction of investigational drugs with P-gp and ABCG2 (Lee et al., 2017), often these critical data are not published.
We implemented a systematic screen to identify cytotoxic substrates of P-gp. To do so, we developed high-throughput assays to examine differential cell killing between drug-naive cancer cell lines and drug-selected P-gp-overexpressing sublines. We screened several libraries of annotated compounds, including the National Center for Advancing Translational Science (NCATS) Pharmaceutical Collection (NPC), a comprehensive collection of all clinically approved drugs, along with small molecules with known mechanisms of action—either as small-molecule probes or experimental therapeutics designed to modulate a wide range of targets, including many small molecules developed for oncology indications. Mechanistic annotation of these compounds can provide valuable insight into targets or pathways that appear to have been rendered more sensitive to inhibition in the course of developing multidrug resistance. Hits from the primary screen were assessed against human embryonic kidney (HEK) cells overexpressing P-gp in the absence and presence of the P-gp inhibitor tariquidar. Top substrates were tested in a cell-killing synergy experiment with the inhibitors tariquidar or elacridar, demonstrating the consistent inhibition of P-gp by inhibitors irrespective of substrate.
Materials and Methods
Cell Lines.
The HeLa-derivative cell line KB-3-1 and its colchicine-selected, P-gp-overexpressing subline KB-8-5-11 (Shen et al., 1986) were maintained in Dulbecco’s modified Eagle’s medium with 10% fetal calf serum (FCS) and penicillin/streptomycin with glutamine at 37°C in 5% CO2. For KB-8-5-11 cells, colchicine was added to the medium at a concentration of 100 ng/ml. HEK-293 cells transfected with empty vector plasmid control DNA (pcDNA) or vector containing human ABCB1 (MDR-19) or ABCG2 (R-5) have been described previously (Robey et al., 2011) and were maintained in Eagle’s minimum essential medium supplemented with 10% FCS, penicillin/streptomycin, and glutamine with 2 mg/ml G418 to select for the expression of the transporter. Cultures were confirmed to be free of mycoplasma infection using the MycoAlert Mycoplasma Detection Kit (Lonza, Walkersville, MD). For the screen, assay medium was identical to culture medium except for KB-8-5-11, for which colchicine was excluded from the medium.
Screening Libraries.
The libraries that were used for the screen included the Mechanism Interrogation Plate (MIPE) composed of 1912 compounds (Mathews Griner et al., 2014), the NCATS pharmaceutical collection comprising 2816 compounds (Huang et al., 2011), the NCATS Pharmacologically Active Chemical Toolbox (NPACT) (Davis et al., 2016) composed of 5099 compounds, and a kinase inhibitor library comprising 977 compounds, for a total of 10,804 compounds.
High-Throughput Screen.
All cell lines were plated into 1536-well plates at 500 cells/well in 5 μl of media. Compounds were then pinned in dose-response using a 1536-head pin tool (Kalypsis, San Diego, CA), and plates were incubated at 37°C in 5% CO2 for an additional 72 hours. CellTiter-Glo reagent (Promega) was dispensed into the wells, incubated for 5 minutes, and luminescence was read on a ViewLux instrument (Perkin-Elmer). To determine compound activity in the quantitative high-throughput screen (HTS) assay, the concentration-response data for each sample was plotted and modeled by a four-parameter logistic fit yielding IC50 and efficacy (maximal response) values as previously described (Inglese et al., 2006). Usually the quantitative HTS screen yielded hits with a wide range of potencies and with substantial variation in the quality of the corresponding concentration-response curves (CRCs) (efficacy and number of asymptotes), which included samples associated with shallow curves or single-point extrapolated concentration responses; these were assigned the status of low-confidence actives. In brief, classes −1.1 and −1.2 were the highest-confidence complete CRCs containing upper and lower asymptotes with efficacies ≥80% and <80%, respectively. Classes −2.1 and −2.2 were incomplete CRCs having only one asymptote with efficacy ≥80% and <80%, respectively. Class -3 CRCs showed activity at only the highest concentration or were poorly fit. Class 4 CRCs were inactive, having a curve-fit of insufficient efficacy or lacking a fit altogether. High-confidence cytotoxic compounds were defined as those that yielded curve classes of −1.1, −1.2, −2.1, −2.2, a maximum response of ≥50%, and a concentration for half-maximal activity derived from the Hill equation model (AC50) of ≤10 μM.
Compounds were further clustered hierarchically using TIBCO Spotfire 6.0.0 (Spotfire Inc., Cambridge, MA; https://spotfire.tibco.com/) on the basis of their activity outcomes from the primary or follow-up screen across different cell lines. Area-under-the-curve (AUC) for each compound was calculated on the basis of the quantitative HTS data analysis, and curve fittings were used for clustering. In the heatmap, darker color indicates compounds that are more potent and efficacious, i.e., high-quality actives, and lighter color indicates less potent and efficacious compounds. If a compound showed no activity in an assay, it was highlighted as white in the heatmap.
Cherry-picked hits from screening analysis were tested with both the KB pair of cell lines and the HEK pair of cell lines in the absence and presence of tariquidar. Confirmatory 3-day cytotoxicity assays were also performed by plating pcDNA, MDR-19, or R-5 cells in 96-well, opaque white plates at a density of 5000 cells/well and allowing them to attach overnight. Compounds were added at increasing concentrations and incubated with the cells for 72 hours, after which plates were analyzed using CellTiter-Glo according to the manufacturer’s instructions. GI50 (50% growth inhibitory concentration) values were obtained by determining the drug concentration for which the luminescence value was 50% of that obtained for untreated cells.
Synergy Experiments.
Synergy screens were performed with a subset of P-gp substrates identified by HTS in combination with the P-gp inhibitors tariquidar or elacridar. Plating of compounds in matrix format using acoustic droplet ejection and numerical characterization of synergy, additivity, and/or antagonism were conducted as described previously (Mathews Griner et al., 2014; Martinez et al., 2016). Briefly, compounds were plated as a 10 × 10 dose-response combination matrix. Concentration ranges were selected from single-agent dose-response curves generated from the HTS. Compounds were acoustically dispensed (10 nl/well) using an ATS-100 (EDC Biosystems) onto 1536-well, white, solid-bottom, tissue culture–treated plates. KB-3-1 and KB-8-5-11 cells were subsequently added to the plates (500 cells/well in 5 μl) and incubated for 72 hours at 37°C with 5% CO2 under 85% humidity. Cell viability was determined by the addition of 2.5 μl of CellTiter-Glo to each well. After a 15-minute incubation at room temperature, each sample’s luminescence intensity was measured using a ViewLux reader. Dimethyl sulfoxide (DMSO; 20 nl) and bortezomib (20 nl at 2.3 mM) were used as negative and positive controls, respectively. All P-gp substrates listed in Table 1 were tested against the P-gp inhibitors tariquidar and elacridar. Viability resulting from a single agent or combination was normalized to a separate negative control column (20 nl DMSO). The synergies were characterized using the Bliss independence model and summarized using the DBSumNeg metric. In brief, the Bliss independence model expected no mechanistic interaction between two tested compounds. Therefore, the viability from an additive dose combination (Cadditive) is the multiplication of factional viability upon treatment of compounds X and Y individually, Cadditive = X × Y (0 ≤ X ≤ 1, 0 ≤ Y ≤ 1). The difference between measured viability and expected viability from an additive dose combination (Cmeasured − Cadditive), so called deltaBliss (DB), describes the additivity (DB = 0), synergy (DB < 0), or antagonistism (DB > 0). To evaluate the overall synergy from all 81 dose combinations we tested in a 10 × 10 block and we calculated DBSumNeg as the sum of all negative DB.
TABLE 1.
Cross-resistance profile for novel P-gp substrates in P-gp- or ABCG2-expressing cells
All compounds were tested in triplicate. Results presented are mean GI50 values ± S.D.
| Compound | Structure | GI50 pcDNA | GI50 MDR-19 | RRa P-gp | GI50 R-5 | RRa ABCG2 |
|---|---|---|---|---|---|---|
| μM | μM | μM | ||||
| AT7519 |  |
0.61 ± 0.07 | 66.7 ± 28.2 | 110 | 2.3 ± 0.2 | 4 |
| AT9283 |  |
2.7 ± 0.1 | 34.8 ± 6.8 | 13 | 60.8 ± 1.9 | 22 |
| Ispinesib |  |
0.044 ± 0.037 | 2.8 ± 0.5 | 64 | 0.14 ± 0.09 | 3 |
| Gedatolisib | 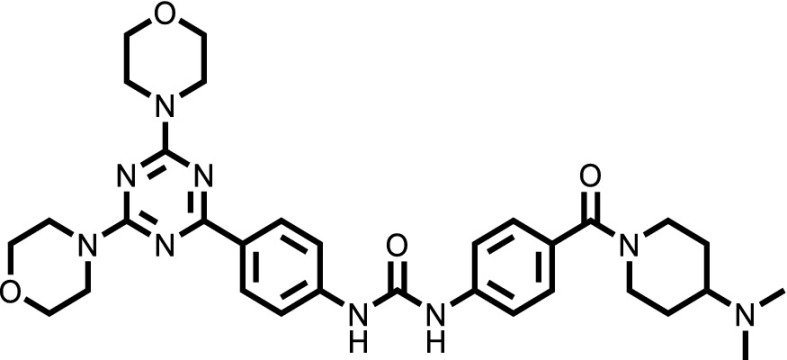 |
0.028 ± 0.007 | 47.2 ± 12.8 | 1672 | 2.0 ± 0.3 | 70 |
| GSK-690693 |  |
0.19 ± 0.03 | 56.2 ± 18.8 | 290 | 11.6 ± 1.8 | 60 |
| KW-2478 | 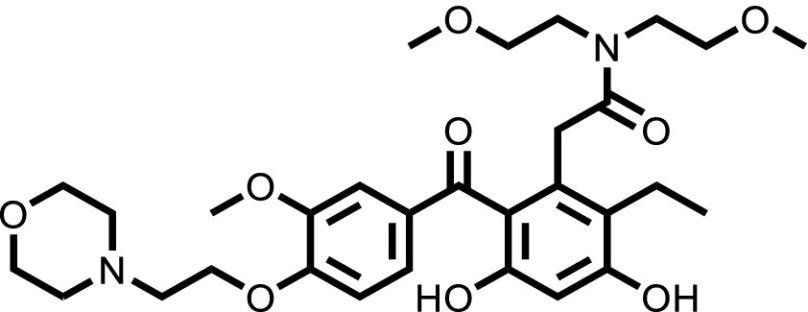 |
0.48 ± 0.04 | 129.7 ± 27.5 | 270 | 4.5 ± 0.2 | 9 |
Relative resistance (RR) value is the ratio of the GI50 (50% growth inhibitory concentration) values of P-gp- or ABCG2-expressing cells (MDR-19 or R-5) to the GI50 value of pcDNA cells.
ATPase Assay.
The ATPase assay was performed as described previously (Ambudkar, 1998). Briefly, crude membrane protein (100 μg/ml) was isolated from Hi-Five insect cells expressing human P-gp. The vanadate-sensitive activity was calculated by assaying the end-point phosphate-release in the absence and presence of vanadate. Briefly, solutions were prepared containing 4.0 μg of total membrane protein in 100 μl of ATPase assay buffer (50 mM MES-Tris pH 6.8, 50 mM KCl, 5 mM sodium azide, 1 mM EGTA, 1 mM ouabain, 2 mM dithiothreitol, 10 mM MgCl2) with 1% DMSO solvent alone (basal activity) or with variable concentrations (0.1, 1, or 10 μM) of the substrates in DMSO. The tubes were incubated for 3 minutes at 37°C, after which the reaction was initiated by addition of 5 mM ATP. After 20 minutes, the reaction was stopped by the addition of 2.5% SDS. The amount of inorganic phosphate released was quantified by a colorimetric method, as previously described (Ambudkar, 1998). Significance between various treatments was determined by a one-way analysis of variance followed by a Dunnet test for multiple comparisons. A P value of less than 0.05 was considered significant.
Flow Cytometry.
Transport assays were conducted as described previously (Robey et al., 2004). To measure inhibition of P-gp-mediated transport, trypsinized MDR-19 cells were incubated in phenol red-free improved minimum essential medium supplemented with 10% FCS, penicillin/streptomycin, and glutamine, containing 0.5 μg/ml rhodamine 123 (Sigma-Aldrich, St. Louis, MO) in the presence or absence of selected compounds at 25 μM concentration identified by the screen for 30 minutes at 37°C in 5% CO2. The medium was then removed and replaced with complete medium with or without the compound for an additional 1 hour. Valspodar (Apex Biotechnology, Houston, TX) at 3 μg/ml served as a positive control for P-gp inhibition. For ABCG2-mediated transport, R-5 cells were incubated in a similar fashion, except 5 μM pheophorbide A (PhA; Frontier Scientific, Logan, UT) was used as the substrate and 10 μM fumitremorgin C (synthesized by the NIH Chemical Biology Laboratory, Bethesda, MD) served as the positive control for ABCG2 inhibition. Samples were analyzed on a FACSCanto II flow cytometer (BD Biosciences, San Jose, CA) in which rhodamine fluorescence was detected with a 488-nm argon laser and a 530-nm bandpass filter and pheophorbide A was detected using a 635-nm red diode laser and a 670-nm filter. At least 10,000 events were collected for each sample.
Results
High-Throughput Screen to Identify P-gp Substrates.
To identify novel substrates of P-gp, we used the CellTiter-Glo luminescent cell viability assay to test library compounds against three cell conditions: 1) the parental KB-3-1 human cervical adenocarcinoma cell line (a HeLa clone); 2) the drug-resistant subline KB-8-5-11 that overexpresses P-glycoprotein; and 3) the KB-8-5-11 cell line in the presence of the P-gp inhibitor tariquidar (which should restore sensitivity to P-gp substrates). Overall, 10,804 compounds were tested from across four annotated small-molecule libraries. The NCATS Pharmaceutical Collection is a library of compounds approved for use by the Food and Drug Administration and related agencies in foreign countries. The NPACT library contains preclinical and probe compounds from across disease areas. The kinase inhibitor library contains almost 1000 small-molecule inhibitors of kinases with known mechanisms of action. The MIPE library contains oncology-focused compounds with known mechanisms of action.
The basis of the screen design was the fundamental principle of P-gp-mediated drug resistance: Substrates that kill or inhibit growth of KB-3-1 were expected to demonstrate reduced efficacy against the KB-8-5-11 cells owing to drug efflux by P-gp. P-gp-specific efflux could be demonstrated by sensitization of KB-8-5-11 cells in the presence of the P-gp inhibitor tariquidar. As a cell viability assay was used for this screen, a limitation of the screen was that only cytotoxic or cytostatic P-gp substrates could be identified. Of 10,804 compounds tested, 1362 compounds demonstrated cytotoxicity toward the KB-3-1 cells, of which 90 compounds were identified as putative P-gp substrates (Fig. 1A). In total, 13% of all compounds tested demonstrated cytotoxicity toward the parental KB-3-1 cell line. Among the four libraries, the kinase inhibitor library (30%) and oncology-focused MIPE library (21%) contained the greatest proportion of cytotoxic compounds, followed by the NPACT library (10%) (Fig. 1B). As one might anticipate, the NPC library of therapeutic agents contained the lowest proportion of cytotoxic compounds (5%).
Fig. 1.

Overview of high-throughput screening data. (A) Hit triage from HTS library screen (10,804 compounds), to compounds that are cytotoxic toward parental KB-3-1 cells (1362 compounds), to putative P-gp substrates (90 compounds). (B) Summary of percentage of cytotoxic compounds (orange) vs. nontoxic compounds (blue), both cumulative and represented in each library screened. (C) Area-under-the-curve heatmap of compound activity for screen hits, where red intensity represents magnitude of AUC: Deep red is strongest cytotoxicity, and white represents no cytotoxicity.
A comparison of the global response of the two cell lines to the library compounds was undertaken by assessing the area-under-the-curve for each compound against each cell line (Fig. 1C). The AUC of the dose-response curve ensures both efficacy (magnitude of cell killing) and potency (concentration that elicits cell killing) are accounted for in the analysis of activity (Fig. 1A). The KB-3-1 cell line was more sensitive than the KB-8-5-11 cell line for a number of compounds, shown in Fig. 1C, where darker red correlates with greater sensitivity to a given compound (the compound is more cytotoxic), whereas lighter colors correlate with more resistance. This is consistent with the multidrug-resistant nature of the KB-8-5-11 cell line.
To pinpoint substrates identified by the HTS, the difference in AUC between KB-3-1 and KB-8-5-11 cells was determined. As an example, the HTS dose-response curves for vincristine (a known P-gp substrate) are displayed in Fig. 2A for all three conditions screened. As cell-killing assays involve loss of signal, data were analyzed from 0% (positive control signal) to −100% (complete cell killing/growth inhibition). The data represented in Fig. 2A are usual for HTS data analysis but not normal for displaying cell killing data—elsewhere in this manuscript, data are displayed as is traditional for cell-killing assays with 100% as control cell viability and 0% as total cell death. The difference (delta) between the AUC for the sensitive KB-3-1 cell line (black line) and the resistant KB-8-5-11 cell line (red line) was determined (termed ΔAUC1, Fig. 2A), and the greater the magnitude of ΔAUC1, the stronger the substrate effect of P-gp. This strategy is distinct from the commonly applied method used to discern P-gp substrates by comparing the IC50 values derived from dose-response curves. The difference between KB-8-5-11 cells with (blue line) and without (red line) the P-gp inhibitor tariquidar (1 μM) was also assessed to confirm P-gp substrates (termed ΔAUC2). The P-gp primary high-throughput screening data for KB-3-1 and KB-8-5-11 cell lines against NPC, NPACT, MIPE, and kinase libraries was deposited in PubChem with AIDs 1346986 and 1346987, respectively. Assay data can be accessed via the following links: https://pubchem.ncbi.nlm.nih.gov/assay/assay.cgi?aid=1346986 for the KB-3-1 cell line, and https://pubchem.ncbi.nlm.nih.gov/assay/assay.cgi?aid=1346987 for the KB-8-5-11 cell line.
Fig. 2.

Summary of P-gp substrate analysis. (A) Summary of data analysis. For each compound, data are displayed as “loss of signal from baseline,” where −100% represents total cell killing. KB-3-1 cells are sensitive (black), KB-8-5-11 cells are resistant (red) but sensitized when P-gp inhibitor tariquidar is added (blue), left. To perform HTS data analysis, AUCs were determined for the parent and resistant lines, and the difference in AUC (termed ΔAUC) was used to identify putative substrates. ΔAUC1 is the difference in AUC in the KB-3-1 (black line) sensitive cells compared with KB-8-5-11 (red line) resistant cells (center); ΔAUC2 is the difference in AUC of KB-8-5-11 resistant cells in the absence (red line) and presence (blue line) of tariquidar (right). Comparison of the AUC for substrates calculated using ΔAUC1 and ΔAUC2, assessing (B) rank order of substrates (where largest ΔAUC is strongest substrate) and (C) orthogonal data generated testing P-gp substrates against HEK cells. (D) Unsupervised clustering of compound activity against parent and resistant lines (with and without tariquidar), where deep red represents greatest cytotoxicity.
Following plating of hits and retesting for confirmation, a total of 90 P-gp substrates were identified (Supplemental Table 1) on the basis of a ΔAUC1 cut-off value of 50. Comparison of identified substrates with the literature revealed that 35 known P-gp substrates were identified in the screen and 55 new substrates were identified. Comparison of ΔAUC1 and ΔAUC2 for all substrates revealed a strong correlation between parental cells and inhibited KB-8-5-11 cells in which P-gp was inhibited with tariquidar (Fig. 2B). To confirm that the putative P-gp substrates were not attributable to cell line-specific alterations, an orthogonal assay testing all hits against HEK-293 cells stably transfected with either pcDNA or a plasmid expressing ABCB1 (MDR-19) was conducted and ΔAUC1 was calculated. A correlation was demonstrated between the KB-3-1/KB-8-5-11 ΔAUC1 and the pcDNA/MDR-19 ΔAUC1 (Fig. 2C). Unsupervised clustering of global cell response to the 90 substrates identified for the three KB and three HEK conditions (parent, resistant, resistant with tariquidar) demonstrated a consistent pattern, with the KB-8-5-11 and MDR-19 cell lines less sensitive to compounds compared with their parental partners, and the parent lines clustering with the resistant cell lines in the presence of tariquidar (Fig. 2D).
Assessment of P-gp Substrates.
To confirm that the HTS assay and analysis strategy identifies substrates, we assessed the cell-killing activity of three known substrates included in the library (target in brackets): paclitaxel [tubulin] (Greenberger et al., 1988), vincristine [tubulin] (Horton et al., 1987), and mithramycin [RNA synthesis] (Biedler and Riehm, 1970) (Fig. 3, A–C, respectively). Examples of the dose-response curves for three newly identified substrates are PKI-402 [PI3K/mTOR] (Dehnhardt et al., 2010), CB300919 [NAMPT] (Bavetsias et al., 2002), and PHA-793887 [CDK1/2/4] (Brasca et al., 2010) (Fig. 3, D–F, respectively). In each case, a strong difference in cell killing between parent and resistant cells was found.
Fig. 3.

Representative examples of known (A–C) and newly identified (D–F) substrates of P-gp as determined by the screen.
To confirm that the newly identified substrates were indeed P-gp substrates, we performed confirmatory cytotoxicity assays in the laboratory using pcDNA and MDR-19 cells. We selected six commercially available, newly identified P-gp substrates: AT7159, a cyclin-dependent kinase (CDK) inhibitor; AT9283, a Janus kinase (JAK)2/3 inhibitor; ispinesib, a kinesin spindle protein inhibitor; gedatolisib (PKI-587), a PI3K/mTOR inhibitor; GSK-690693, an AKT inhibitor; and KW-2478, an HSP90 inhibitor. In addition, we examined the ability of ABCG2 to confer resistance on the compounds using ABCG2-overexpressing R-5 cells. As shown in Table 1, all of the compounds were confirmed to be P-gp substrates, with P-gp expression conferring less resistance to AT9283 (13-fold) but conferring very high levels of resistance to gedatolisib (1672-fold). All of the compounds were also found to be ABCG2 substrates to varying degrees. In the case of AT9283, GSK-690693, and gedatolisib, ABCG2 conferred relatively high levels of resistance, whereas ispinesib, AT7519, and KW-2478 were preferentially transported by P-gp.
Effect of Newly Identified Substrates on ATPase Activity of P-gp.
The ability of substrates to stimulate the ATPase activity of P-gp was assessed. Some kinase inhibitors that are P-gp substrates have been shown to significantly stimulate the ATPase activity of P-gp, whereas others do not (Hegedus et al., 2009). The ATPase assay is regularly used to confirm the binding of a substrate to the protein; inhibitors tend to decrease the ATPase activity, transport substrates generally enhance the ATPase activity. However, not all substrates increase ATPase activity.
We omitted AT9283 from this assay, as P-gp conferred the lowest levels of resistance on this compound. The vanadate-sensitive ATPase activity of P-gp in the presence of 0.1, 1, or 10 μM concentrations of each compound was compared with the basal activity (activity in the presence of 1% DMSO). As observed in Fig. 4, A–E, we found that ispinesib stimulated ATPase activity in a concentration-dependent manner. Ispinesib stimulated the ATPase activity by >2.6 fold at concentrations greater than 1 μM (1.6-fold at 0.1 μM). KW-2478 was also capable of stimulating the ATPase activity but only at higher concentrations (10 μM) and only up to 1.4-fold. The rest of the compounds did not significantly affect the ATPase activity in the range of concentrations tested. As a positive control, verapamil at 10 μM was shown to increase the ATPase activity of P-gp by approximately 2.5-fold (Fig. 4F).
Fig. 4.

Effects of novel P-gp substrates on ATPase activity. The vanadate-sensitive activity of P-gp was determined as outlined in Materials and Methods. Basal P-gp ATPase activity was compared with activity in the presence of 0.1, 1, or 10 μM concentrations of the substrates (A) ispinesib, (B) KW-2478, (C) GSK-690693, (D) AT7519 or (E) gedatolisib. Verapamil (F) is shown as a positive control. Graphs depict average values from three independent experiments (error bars ± S.D.). Significance was determined by a one-way analysis of variance followed by a Dunnet test for multiple comparisons. Asterisks denote significant difference from the control, where P < 0.05 (*); P < 0.01 (**).
P-gp Inhibitors Synergize with Substrates.
P-gp substrates were identified during the HTS in part by cotreatment of P-gp-expressing cells with the inhibitor tariquidar at a concentration (1 μM) shown to fully inhibit P-gp, to demonstrate P-gp-specific resistance. To explore the nature of inhibitor-mediated sensitization of substrates, we assessed 10 × 10 combinations of tariquidar or elacridar with 15 P-gp substrates identified from the screen (Table 2). Viability was again measured using CellTiter-Glo, and the Bliss independence model was used to characterize the presence or absence of synergy for each combination, where negative ΔBliss represents synergy, and positive ΔBliss represents antagonism. We hypothesized that inhibitors should antagonize P-gp transport of substrates in P-gp-expressing cells, and that this approach could be used to compare the efficacy of P-gp inhibitors in combination with a range of substrates. This approach has not been previously adopted for studying ABC transporter inhibitors.
TABLE 2.
P-gp substrates tested in combination with elacridar and tariquidar
| Compound | Mechanism of Action |
|---|---|
| Mithramycin A | Alcohol dehydrogenase inhibitor |
| Danusertib | Aurora-A/B/C kinase inhibitor |
| Tozasertib | Aurora-A/B/C kinase inhibitor |
| PHA-793887 | CDK1,2,3,4,5 inhibitor |
| Romidepsin | Histone deacetylase (HDAC) inhibitor |
| JNK-IN-7 | JNK inhibitor |
| PKI-587 | mTOR inhibitor |
| CB 300919 | NAMPT inhibitor |
| AST-487 | RET kinase inhibitor |
| Sepantronium bromide | Survivin inhibitor |
| Docetaxel | Tubulin polymerization promoter |
| Paclitaxel | Tubulin polymerization promoter |
| Vinorelbine | Tubulin polymerization inhibitor |
| RO495 | Tyk 2 inhibitor |
| RA-XII | N/A (Natural product) |
CDK, cyclin-dependent kinase.
The effect of both tariquidar and elacridar across all substrates was uniform. Paclitaxel is shown as an example. Parental KB-3-1 cells were sensitive to paclitaxel (black = 100% viable, red = 0% viable), and this sensitivity was unaffected by addition of elacridar up to a concentration of 20 μM (Fig. 5A). This is exemplified by the absence of any strong synergy (red) or antagonism (blue) (Fig. 5A), and in paclitaxel dose-response curves extracted from the 10 × 10 block (Fig. 5B). This relationship was observed for both inhibitors in combination with every P-gp substrate tested against parental cells. Elacridar and tariquidar alone had no effect on cell viability. The 10 × 10 blocks for parental KB-3-1 cells are available at https://tripod.nih.gov/matrix-client/rest/matrix/blocks/8067/table.
Fig. 5.

Substrate synergy with P-gp inhibitors. Sample combination of elacridar and paclitaxel tested in 10 × 10 dose-response matrices with KB-3-1 (A and B) and KB-8-5-11 (C and D). (A and C) Left, percent response of cell viability where red = cell death, black = cell survival. (A and C) Right, matrix plot in ΔBliss model, magenta = synergy. (B and D) Dose-response curves extracted from synergy blocks for paclitaxel with increasing concentrations of elacridar. Dose-response curves for (E) tariquidar and (F) elacridar for all substrates tested (listed in Table 2). Values in parentheses are the log of the molar concentration of tariquidar or elacridar needed to achieve maximum cell killing when combined with the noted drugs.
In contrast, the P-gp substrates demonstrated maximal synergy in combination with elacridar and tariquidar in P-gp-expressing KB-8-5-11 cells. The combination of paclitaxel and elacridar is shown as an example (Fig. 5, C and D). In the absence of elacridar, paclitaxel demonstrated minimal cytotoxicity toward KB-8-5-11 cells, but addition of elacridar sensitized the cells to paclitaxel, with near-maximal effects at 82 nM concentration and higher. Dose-response curves from the 10 × 10 block demonstrated the sensitization of KB-8-5-11 cells to paclitaxel with increasing elacridar concentration (Fig. 5C), and this sensitization was accompanied by maximal synergy. Synergy was observed for both inhibitors in combination with every P-gp substrate tested against P-gp-expressing KB-8-5-11 cells. The 10 × 10 blocks for P-gp-expressing KB-8-5-11 cell are available at https://tripod.nih.gov/matrix-client/rest/matrix/blocks/8069/table.
To ascertain the inhibitory potency of tariquidar and elacridar, dose-response curves were extracted from the 10 × 10 block of each inhibitor against each compound; 13 of 15 compounds elicited near-complete cell killing, the exceptions being the Aurora kinase inhibitors tozasertib and danusertib, which had a maximal efficacy of approximately 50% (Fig. 5, E and F). Tariquidar (Fig. 5E) and elacridar (Fig. 5F) both achieved near-complete inhibition of all compounds (maximal cell killing) at 247 nM, and the average IC50 against 15 diverse substrates were 100 ± 49 (cotreated with tariquidar) and 84 ± 48 nM (cotreated with elacridar), suggesting inhibition of P-gp irrespective of the substrate. IC50s for inhibition of compounds were consistent with values in the literature, though there are no studies comparing inhibitors and testing them against a large number of substrates.
Newly Identified P-gp Substrates Inhibit P-gp- and ABCG2-Mediated Transport.
Many P-gp substrates have also been found to inhibit P-gp-mediated transport at relatively high concentrations and this is particularly true for kinase inhibitors (Durmus et al., 2015). We next assessed the ability of the six compounds tested earlier (see Table 1) to inhibit P-gp-mediated rhodamine 123 transport or ABCG2-mediated pheophorbide A transport from MDR-19 or R5 cells, respectively, as shown in Fig. 6. At a concentration of 25 μM, only ispinesib was found to appreciably inhibit P-gp-mediated rhodamine transport and was nearly as effective as 3 μM Valspodar (Fig. 6A). Ispinesib was also the only compound found to appreciably inhibit pheophorbide A transport, although not as well as fumitremorgin C, which served as a positive control for ABCG2 inhibition (Fig. 6B). In agreement with previous reports, we find that some kinase inhibitors are substrates of transporters at low concentrations but then act as inhibitors at higher concentrations.
Fig. 6.

Inhibition of P-gp- and ABCG2-mediated transport by P-gp substrates. P-gp-overexpressing MDR-19 cells (A) or ABCG2-overexpressing R-5 cells (B) were incubated with 0.5 μg/ml rhodamine 123 or 5 μM pheophorbide A, respectively, in the absence or presence a specific inhibitor (3 μM Valspodar for P-gp and 10 μM fumitremorgin C for ABCG2) or 25 μM gedatolisib, KW-2478, ispinesib, GSK-690693, AT9283, or AT7519 for 30 minutes after which the medium was removed and replaced with substrate-free medium continuing without or with the inhibitor. Cells incubated with substrates alone are shown by the red histogram, cells incubated with the substrate and specific inhibitor are shown by the teal histogram, and cells incubated with 25 μM concentrations of the test compounds are noted in the key. Results from one of two experiments are shown.
Discussion
P-gp and ABCG2 are known to play a role in the disposition of many toxins by limiting oral bioavailability, increasing excretion, and limiting brain penetration (Robey et al., 2018). Although many targeted therapies have been developed, often it is unclear what role transporters might play in their disposition and how they might affect therapy. We therefore developed a high-throughput screening assay to identify novel substrates of P-gp. Using KB-3-1 cells that do not express P-gp and their P-gp-overexpressing KB-8-5-11 counterpart, we identified 55 novel substrates of P-gp that were confirmed in a second pair of cell lines both in the primary screen and secondary assays. These data may have value in identifying compounds for which drug-drug interactions might be a concern. Alternatively, knowing whether a compound is a P-gp substrate may be helpful for determining the best route of administration in preclinical mouse model studies. Additionally, this information may be valuable to researchers who are testing novel treatments or combinations for brain cancers or metastases in mice, as compounds that are transported by P-gp will most probably not cross the blood-brain barrier, as shown by mouse knockout models (Robey et al., 2018).
Previous screens have used alternative methods to identify novel P-gp substrates. The NCI-60 drug screen cell line set was previously used to identify P-gp substrates by measurement of rhodamine 123 transport (Lee et al., 1994) or ABCB1 gene expression data (Alvarez et al., 1995; Szakács et al., 2004) in the 60 cell lines of the screen and comparing them to drug sensitivity profiles. Cell lines with higher levels of P-gp expression were found to correlate with decreased sensitivity to substrate drugs. This method was successful owing to the relatively high level of variation in P-gp expression in the lines of the screen. In the case of ABCC1 or ABCG2, with cells expressing much lower levels of the transporters, the screen was less successful and often did not identify known substrates (Alvarez et al., 1998; Deeken et al., 2009). More recently, our group developed an assay with a dual-fluorescent system as a basis, in which sensitive cells (OVCAR8) were transduced to express DsRed red fluorescent protein and P-gp-overexpressing cells (NCI/ADR-RES), to express enhanced green fluorescent protein (Brimacombe et al., 2009).
The present study, and those referenced above, rely on P-gp to protect cells from cell death. Although appropriate for a study such as this examining cancer drug resistance, a limitation of this approach is that nontoxic compounds cannot be studied. Strategies for studying nontoxic substrates have been explored and rely on either direct monitoring of the test compounds (for example, radioactivity or analytical detection), or interference with the efflux of a fluorescent substrate. The primary example of the latter comes from Sklar and coworkers, who have reported a number of screens using flow cytometry to identify inhibitors of ABC transporters (Ivnitski-Steele et al., 2008; Winter et al., 2008; Strouse et al., 2013a,b). A Pfizer study reported a correlation between MDCK cells transfected with mouse (Mdr1a) and human (MDR1) P-gp for 3300 compounds, using liquid chromatography–mass spectrometry for analytical quantitation of each compound, although the compounds themselves were not disclosed (Feng et al., 2008). Further work is needed to tabulate all pharmacologically active drugs that are P-gp substrates.
Of course, high-throughput screening methods do have limitations. First, the compounds must be toxic and/or cause cell cycle arrest so that differences between treated and untreated cells can be detected by the CellTiter Glo assay. Thus, the assay will not detect all substrates. Additionally, the ability of a drug to inhibit growth or elicit toxicity often depends on the choice of cell line model. For example, mutant BRAF inhibitors were among the compounds tested, but none emerged as potential substrates despite the fact that some of them, such as vemurafenib and dabrafenib, were reported to be substrates of P-gp (Mittapalli et al., 2012, 2013). This is not unexpected, as the cell line model systems we used did not harbor a mutant BRAF gene. Among the substrates identified, there were no MEK inhibitors, although trametinib and cobimetinib are both known to be P-gp substrates (Choo et al., 2014; de Gooijer et al., 2018). This most probably results from the cell line models used not harboring mutations in BRAF or Ras. Therefore, although this assay did identify several new substrates of P-gp, it does not represent a definitive way to determine if a compound is a P-gp substrate.
Synergy is an important concept in combination chemotherapy, but it is not often discussed in the context of transport inhibitors. Utilizing the Bliss calculation, we demonstrated the profound synergy that inhibition of P-gp can produce in combination with avid P-gp substrates. An advantage of the 10 × 10 combination grid is the ability to readily examine the effects of inhibitors on P-gp substrates. After the initial screen, the ability of the inhibitors tariquidar and elacridar were tested in increasing concentrations with the 17 substrates identified by the screen. Both inhibitors were found to synergize with the substrates and to act at a consistent concentration in combination with all compounds tested. The sensitivity of the synergy screening approach suggests that it may be an alternative strategy for identification of P-gp substrates, and could potentially be used to detect noncytotoxic substrates that are also competitive inhibitors.
In conclusion, we developed a high-throughput screen to identify substrates of P-gp. We identified 55 novel substrates, among them targeted therapies that have yet to be developed clinically. We also have demonstrated that our method can be easily used to confirm the action of proposed P-gp inhibitors by sensitizing P-gp-overexpressing cells to numerous substrates. Future studies will focus on translating these techniques to the identification of substrates of other ABC transporters.
Acknowledgments
We appreciate the technical assistance of George Leiman. The content of this publication does not necessarily reflect the views or policies of the Department of Health and Human Services, nor does mention of trade names, commercial products, or organizations imply endorsement by the US Government.
Abbreviations
- ABCB1
ATP-binding cassette family member B1
- ABCG2
ATP-binding cassette family member G2
- AUC
area under the curve
- BBB
blood-brain barrier
- CRC
concentration-response curve
- DMSO
dimethyl sulfoxide
- FCS
fetal calf serum
- HTS
high-throughput screen
- HEK
human embryonic kidney
- MES
2-(N-morpholino)ethanesulfonic acid
- MIPE
Mechanism Interrogation Plate
- mTOR
mammalian target of rapamycin
- NAMPT
nicotinamide phosphoribosyl transferase
- NCATS
National Center for Advancing Translational Science
- NPACT
NCATS Pharmacologically Active Chemical Toolbox
- NPC
NCATS Pharmaceutical Collection
- pcDNA
plasmid control DNA
- P-gp
P-glycoprotein
- PI3K
phosphoinositide-3 kinase
Authorship Contributions
Participated in research design: T. D. Lee, O. W. Lee, Brimacombe, Klumpp-Thomas, Robey, Ambudkar, Gottesman, Hall.
Conducted experiments: T. D. Lee, O. W. Lee, Chen, Guha, Lusvarghi, Tebase, Robey.
Performed data analysis: T. D. Lee, O. W. Lee, Chen, Guha, Lusvarghi, Robey, Ambudkar, Shen
Wrote or contributed to the writing of the manuscript: T. D. Lee, Lusvarghi, Robey, Hall.
Note Added in Proof—Research performed in the National Center for Advancing Translational Sciences and the National Cancer Institute was accidentally not included in the Fast Forward version published September 12, 2019. The funding footnote has now been corrected.
Footnotes
This work was supported by the Intramural Research Program of the National Institutes of Health National Center for Advancing Translational Sciences.
 This article has supplemental material available at molpharm.aspetjournals.org.
References
- Alvarez M, Paull K, Monks A, Hose C, Lee JS, Weinstein J, Grever MR, Bates SE, Fojo AT. (1995) Generation of a drug resistance profile by quantitation of mdr-1/P-glycoprotein in the cell lines of the National Cancer Institute anticancer drug screen. J Clin Invest 95:2205–2214. [DOI] [PMC free article] [PubMed] [Google Scholar]
- Alvarez M, Robey R, Sandor V, Nishiyama K, Matsumoto Y, Paull K, Bates S, Fojo T. (1998) Using the national cancer institute anticancer drug screen to assess the effect of MRP expression on drug sensitivity profiles. Mol Pharmacol 54:802–814. [DOI] [PubMed] [Google Scholar]
- Ambudkar SV. (1998) Drug-stimulatable ATPase activity in crude membranes of human MDR1-transfected mammalian cells. Methods Enzymol 292:504–514. [DOI] [PubMed] [Google Scholar]
- Basseville A, Hall MD, Chau CH, Robey RW, Gottesman M, Figg WD, Bates SE. (2016) The ABCG2 multidrug transporter, in ABC Transporters - 40 Years on (George MA. ed) pp 195–226, Springer International Publishing, Cham, Switzerland. [Google Scholar]
- Bavetsias V, Skelton LA, Yafai F, Mitchell F, Wilson SC, Allan B, Jackman AL. (2002) The design and synthesis of water-soluble analogues of CB30865, a quinazolin-4-one-based antitumor agent. J Med Chem 45:3692–3702. [DOI] [PubMed] [Google Scholar]
- Biedler JL, Riehm H. (1970) Cellular resistance to actinomycin D in Chinese hamster cells in vitro: cross-resistance, radioautographic, and cytogenetic studies. Cancer Res 30:1174–1184. [PubMed] [Google Scholar]
- Brasca MG, Albanese C, Alzani R, Amici R, Avanzi N, Ballinari D, Bischoff J, Borghi D, Casale E, Croci V, et al. (2010) Optimization of 6,6-dimethyl pyrrolo[3,4-c]pyrazoles: identification of PHA-793887, a potent CDK inhibitor suitable for intravenous dosing. Bioorg Med Chem 18:1844–1853. [DOI] [PubMed] [Google Scholar]
- Brimacombe KR, Hall MD, Auld DS, Inglese J, Austin CP, Gottesman MM, Fung KL. (2009) A dual-fluorescence high-throughput cell line system for probing multidrug resistance. Assay Drug Dev Technol 7:233–249. [DOI] [PMC free article] [PubMed] [Google Scholar]
- Choo EF, Ly J, Chan J, Shahidi-Latham SK, Messick K, Plise E, Quiason CM, Yang L. (2014) Role of P-glycoprotein on the brain penetration and brain pharmacodynamic activity of the MEK inhibitor cobimetinib. Mol Pharm 11:4199–4207. [DOI] [PubMed] [Google Scholar]
- Chu X, Bleasby K, Evers R. (2013) Species differences in drug transporters and implications for translating preclinical findings to humans. Expert Opin Drug Metab Toxicol 9:237–252. [DOI] [PubMed] [Google Scholar]
- Cooray HC, Blackmore CG, Maskell L, Barrand MA. (2002) Localisation of breast cancer resistance protein in microvessel endothelium of human brain. Neuroreport 13:2059–2063. [DOI] [PubMed] [Google Scholar]
- Cordon-Cardo C, O’Brien JP, Casals D, Rittman-Grauer L, Biedler JL, Melamed MR, Bertino JR. (1989) Multidrug-resistance gene (P-glycoprotein) is expressed by endothelial cells at blood-brain barrier sites. Proc Natl Acad Sci USA 86:695–698. [DOI] [PMC free article] [PubMed] [Google Scholar]
- Davis MI, Patrick SL, Blanding WM, Dwivedi V, Suryadi J, Golden JE, Coussens NP, Lee OW, Shen M, Boxer MB, et al. (2016) Identification of novel plasmodium falciparum hexokinase inhibitors with antiparasitic activity. Antimicrob Agents Chemother 60:6023–6033. [DOI] [PMC free article] [PubMed] [Google Scholar]
- Deeken JF, Robey RW, Shukla S, Steadman K, Chakraborty AR, Poonkuzhali B, Schuetz EG, Holbeck S, Ambudkar SV, Bates SE. (2009) Identification of compounds that correlate with ABCG2 transporter function in the National Cancer Institute Anticancer Drug Screen. Mol Pharmacol 76:946–956. [DOI] [PMC free article] [PubMed] [Google Scholar]
- de Gooijer MC, Zhang P, Weijer R, Buil LCM, Beijnen JH, van Tellingen O. (2018) The impact of P-glycoprotein and breast cancer resistance protein on the brain pharmacokinetics and pharmacodynamics of a panel of MEK inhibitors. Int J Cancer 142:381–391. [DOI] [PubMed] [Google Scholar]
- Dehnhardt CM, Venkatesan AM, Delos Santos E, Chen Z, Santos O, Ayral-Kaloustian S, Brooijmans N, Mallon R, Hollander I, Feldberg L, et al. (2010) Lead optimization of N-3-substituted 7-morpholinotriazolopyrimidines as dual phosphoinositide 3-kinase/mammalian target of rapamycin inhibitors: discovery of PKI-402. J Med Chem 53:798–810. [DOI] [PubMed] [Google Scholar]
- Durmus S, Hendrikx JJ, Schinkel AH. (2015) Apical ABC transporters and cancer chemotherapeutic drug disposition. Adv Cancer Res 125:1–41. [DOI] [PubMed] [Google Scholar]
- Feng B, Mills JB, Davidson RE, Mireles RJ, Janiszewski JS, Troutman MD, de Morais SM. (2008) In vitro P-glycoprotein assays to predict the in vivo interactions of P-glycoprotein with drugs in the central nervous system. Drug Metab Dispos 36:268–275. [DOI] [PubMed] [Google Scholar]
- Fetsch PA, Abati A, Litman T, Morisaki K, Honjo Y, Mittal K, Bates SE. (2006) Localization of the ABCG2 mitoxantrone resistance-associated protein in normal tissues. Cancer Lett 235:84–92. [DOI] [PubMed] [Google Scholar]
- Gottesman MM, Lavi O, Hall MD, Gillet JP. (2016) Toward a better understanding of the complexity of cancer drug resistance. Annu Rev Pharmacol Toxicol 56:85–102. [DOI] [PubMed] [Google Scholar]
- Greenberger LM, Lothstein L, Williams SS, Horwitz SB. (1988) Distinct P-glycoprotein precursors are overproduced in independently isolated drug-resistant cell lines. Proc Natl Acad Sci USA 85:3762–3766. [DOI] [PMC free article] [PubMed] [Google Scholar]
- Hegedus C, Ozvegy-Laczka C, Apáti A, Magócsi M, Német K, Orfi L, Kéri G, Katona M, Takáts Z, Váradi A, et al. (2009) Interaction of nilotinib, dasatinib and bosutinib with ABCB1 and ABCG2: implications for altered anti-cancer effects and pharmacological properties. Br J Pharmacol 158:1153–1164. [DOI] [PMC free article] [PubMed] [Google Scholar]
- Horton JK, Houghton PJ, Houghton JA. (1987) Reciprocal cross-resistance in human rhabdomyosarcomas selected in vivo for primary resistance to vincristine and L-phenylalanine mustard. Cancer Res 47:6288–6293. [PubMed] [Google Scholar]
- Huang R, Southall N, Wang Y, Yasgar A, Shinn P, Jadhav A, Nguyen DT, Austin CP. (2011) The NCGC pharmaceutical collection: a comprehensive resource of clinically approved drugs enabling repurposing and chemical genomics. Sci Transl Med 3:80ps16. [DOI] [PMC free article] [PubMed] [Google Scholar]
- Huls M, Brown CD, Windass AS, Sayer R, van den Heuvel JJ, Heemskerk S, Russel FG, Masereeuw R. (2008) The breast cancer resistance protein transporter ABCG2 is expressed in the human kidney proximal tubule apical membrane. Kidney Int 73:220–225. [DOI] [PubMed] [Google Scholar]
- Inglese J, Auld DS, Jadhav A, Johnson RL, Simeonov A, Yasgar A, Zheng W, Austin CP. (2006) Quantitative high-throughput screening: a titration-based approach that efficiently identifies biological activities in large chemical libraries. Proc Natl Acad Sci USA 103:11473–11478. [DOI] [PMC free article] [PubMed] [Google Scholar]
- Ivnitski-Steele I, Larson RS, Lovato DM, Khawaja HM, Winter SS, Oprea TI, Sklar LA, Edwards BS. (2008) High-throughput flow cytometry to detect selective inhibitors of ABCB1, ABCC1, and ABCG2 transporters. Assay Drug Dev Technol 6:263–276. [DOI] [PubMed] [Google Scholar]
- Jonker JW, Smit JW, Brinkhuis RF, Maliepaard M, Beijnen JH, Schellens JH, Schinkel AH. (2000) Role of breast cancer resistance protein in the bioavailability and fetal penetration of topotecan. J Natl Cancer Inst 92:1651–1656. [DOI] [PubMed] [Google Scholar]
- Kort A, van Hoppe S, Sparidans RW, Wagenaar E, Beijnen JH, Schinkel AH. (2017) Brain accumulation of ponatinib and its active metabolite, N-desmethyl ponatinib, is limited by P-glycoprotein (P-GP/ABCB1) and breast cancer resistance protein (BCRP/ABCG2). Mol Pharm 14:3258–3268. [DOI] [PubMed] [Google Scholar]
- Lee JS, Paull K, Alvarez M, Hose C, Monks A, Grever M, Fojo AT, Bates SE. (1994) Rhodamine efflux patterns predict P-glycoprotein substrates in the National Cancer Institute drug screen. Mol Pharmacol 46:627–638. [PubMed] [Google Scholar]
- Lee SC, Arya V, Yang X, Volpe DA, Zhang L. (2017) Evaluation of transporters in drug development: current status and contemporary issues. Adv Drug Deliv Rev 116:100–118. [DOI] [PubMed] [Google Scholar]
- Maliepaard M, Scheffer GL, Faneyte IF, van Gastelen MA, Pijnenborg AC, Schinkel AH, van De Vijver MJ, Scheper RJ, Schellens JH. (2001) Subcellular localization and distribution of the breast cancer resistance protein transporter in normal human tissues. Cancer Res 61:3458–3464. [PubMed] [Google Scholar]
- Martinez NJ, Rai G, Yasgar A, Lea WA, Sun H, Wang Y, Luci DK, Yang SM, Nishihara K, Takeda S, et al. (2016) A high-throughput screen identifies 2,9-diazaspiro[5.5]undecanes as inducers of the endoplasmic reticulum stress response with cytotoxic activity in 3D glioma cell models. PLoS One 11:e0161486. [DOI] [PMC free article] [PubMed] [Google Scholar]
- Mathews Griner LA, Guha R, Shinn P, Young RM, Keller JM, Liu D, Goldlust IS, Yasgar A, McKnight C, Boxer MB, et al. (2014) High-throughput combinatorial screening identifies drugs that cooperate with ibrutinib to kill activated B-cell-like diffuse large B-cell lymphoma cells. Proc Natl Acad Sci USA 111:2349–2354. [DOI] [PMC free article] [PubMed] [Google Scholar]
- Mittapalli RK, Vaidhyanathan S, Dudek AZ, Elmquist WF. (2013) Mechanisms limiting distribution of the threonine-protein kinase B-RaF(V600E) inhibitor dabrafenib to the brain: implications for the treatment of melanoma brain metastases. J Pharmacol Exp Ther 344:655–664. [DOI] [PMC free article] [PubMed] [Google Scholar]
- Mittapalli RK, Vaidhyanathan S, Sane R, Elmquist WF. (2012) Impact of P-glycoprotein (ABCB1) and breast cancer resistance protein (ABCG2) on the brain distribution of a novel BRAF inhibitor: vemurafenib (PLX4032). J Pharmacol Exp Ther 342:33–40. [DOI] [PMC free article] [PubMed] [Google Scholar]
- Robey RW, Lin B, Qiu J, Chan LL, Bates SE. (2011) Rapid detection of ABC transporter interaction: potential utility in pharmacology. J Pharmacol Toxicol Methods 63:217–222. [DOI] [PMC free article] [PubMed] [Google Scholar]
- Robey RW, Pluchino KM, Hall MD, Fojo AT, Bates SE, Gottesman MM. (2018) Revisiting the role of ABC transporters in multidrug-resistant cancer. Nat Rev Cancer 18:452–464. [DOI] [PMC free article] [PubMed] [Google Scholar]
- Robey RW, Steadman K, Polgar O, Morisaki K, Blayney M, Mistry P, Bates SE. (2004) Pheophorbide a is a specific probe for ABCG2 function and inhibition. Cancer Res 64:1242–1246. [DOI] [PubMed] [Google Scholar]
- Schinkel AH, Smit JJ, van Tellingen O, Beijnen JH, Wagenaar E, van Deemter L, Mol CA, van der Valk MA, Robanus-Maandag EC, te Riele HP, et al. (1994) Disruption of the mouse mdr1a P-glycoprotein gene leads to a deficiency in the blood-brain barrier and to increased sensitivity to drugs. Cell 77:491–502. [DOI] [PubMed] [Google Scholar]
- Shen DW, Fojo A, Chin JE, Roninson IB, Richert N, Pastan I, Gottesman MM. (1986) Human multidrug-resistant cell lines: increased mdr1 expression can precede gene amplification. Science 232:643–645. [DOI] [PubMed] [Google Scholar]
- Sparreboom A, van Asperen J, Mayer U, Schinkel AH, Smit JW, Meijer DK, Borst P, Nooijen WJ, Beijnen JH, van Tellingen O. (1997) Limited oral bioavailability and active epithelial excretion of paclitaxel (Taxol) caused by P-glycoprotein in the intestine. Proc Natl Acad Sci USA 94:2031–2035. [DOI] [PMC free article] [PubMed] [Google Scholar]
- Strouse JJ, Ivnitski-Steele I, Khawaja HM, Perez D, Ricci J, Yao T, Weiner WS, Schroeder CE, Simpson DS, Maki BE, et al. (2013a) A selective ATP-binding cassette subfamily G member 2 efflux inhibitor revealed via high-throughput flow cytometry. J Biomol Screen 18:26–38. [DOI] [PMC free article] [PubMed] [Google Scholar]
- Strouse JJ, Ivnitski-Steele I, Waller A, Young SM, Perez D, Evangelisti AM, Ursu O, Bologa CG, Carter MB, Salas VM, et al. (2013b) Fluorescent substrates for flow cytometric evaluation of efflux inhibition in ABCB1, ABCC1, and ABCG2 transporters. Anal Biochem 437:77–87. [DOI] [PMC free article] [PubMed] [Google Scholar]
- Szakács G, Annereau JP, Lababidi S, Shankavaram U, Arciello A, Bussey KJ, Reinhold W, Guo Y, Kruh GD, Reimers M, et al. (2004) Predicting drug sensitivity and resistance: profiling ABC transporter genes in cancer cells. Cancer Cell 6:129–137. [DOI] [PubMed] [Google Scholar]
- Thiebaut F, Tsuruo T, Hamada H, Gottesman MM, Pastan I, Willingham MC. (1987) Cellular localization of the multidrug-resistance gene product P-glycoprotein in normal human tissues. Proc Natl Acad Sci USA 84:7735–7738. [DOI] [PMC free article] [PubMed] [Google Scholar]
- Thiebaut F, Tsuruo T, Hamada H, Gottesman MM, Pastan I, Willingham MC. (1989) Immunohistochemical localization in normal tissues of different epitopes in the multidrug transport protein P170: evidence for localization in brain capillaries and crossreactivity of one antibody with a muscle protein. J Histochem Cytochem 37:159–164. [DOI] [PubMed] [Google Scholar]
- Winter SS, Lovato DM, Khawaja HM, Edwards BS, Steele ID, Young SM, Oprea TI, Sklar LA, Larson RS. (2008) High-throughput screening for daunorubicin-mediated drug resistance identifies mometasone furoate as a novel ABCB1-reversal agent. J Biomol Screen 13:185–193. [DOI] [PubMed] [Google Scholar]