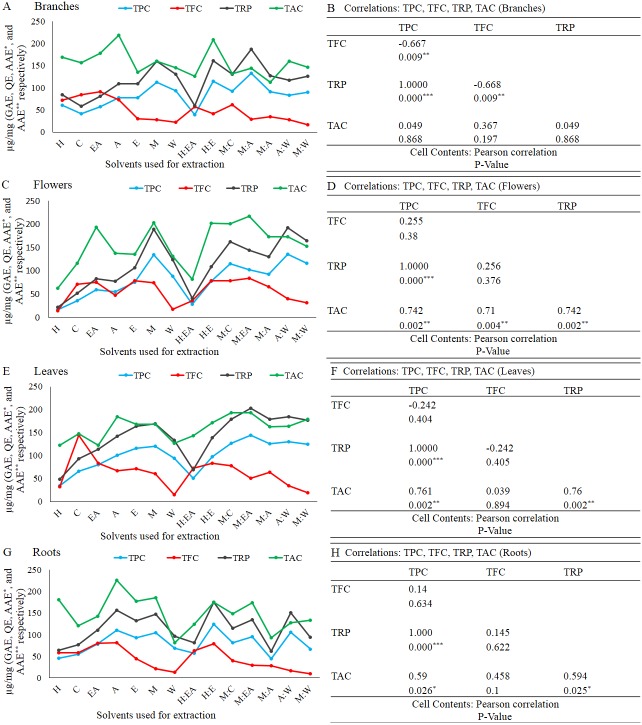
Figure 6. Total phenolic content is positively correlated with TRP and TAC in branches (A and B), flowers (B), leaves (C), and roots (D).
The full form of the abbreviation used in the table: H (n-hexane), C (chloroform), EA (ethyl-acetate), A (acetone), E (ethanol), M (methanol), W (water), H:EA (n-hexane-ethyl-acetate), H:E (n-hexane-ethanol), M:C (methanol-chloroform), M:EA (methanol-ethyl-acetate), M:A (methanol-acetone), A:W (acetone-water), and M:W (methanol-water). Data shown are means ± STD. Correlations: TPC, TFC, TRP, and TAC in branches (B), flowers (D), leaves (F), and roots (H). *p < 0.05, **p < .01, ***p < .001, Pearson’s correlation in Minitab 16 software (B).

