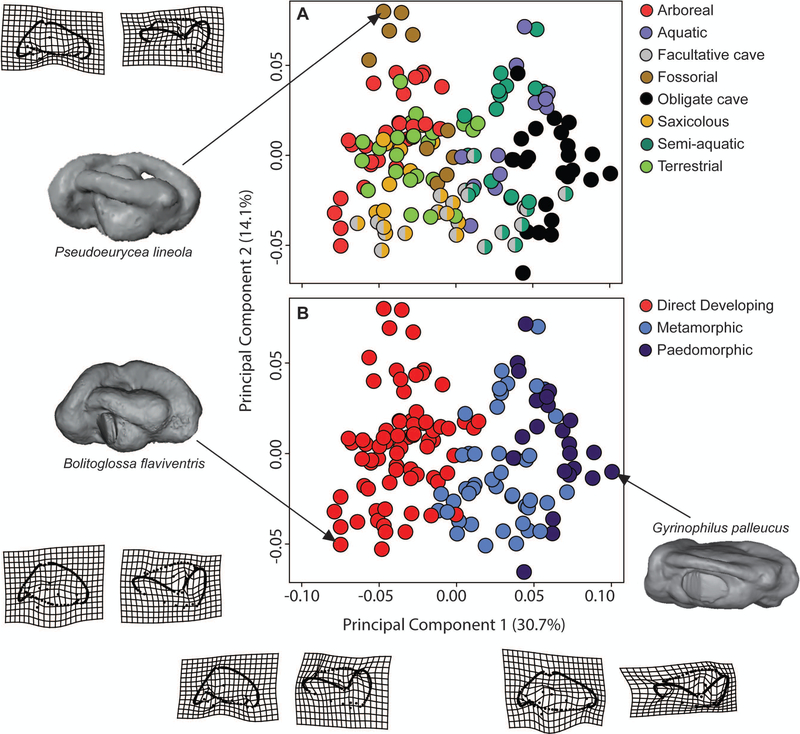
Figure 4.
Principal component (PC) analysis of inner ear shape. Individual points represent specimens; colors indicate ecotype classification (A) and developmental strategy (B). The facultative cave ecotype in (A) is split-colored to indicate the alternative ecotype classification scheme. Thin-plate spline deformation grids illustrating deviation from the Procrustes mean shape along each PC axis are shown.

