ABSTRACT
Aim
This study was conducted to investigate the chronic injury of peritoneal glucose injection on the peritoneum and intestine and the protective effects of omega‐3 polyunsaturated fatty acid (ω‐3PUFA) during peritoneal dialysis (PD).
Methods
Peritoneal dialysis animal models were established by intraperitoneal injection of 4.25% glucose for 28 days. Protein expression in ileum and peritoneum was measured by immunofloresence and immunohistochemistry. Protein expression in macrophages was measured by Western blot. Fibrosis was analyzed by Masson staining.
Results
Peritoneal dialysis significantly increased the structural injury and decreased junction‐related protein ZO‐1 and occludin expression in ileum, the expression of proteins relating to the activation of M2 (Erg2, IRF4), but not M1 (CD38, IRF5) macrophages. PD significantly increased the expression of TGF‐β1, VEGF and ALK5 protein in peritoneal tissues. PD significantly increased fibrosis (Masson staining) and the expression of fibroblast marker α‐SMA in peritoneal tissues. Injection of macrophage clean reagent and ω‐3PUFA significantly inhibited M2 activation, and decreased Masson staining, α‐SMA, TGF‐β1, VEGF and ALK5 protein expression in peritoneal tissues in PD treated rats. ω‐3PUFA injection significantly decreased PD‐induced injury in ileum and normalized the expression of ZO‐1 and occludin in the ileum of PD rats.
Conclusion
Omega‐3 fatty acids can provide a protective role on PD‐induced peritoneal fibrosis and injury of the intestine.
Keywords: fibrosis, intestinal injury, macrophage polarization, omega‐3 polyunsaturated fatty acid, peritoneal dialysis
SUMMARY AT A GLANCE
This study demonstrated that omega‐3 fatty acids inhibited peritoneal fibrosis through inhibiting activation of fibroblasts and M2 microphages and subsequently TGF‐ß1‐VEGF‐ALK5 signaling in rats that received peritoneal dialysis with 4.25% glucose. Omega‐3 fatty acids may provide a protective role on peritoneal dialysis‐induced peritoneal fibrosis.
Peritoneal dialysis (PD) is a technique to remove wastes, chemicals and extra water from the body of patients with chronic kidney disease and renal failure. However, long‐term peritoneal dialysis can cause severe complications such as the development of peritoneal chronic inflammation and fibrosis.1 The fibrosis process and inflammation are often two cooperative parts which are frequently induced bidirectionally.2 Inflammatory cytokines induced by peritoneal dialysis solutions, such as glucose and glucose degradation products, can induce fibrosis.3 It is generally accepted that classically activated macrophages (M1) secrete many pro‐inflammatory cytokines which are involved in tissue damage, whereas alternatively activated macrophages (M2) secrete the growth factor beta (TGF‐β) which participates in tissue remodeling and fibrosis occurrence.4, 5 The effect of M2 on peritoneal fibrosis related to PD has been revealed.6 However, it currently lacks effective prevention of peritoneal fibrosis during PD.
The intercellular tight junctions (TJ) and apical plasma membrane of the enterocytes form the intestinal epithelial barrier that regulates the transport of water, ions and organic molecules across the epithelium.6 TJ are composed of cytoplasmic scaffolding proteins (ZO family and cingulin) and transmembrane barrier proteins (occludin and claudins).7 Among these TJs, ZO‐1 (zonula occludens 1) and occludin form a ‘leak’ pathway to regulate the permeability of macromolecules and claudin forms at ‘pore’ pathway to regulate permeability of ions and small molecules.8 A previous study also demonstrated that the expression of TJ proteins, such as occludin and ZO‐1, was significantly decreased in human peritoneal mesothelial cells isolated from patients that received peritoneal dialysis.9
Omega‐3 fatty acids, the natural components of fish oil, have long been believed to prolong life in patients with heart diseases.10 Clinical studies suggest that supplementation with pharmacological doses of ω‐3PUFA prolongs the survival of patients with heart failure most likely through its anti‐inflammatory effects, such as reducing circulating levels of inflammatory cytokines.11 A recent study demonstrated that dialyzed patients have a significantly lower content of n‐3 PUFA, which contributes to a high cardiovascular risk in patients with chronic kidney disease.12 However, the effects of ω‐3PUFA on the development of peritoneal fibrosis during peritoneal dialysis have not been addressed.
In this study, we established the peritoneal dialysis model in rats and further observed the effects of macrophage polarization, inflammatory cytokines expression and the effects of ω‐3PUFA administration on the induction of peritoneal fibrosis.
METHODS
Establishment of peritoneal dialysis rat model
Fifty healthy female adult Sprague Dawley (SD) rats (8 weeks old) were provided by the Animal Facility of Central South University. After one week of adaptive feeding, rats were randomly divided into five groups (n = 10): normal control group (without any experimental treatment), sham PD group, peritoneal fibrosis group, macrophage clearance group and ω‐3PUFA intervention group. Animals in peritoneal fibrosis group, macrophage clearance group and ω‐3PUFA intervention group were intraperitoneally injected with peritoneal dialysis solution (4.25% glucose, 10 mL/100 g) for 28 days; animals in sham PD group were injected with an equal volume of saline; animals in the ω‐3PUFA intervention group were intragastrically given ω‐3PUFA (0.5 and 1.5 g/kg per day) daily,13, 14 and animals in macrophage clearance group were intravenously injected with disodium chlorophosphate liposomes on the 18th and 21th day of intraperitoneal injection (0.2 mL/20 g animal body weight). The dose and time were determined based on a previous study,15 the product description and our preliminary experiments. All rats were killed on the 29th day post first peritoneal injection. All experiments were conducted in accordance with the National Institutes of Health Guide for the Care and Use of Laboratory Animals and Chinese legislation on the use and care of laboratory animals.
Pathological changes of intestinal mucosa
After the rats were killed by decapitation, about 1 cm of intestine was taken from the end of the ileum, rinsed quickly with saline and fixed in 4% paraformaldehyde overnight at 4 °C. The tissues were sectioned for H&E staining and immunofluorescence staining. The intestinal villus height, intestinal crypt depth and their ratio were measured using an ipp6.0 image analysis system (Media Cybernetics, Rockville, MD, USA). Five sections from each rat were measured and averaged. The mean of villus height, crypt depth and their ratio in each group were compared. An increase in villus height, villus/crypt ratio or decrease in the crypt depth reflects an improvement in the digestion and absorption of nutrients.16
Peritoneal tissue collection and Masson staining
The peritoneal wall layer and visceral layer were collected and immediately frozen in liquid nitrogen and stored at −80.0 °C until use. Partial peritoneal tissues were fixed in periodate‐lysine‐paraformaldehyde (PLP) solution overnight at 4 °C, followed by paraffin embedding and section. The slices were deparaffinized and rehydrated through 100% alcohol, 95% alcohol and 70% alcohol, and then stained in Weigert's iron haematoxylin working solution for 10 min. After rinsing in running tap water for 10 min and washing in distilled water, slices were stained with Biebrich scarlet‐acid fuchsin solution for 10–15 min. They were then followed by differentiating in phosphomolybdic–phosphotungstic acid solution for 10–15 min and staining with aniline blue solution for 5–10 min. After rinsing briefly in distilled water and differentiating in 1% acetic acid solution for 2–5 min, the slices were washed in distilled water, dehydrated quickly through 95% ethyl alcohol, absolute ethyl alcohol and xylene. The degree of peritoneal fibrosis was observed under a light microscope after mounting with resinous mounting medium.
Western blot
M1/M2 polarization‐related protein expression was analyzed using Western blot. Briefly, macrophages were isolated from the peritoneal cavity of rats as previously described.17 The isolated macrophages were homogenized as previously described.18 The protein concentration was determined by a Bradford assay (Bio‐Rad Laboratories, Hercules, CA, USA). Ten microgram aliquots of cell homogenate were loaded per well on a 10% sodiumdodecyl sulfate polyacrylamide gel electropheresis (SDS‐PAGE) gel. After transferring the protein to the membranes, they were then blocked with 5% non‐fat dried milk for 1 h and incubated with anti‐CD38 (1:1000 dilution), Egr2 (1:1000 dilution), IRF4 (1:1000 dilution), IRF5 (1:1000 dilution) and β‐actin antibody (1:1500 dilution) (Cell Signaling, Danvers, MA, USA) overnight at 4 °C followed by incubation with horseradish peroxidase‐conjugated goat anti‐rabbit IgG secondary antibody (Cell Signaling) for 2 h at room temperature. An electro‐chemi‐luminescence (ECL) chemiluminescence substrate (Amersham, Little Chalfont, UK) was used to visualize the immune reaction. The images were taken using ChemiDoc XRS+ system (Bio‐Rad Laboratories, Hercules, CA, USA) and analyzed using Image Lab 4.1 (Bio‐Rad Laboratories, Hercules, CA, USA).
Immunofluorescence of ZO‐1 and occludin expression
Immunofluorescence staining was used to observe the expression of ZO‐1 and occludin in ileum. The ileum was taken from the end of the ileum and rinsed with saline, and fixed in 4% paraformaldehyde overnight at 4 °C. After blocking with 10% FBS (fetal bovine serum) for 60 min at 37 °C, the sections were stained with rabbit anti‐occludin or anti‐ZO‐1 antibody overnight at 4 °C, followed by goat anti‐rabbit IgG conjugated with Alexa fluor 488 (BD Biosciences, Franklin Lakes, NJ, USA). Nuclei were stained with 4′,6‐diamidino‐2‐phenylinodele (DAPI) (Sigma, St Louis, MO, USA). The distribution of target proteins was analyzed by a confocal laser scanning microscope, LSM700 (Carl Zeiss, Jena, Germany).
Immunohistochemistry
The EnVision™ Detection kit was obtained from Dako Laboratories (Carpinteria, CA, USA). EnVision immunohistochemical staining was performed according to the manufacturer's protocol. Briefly, the routinely paraffin‐embedded peritoneal tissues were sectioned at 4 μM‐thick and then deparaffinized. Following a 15 min incubation with 3% H2O2 in the dark at room temperature and antigen retrieval in sodium citrate buffer (10 mM Sodium citrate, 0.05% Tween 20, pH 6.0), tissue sections were incubated with primary anti‐α‐SMA (1:100 dilution), anti‐VEGF (1:100 dilution), anti‐TGF‐β1(1:50 dilution) and anti‐ALK5 (1:100 dilution) antibody (Santa Cruz, CA, USA) for 1 h at room temperature. After rinsing in PBS for 3 × 5 min, Solution A (containing the Electro‐Chemi‐Luminescence (HRP)‐conjugated secondary antibody) was added to the sections and incubated for 30 min at room temperature. After rinsing with 1 × PBS (Well‐Biology, Changsha, China) for 3 × 5 min, sections were treated for Diaminobenzidine (DAB) staining, haematoxylin counter‐staining, dehydration with alcohol, soaking in xylene and mounting with neutral balsam. A total of 500 cells were counted in 10 sections, and the percentage of positively stained cells was calculated.
Statistical analysis
The data were presented as means and standard errors of the mean (SEM) and analyzed using the Statistical Package for the Social Sciences, Version 20.0 (SPSS, Chicago, IL, USA). The biochemical data were analyzed using one‐way anova or χ 2 test. The post‐hoc analyses were performed using Bonferroni corrected pair‐wise comparisons. A P < 0.05 was considered statistically significant.
RESULTS
The changes in morphology and junction‐related protein expression in ileum
The ileums were collected for H&E staining (Fig. 1) and immunofluorescence of ZO‐1 (Fig. 2) and occludin expression (Fig. 3). PD significantly decreased the length of ileal villus and the ratio of the depth of crypt/the length of ileal villus, but had no effect on the depth of crypt. The injections of macrophage clean reagent and ω‐3PUFA significantly normalized the changes induced by PD (Fig. 1). Immunofluorescence analysis showed that PD significantly decreased the expression of ZO‐1 and occludin in ileum; however, treatment of both low and high doses of ω‐3PUFA significantly normalized the changes in ZO‐1 and occludin expression induced by PD (Figs 2,3). In contrast, injection of macrophage clean reagent had less effects on ZO‐1 (Fig. 2) and occludin (Fig. 3) expression.
Figure 1.
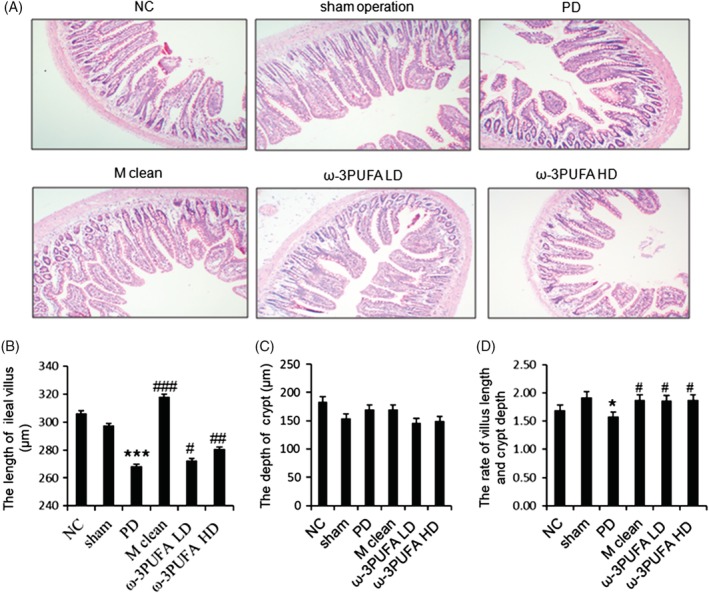
The morphological changes in ileum. (A) Representative H&E staining of ileum. Original magnification, 100×. PD significantly decreased the length of ileal villus (B), had no effect on the depth of crypt (C), and decreased the ratio of depth crypt/the length of ileal villus (D). NC, normal control; PD, peritoneal dialysis; ***, P < 0.001 versus NC and Sham; #, P < 0.05; ##, P < 0.01; ###, P < 0.001 versus PD.
Figure 2.
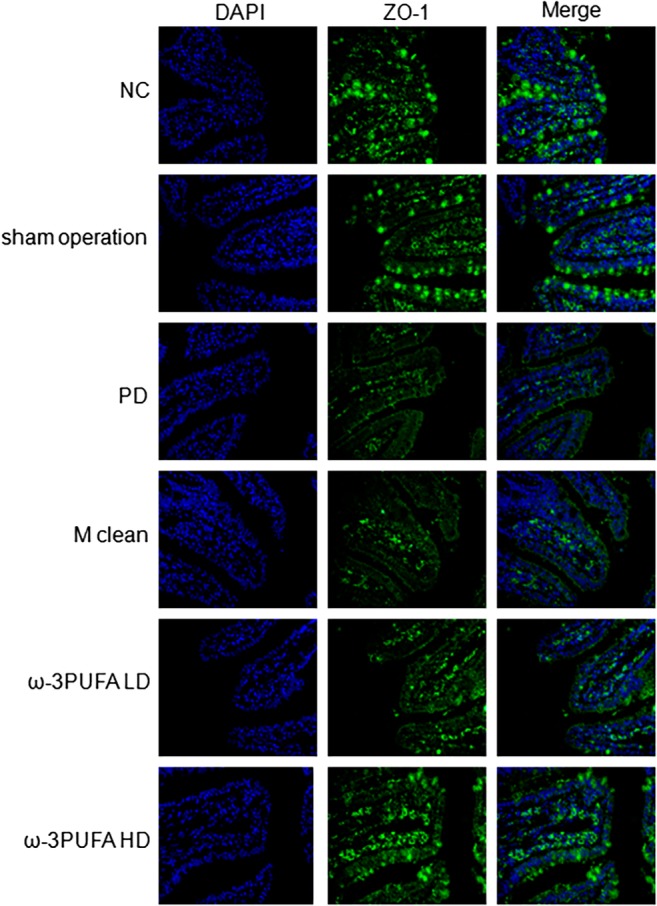
Immunofluoresence of ZO‐1 expression in the ileum. Original magnification, 400×. Changes in spatial expression of ZO‐1 protein were qualitative only. Same slide was stained with rabbit anti‐ZO‐1 antibody, followed by Alexa fluor 488 conjugated IgG (ZO‐1). Nuclei were further stained with DAPI (DAPI). The pictures of ZO‐1 and DAPI were merged (Merge). DAPI, 4′,6‐diamidino‐2‐phenylinodele; PD, peritoneal dialysis; ω‐3PUFA LD, ω‐3PUFA low dose; ω‐3PUFA HD, ω‐3PUFA high dose.
Figure 3.
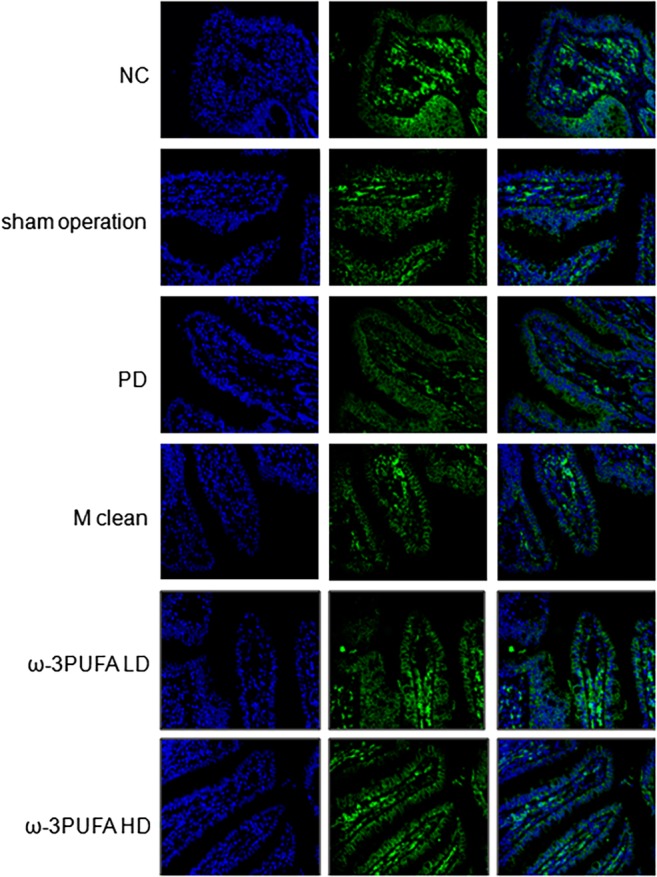
Immunofluoresence of occludin expression in the ileum. Original magnification, 400×. Changes in spatial expression of occludin protein were qualitative only. Same slide was stained with rabbit anti‐occludin antibody, followed by Alexa fluor 488 conjugated IgG (Occludin). Nuclei were further stained with DAPI (DAPI). The pictures of Occludin and DAPI were merged (Merge). DAPI, 4′,6‐diamidino‐2‐phenylinodele.
The changes in microphage polarization and related molecules expression in peritoneal tissues
The peritoneal macrophages were isolated. Western blots showed that PD significantly decreased the ratio of CD38/Erg2 while also significantly increased the expression of IRF4, a marker of M2 polarization. In contrast, PD had no effect on the expression of IRF5 protein, a marker for M1 polarization (Fig. 4). The injections of macrophage clean reagent and ω‐3PUFA significantly increased the ratio of CD38/Erg2, but decreased IRF4 expression compared to PD alone group (Fig. 4). The immunohistochemical staining showed that the expression of TGF‐β1 (Fig. 5), VEGF (Fig. 6) and ALK5 (Fig. 7) protein significantly increased in peritoneal tissues of PD rats. The injections of macrophage clean reagent and ω‐3PUFA significantly normalized the changes in TGF‐β1 (Fig. 5), VEGF (Fig. 6) and ALK5 (Fig. 7) expression induced by PD.
Figure 4.
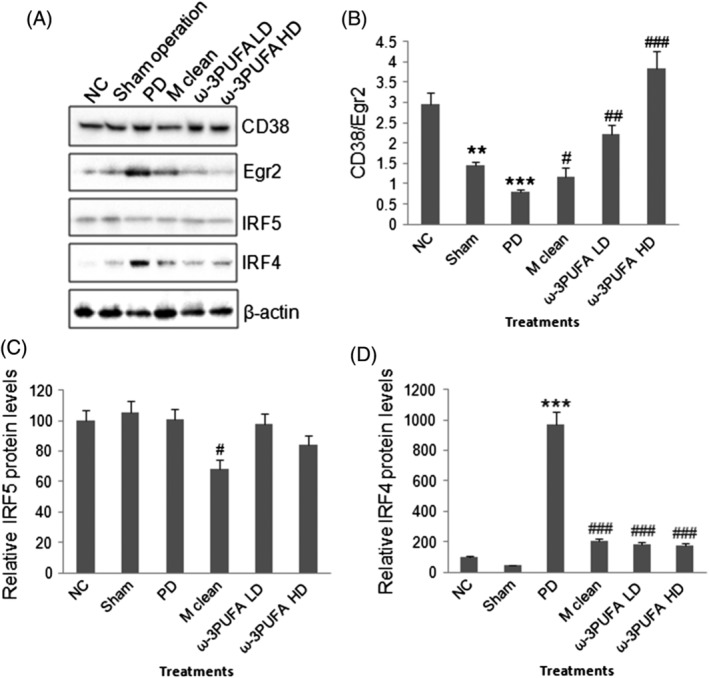
Western blot of M1/M2 polarization‐related protein expression. (A) Representative Western blots of CD38, EgR2, IRF5, IRF4, and β‐actin. (B) Semi‐quantitative analysis of CD38/Egr2 ratio. (C) Semi‐quantitative analysis of IRF5 expression. (D) Semi‐quantitative analysis of IRF4 expression. **, P < 0.01; ***, P < 0.001 versus normal control; #, P < 0.05; ##, P < 0.01; ###, P < 0.001 versus PD.
Figure 5.
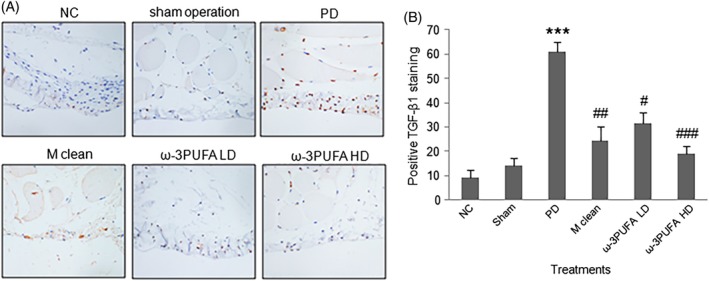
Immunohistochemistry of TGF‐β1 expression in peritoneal tissues. (A) Representative immunohistochemical staining of TGF‐β1 protein expression. (B) The percentage of cells with positive TGF‐β1 staining.
Figure 6.
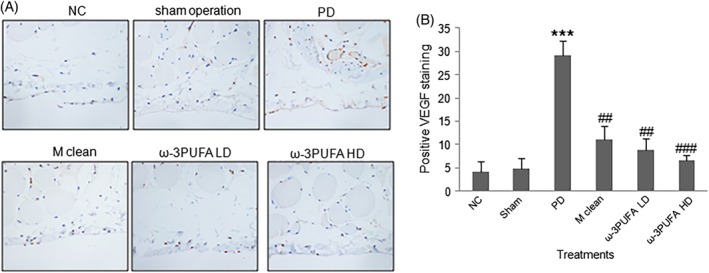
Immunohistochemistry of VEGF expression in peritoneal tissues. (A) Representative immunohistochemical staining of VEGF protein expression. (B) The percentage of cells with positive VEGF staining.
Figure 7.
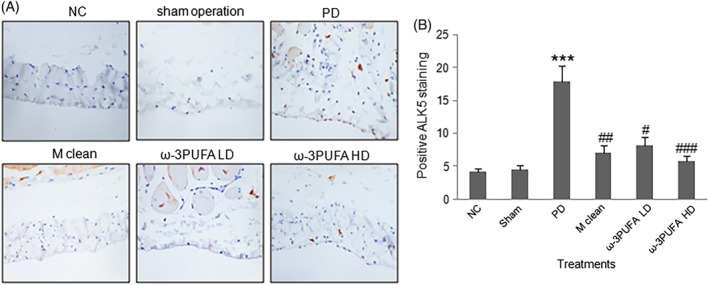
Immunohistochemistry of ALK5 expression in peritoneal tissues. (A) Representative immunohistochemical staining of ALK5 protein expression. (B) The percentage of cells with positive ALK5 staining.
The changes in fibroblast amount and fibrosis in PD rats
Masson staining was used to measure the fibrosis of peritoneal tissues. PD induced significant fibrosis in peritoneal tissues, whereas macrophage clean reagent and ω‐3PUFA significantly normalized the changes induced by PD (Fig. 8). Immunohistochemistry showed that PD significantly increased α‐SMA expression in peritoneal tissues. In contrast, macrophage clean reagent and ω‐3PUFA significantly decreased α‐SMA expression in peritoneal tissues in PD treated rats (Fig. 9).
Figure 8.
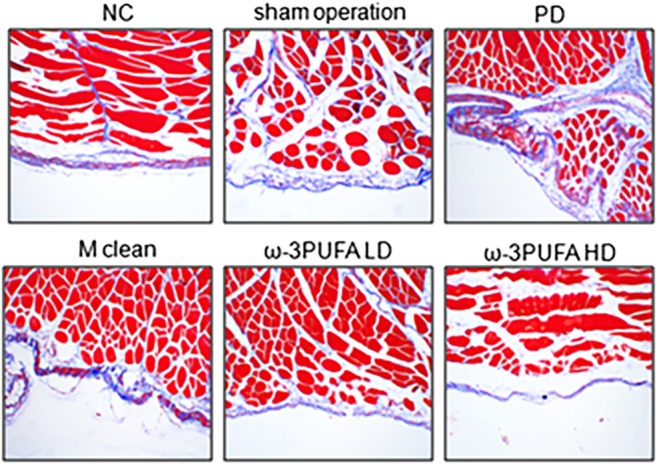
Masson staining in peritoneal tissues. Fibrosis is depicted with blue staining.
Figure 9.
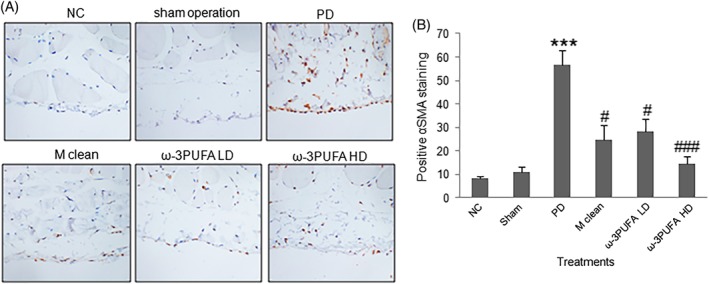
Immunohistochemistry of α‐SMA expression in the fibroblasts of peritoneal tissues. (A) Representative immunohistochemical staining of α‐SMA protein expression. (B) The percentage of fibroblasts with positive α‐SMA staining (red color).
DISCUSSION
It is widely known that peritoneal dialysis causes peritoneal chronic inflammation and fibrosis,1 while the activated macrophages (M2) play a key role in peritoneal fibrosis through secreting TGF‐β.4, 5, 15 Consistent with previous studies, this study in animal model demonstrated that peritoneal dialysis with 4.25% glucose for 28 days significantly induced fibrosis in peritoneum, activated M2 and induced TGF‐β1 expression. Our study demonstrated that peritoneal dialysis significantly decreased Occludin and ZO‐1 protein expression in ileum. Although chronic inflammation and fibrosis have been widely observed in peritoneal dialysis patients, no effective treatments have been developed. This study first demonstrated that ω‐3PUFA effectively inhibited peritoneal inflammation and fibrosis through regulating M2 activation and TGF‐β1 signaling.
A previous study has revealed that M1 displays a CD38+Egr2− phenotype, whereas M2 cells have a CD38−Egr2+ phenotype.19 Thus, the changes in CD38/Erg2 can indicate the tendency of M1 and M2 activation: the increase suggesting more M1 activation whereas the decrease meaning more M2 activation. In this study, Western blots showed that PD significantly decreased the ratio of CD38/Erg2, suggesting that PD caused more activation in M2 cells in peritoneum. https://www.sciencedirect.com/topics/biochemistry-genetics-and-molecular-biology/irf5 is a key contributor of M1 macrophage polarization whereas IRF4 is a contributor of M2 polarization.20, 21 Our study revealed that peritoneal dialysis increased IRF4, but not IRF5 protein expression in peritoneum while the injections of macrophage clean reagent significantly normalized IRF4 expression. Thus, peritoneal dialysis with 4.25% glucose induced M2 activation.
A recent study in animal model demonstrated that TGF‐β1‐VEGF‐A pathway in mesothelial cells and fibroblasts is involved in the peritoneal fibrosis induced by dialysis.22 TGF‐β1 can induce epithelial‐mesenchymal transition via activation of SMAD3 and transcription of TGF‐β receptor 1 (ALK5).23 In this study, the immunohistochemical staining showed that PD significantly increased the expression of TGF‐β1, VEGF and ALK5 in peritoneal tissues. The injections of macrophage clean reagent significantly normalized the changes in these markers. The changes in TGF‐β1–VEGF–ALK5 signaling correlated with M2 activation and fibrosis. However, this is the first study to report the association of ALK5 with peritoneal fibrosis induced by dialysis.
Relative to our understanding of dialysis‐induced peritoneal fibrosis, we know less about the affection of peritoneal dialysis on the digestive system. This study found that peritoneal dialysis significantly decreased the length of ileal villus and the ratio of the depth of crypt/the length of ileal villus, and decreased the expression of ZO‐1 and occludin in ileum. In contrast, injection of macrophage clean reagent had less effects on the structural changes of ileum and ZO‐1 and occludin expression in ileum. Our findings suggest that peritoneal dialysis can affect the structure of the intestine independent from the macrophage‐associated inflammation.
An in vivo study on the effects of DHA on intestinal TJ demonstrated that DHA‐treatment protects intestinal barrier function through normalizing occludin and ZO‐1 expression.24 A study in an in vitro model of human intestinal epithelium demonstrated that n‐6 PUFA, but not n‐3 PUFA affected the presence of occludin in TJ complexes.25 A study in rats with partial hepatectomy showed that n‐3 PUFA enhanced the expression of occludin, claudin‐3 and ZO‐1 in liver and protected the structure of hepatic TJs.26 Ghadiri et al. study on the effect of PUFAs on airway epithelial cells TJ showed no detectable changes in TJ structural morphology stained with anti‐ZO‐1 antibody.27 In this study, both the low and high doses of ω‐3PUFA normalized dialysis‐induced structural changes showing in H&E staining and ZO‐1 and occludin expression, suggesting that ω‐3 fatty acids can protect the intestine from dialysis‐induced injury. A dysfunction of the intestinal barrier function is a risk factor for a variety of disorders and diseases that various viral and bacterial pathogens facilitates their access to the host through modulating TJ proteins.28
The expression of TJ proteins is critical to maintain the integrity of the intestinal epithelial barrier structure which is significant in preventing the entry of microbial toxins, antigens and other harmful substances into the bloodstream.29 The altered structure of ileum during PD could affect its function as a barrier while the entered microbial toxins and antigens can activate macrophages and lymphocytes. The activated macrophages can result in inflammation through secretion of pro‐inflammatory cytokines, such as tumor necrosis factor, IL‐1 and IL‐6.30 However, these pro‐inflammatory cytokines can directly act on epithelial cell TJ to down‐regulate TJ‐related protein expression.31 A previous study demonstrated that exposure to peritoneal dialysis solutions can alter TJ proteins of rat peritoneal mesothelial cells.32 In our PD model, the expression of occludin and ZO‐1 in ileum was decreased, suggesting a damage of intestinal epithelial barrier structure. The increased permeability due to altered ZO‐1 and occluding may affect the transport of organic molecules across the epithelium.6 In this study, ω‐3PUFA in both doses reduced activation of M2. Thus, is it possible to conclude that ω‐3PUFA may have protective effects during PD.
This study also demonstrated that ω‐3PUFA inhibited peritoneal fibrosis through inhibiting activation of fibroblasts and M2 microphages; subsequently the TGF‐β1‐VEGF‐ALK5 signaling in rats received peritoneal dialysis with 4.25% glucose. Although ω‐3 fatty acids have been demonstrated to prolong the survival of patients with heart failure and chronic kidney disease,11, 12 their effects on peritoneal fibrosis have not been reported. This study in a peritoneal dialysis rat model first demonstrated the protective effects of ω‐3 fatty acids on peritoneal fibrosis‐induced side effects. However, several weaknesses of this study should be acknowledged. First, no physiological studies were done on peritoneal membrane to see if there was co‐relation of histological changes to membrane function. Second, no peritoneal equilibration test was performed or ultrafiltration was measured. Third, the expression of occludin and ZO‐1 in peritoneum was not measured. Forth, in this study, the findings were obtained from a chronic experimental model. Whether the levels of mediators released by M2 cells are also increased during actual experimental conditions needs further studies.
In conclusion, ω‐3 fatty acids can provide a protective role in peritoneal dialysis‐induced peritoneal fibrosis and injury of the intestine.
DISCLOSURE
The authors declare that they have no competing interests.
ACKNOWLEDGEMENT
This study was supported by Hunan Provincial Natural Science Foundation of China (No.2019JJ50862).
REFERENCES
- 1. Tomino Y. Mechanisms and interventions in peritoneal fibrosis. Clin. Exp. Nephrol. 2012; 16: 109–14. [DOI] [PubMed] [Google Scholar]
- 2. Zhou Q, Bajo MA, Del Peso G, Yu X, Selgas R. Preventing peritoneal membrane fibrosis in peritoneal dialysis patients. Kidney Int. 2016; 90: 515–24. [DOI] [PubMed] [Google Scholar]
- 3. Raby AC, González‐Mateo GT, Williams A et al. Targeting toll‐like receptors with soluble toll‐like receptor 2 prevents peritoneal dialysis solution‐induced fibrosis. Kidney Int. 2018; 94: 346–62. [DOI] [PubMed] [Google Scholar]
- 4. Onishi A, Morishita Y, Muto S, Kusano E. The mechanism of peritoneal fibrosis in peritoneal dialysis. J. Nephrol. Ther. 2011; S3: 002. [Google Scholar]
- 5. Jiang Z, Zhu L. Update on the role of alternatively activated macrophages in asthma. J. Asthma Allergy 2016; 9: 101–7. [DOI] [PMC free article] [PubMed] [Google Scholar]
- 6. Dokladny K, Zuhl MN, Moseley PL. Intestinal epithelial barrier function and tight junction proteins with heat and exercise. J. Appl. Physiol. (1985) 2016; 120: 692–701. [DOI] [PMC free article] [PubMed] [Google Scholar]
- 7. Van Itallie CM, Anderson JM. Architecture of tight junctions and principles of molecular composition. Semin. Cell Dev. Biol. 2014; 36: 157–65. [DOI] [PMC free article] [PubMed] [Google Scholar]
- 8. Liang GH, Weber CR. Molecular aspects of tight junction barrier function. Curr. Opin. Pharmacol. 2014; 19: 84–9. [DOI] [PMC free article] [PubMed] [Google Scholar]
- 9. Retana C, Sanchez E, Perez‐Lopez A et al. Alterations of intercellular junctions in peritoneal mesothelial cells from patients undergoing dialysis: Effect of retinoic acid. Perit. Dial. Int. 2015; 35: 275–87. [DOI] [PMC free article] [PubMed] [Google Scholar]
- 10. Durrington PN, Bhatnagar D, Mackness MI et al. An omega‐3 polyunsaturated fatty acid concentrate administered for one year decreased triglycerides in simvastatin treated patients with coronary heart disease and persisting hypertriglyceridaemia. Heart 2001; 85: 544–8. [DOI] [PMC free article] [PubMed] [Google Scholar]
- 11. Duda MK, O'Shea KM, Stanley WC. Omega‐3 polyunsaturated fatty acid supplementation for the treatment of heart failure: Mechanisms and clinical potential. Cardiovasc. Res. 2009; 84: 33–41. [DOI] [PMC free article] [PubMed] [Google Scholar]
- 12. Sikorska‐Wiśniewska M, Mika A, Śledziński T et al. Disorders of serum omega‐3 fatty acid composition in dialyzed patients, and their associations with fat mass. Ren. Fail. 2017; 39: 406–12. [DOI] [PMC free article] [PubMed] [Google Scholar]
- 13. Kajikawa S, Imada K, Takeuchi T et al. Eicosapentaenoic acid attenuates progression of hepatic fibrosis with inhibition of reactive oxygen species production in rats fed methionine‐ and choline‐deficient diet. Dig. Dis. Sci. 2011; 56: 1065–74. [DOI] [PubMed] [Google Scholar]
- 14. Kajikawa S, Harada T, Kawashima A, Imada K, Mizuguchi K. Highly purified Eicosapentaenoic acid ethyl Ester prevents development of steatosis and hepatic fibrosis in rats. Dig. Dis. Sci. 2010; 55: 631–41. [DOI] [PubMed] [Google Scholar]
- 15. Wang J, Jiang ZP, Su N et al. The role of peritoneal alternatively activated macrophages in the process of peritoneal fibrosis related to peritoneal dialysis. Int. J. Mol. Sci. 2013; 14: 10369–82. [DOI] [PMC free article] [PubMed] [Google Scholar]
- 16. Sobolewska A, Bogucka J, Dankowiakowska A, Elminowska‐Wenda G, Stadnicka K, Bednarczyk M. The impact of synbiotic administration through in ovo technology on the microstructure of a broiler chicken small intestine tissue on the 1st and 42nd day of rearing. J. Anim. Sci. Biotechnol. 2017; 8: 61. [DOI] [PMC free article] [PubMed] [Google Scholar]
- 17. Zhang X, Goncalves R. The isolation and characterization of murine macrophages. Curr. Protoc. Immunol. 2008. Chapter 14(83): Unit 14.1. [DOI] [PMC free article] [PubMed] [Google Scholar]
- 18. Zhang Y, Wang Y, Wang L, Bai M, Zhang X, Zhu X. Dopamine receptor D2 and associated microRNAs are involved in stress susceptibility and resistance to escitalopram treatment. Int. J. Neuropsychopharmacol. 2015; 18: pyv025. [DOI] [PMC free article] [PubMed] [Google Scholar]
- 19. Jablonski KA, Amici SA, Webb LM et al. Novel markers to delineate murine M1 and M2 macrophages. PLoS One 2015; 10: e0145342. [DOI] [PMC free article] [PubMed] [Google Scholar]
- 20. Ferrante CJ, Leibovich SJ. Regulation of macrophage polarization and wound healing. Adv. Wound Care 2012; 1: 10–6. [DOI] [PMC free article] [PubMed] [Google Scholar]
- 21. Chistiakov DA, Myasoedova VA, Revin VV, Orekhov AN, Bobryshev YV. The impact of interferon‐regulatory factors to macrophage differentiation and polarization into M1 and M2. Immunobiology 2018; 223: 101–11. [DOI] [PubMed] [Google Scholar]
- 22. Kariya T, Nishimura H, Mizuno M et al. TGF‐β1‐VEGF‐A pathway induces neoangiogenesis with peritoneal fibrosis in patients undergoing peritoneal dialysis. Am. J. Physiol. Renal Physiol. 2018; 314: F167–80. [DOI] [PubMed] [Google Scholar]
- 23. Boldbaatar A, Lee S, Han S et al. Eupatolide inhibits the TGF‐β1‐induced migration of breast cancer cells via downregulation of SMAD3 phosphorylation and transcriptional repression of ALK5. Oncol. Lett. 2017; 14: 6031–9. [DOI] [PMC free article] [PubMed] [Google Scholar]
- 24. Zhao J, Shi P, Sun Y et al. DHA protects against experimental colitis in IL‐10‐deficient mice associated with the modulation of intestinal epithelial barrier function. Br. J. Nutr. 2015; 114: 181–8. [DOI] [PubMed] [Google Scholar]
- 25. Beguin P, Errachid A, Larondelle Y, Schneider YJ. Effect of polyunsaturated fatty acids on tight junctions in a model of the human intestinal epithelium under normal and inflammatory conditions. Food Funct. 2013; 4: 923–31. [DOI] [PubMed] [Google Scholar]
- 26. Yan XP, Wang S, Yang Y, Qiu YD. Effects of n‐3 polyunsaturated fatty acids on rat livers after partial hepatectomy via LKB1‐AMPK signaling pathway. Transplant. Proc. 2011; 43: 3604–12. [DOI] [PubMed] [Google Scholar]
- 27. Ghadiri M, Mamlouk M, Spicer P et al. Effect of polyunsaturated fatty acids (PUFAs) on airway epithelial cells' tight junction. Pulm. Pharmacol. Ther. 2016; 40: 30–8. [DOI] [PubMed] [Google Scholar]
- 28. König J, Wells J, Cani PD et al. Human intestinal barrier function in health and disease. Clin. Transl. Gastroenterol. 2016; 7: e196. [DOI] [PMC free article] [PubMed] [Google Scholar]
- 29. Vaziri ND, Yuan J, Nazertehrani S, Ni Z, Liu S. Chronic kidney disease causes disruption of gastric and small intestinal epithelial tight junction. Am. J. Nephrol. 2013; 38: 99–103. [DOI] [PubMed] [Google Scholar]
- 30. Arango Duque G, Descoteaux A. Macrophage cytokines: Involvement in immunity and infectious diseases. Front. Immunol. 2014; 5: 491. [DOI] [PMC free article] [PubMed] [Google Scholar]
- 31. Zhou HY, Zhu H, Yao XM et al. Metformin regulates tight junction of intestinal epithelial cells via MLCK‐MLC signaling pathway. Eur. Rev. Med. Pharmacol. Sci. 2017; 21: 5239–46. [DOI] [PubMed] [Google Scholar]
- 32. Debray‐García Y, Sánchez EI, Rodríguez‐Muñoz R, Venegas MA, Velazquez J, Reyes JL. Diabetes and exposure to peritoneal dialysis solutions alter tight junction proteins and glucose transporters of rat peritoneal mesothelial cells. Life Sci. 2016; 161: 78–89. [DOI] [PubMed] [Google Scholar]


