

Abstract
New Findings
-
What is the central question of this study?
Type 2 diabetes mellitus (T2DM) causes skeletal muscle atrophy; does it affect resistance training (RT)‐mediated molecular adaptations and subsequent muscle hypertrophy?
-
What is the main finding and its importance?
Although skeletal muscle mass and regulation were not preserved under conditions of T2DM, the response of RT‐induced skeletal muscle hypertrophy was not impaired in T2DM rat skeletal muscle. These findings suggest that the capacity of RT‐mediated muscle mass gain is not diminished in the T2DM condition.
Abstract
Type 2 diabetes mellitus (T2DM) is known to cause skeletal muscle atrophy. However, it is not known whether T2DM affects resistance training (RT)‐mediated molecular adaptations and subsequent muscle hypertrophy. Therefore, we investigated the effect of T2DM on response of skeletal muscle hypertrophy to chronic RT using a rat resistance exercise mimetic model. T2DM and healthy control rats were subjected to 18 bouts (3 times per week) of chronic RT on unilateral lower legs. RT significantly increased gastrocnemius muscle mass and myonuclei in both T2DM and healthy control rats to the same extent, even though T2DM caused muscle atrophy in the resting condition. Further, T2DM significantly reduced mechanistic target of rapamycin complex 1 (mTORC1) activity (phosphorylation of p70S6KThr389 and 4E‐BP1Thr37/46) to insulin stimulation and the number of myonuclei in the untrained basal condition, but RT‐mediated adaptations were not affected by T2DM. These findings suggested that although the skeletal muscle mass and regulation were not preserved under basal conditions of T2DM, the response of RT‐induced skeletal muscle hypertrophy was not impaired in T2DM rat skeletal muscle.
Keywords: muscle hypertrophy, resistance training, type 2 diabetes
1. INTRODUCTION
Skeletal muscle, apart from being the machinery for force generation, is an essential organ for glucose storage and metabolism. Therefore, maintaining or improving skeletal muscle mass is an efficient way to manage blood glucose (Srikanthan & Karlamangla, 2011). Skeletal muscle mass is believed to be determined by the balance between protein synthesis and protein breakdown (Damas, Phillips, Vechin, & Ugrinowitsch, 2015). In fact, positive muscle protein net balance (e.g. mechanical stress) results in muscle mass gain (Goodman et al., 2011; Ogasawara et al., 2016). Conversely, negative muscle protein net balance (e.g. muscle unloading) causes loss of muscle mass (Baehr et al., 2017).
Type 2 diabetes mellitus (T2DM) is a chronic metabolic disorder characterized by hyperglycaemia and insulin resistance (Baron, Brechtel, Wallace, & Edelman, 1988; DeFronzo & Tripathy, 2009). Although detailed mechanisms remain unclear, T2DM causes skeletal muscle atrophy and loss of myonuclei (Katta et al., 2010; Peterson, Bryner, & Alway, 2008; Wang, Hu, Hu, Du, & Mitch, 2006). Dysregulation of protein metabolism might be associated with T2DM‐induced muscle atrophy (Bassil & Gougeon, 2013). In fact, mechanistic target of rapamycin complex 1 (mTORC1), an important regulator of muscle protein synthesis (MPS), became less reactive to insulin in the T2DM state (Chang, Le Marchand‐Brustel, Cheatham, & Moller, 1995; Williamson et al., 2014). Furthermore, an increment in muscle protein degradation is believed to be another factor in the loss of muscle mass by T2DM. A previous animal study observed that signalling associated with autophagy and pro‐apoptosis does not necessarily increase in skeletal muscle of T2DM model animals (Turpin et al., 2009). However, T2DM model mice showed that the ubiquitin–proteasome system was activated in the skeletal muscle (Wang et al., 2006). Thus, enlargement of ubiquitin–proteasome system‐mediated protein degradation might be associated with muscle atrophy caused by T2DM. Although a clear cause of myonuclear loss in T2DM is ill‐defined, dysfunction of the satellite cells, which are an essential source of myonuclei, has been observed in skeletal muscle of T2DM model animals (D'Souza et al., 2015; Peterson et al., 2008). Thus, it is believed that satellite cell dysfunction might partly be associated with loss of myonuclei in T2DM (Peterson et al., 2008).
Resistance training (RT), which is any exercise that makes the muscle work against an external weight or force, induces muscle hypertrophy. These adaptations were related to both the muscle protein synthesis response via the activation of mTORC1 (Ogasawara et al., 2016; West et al., 2016) and myonuclear accretion via the satellite cells (Egner, Bruusgaard, & Gundersen, 2016; Fry et al., 2014; McCarthy et al., 2011; Snijders et al., 2016). Interestingly, previous rodent and human experiments showed that, unlike a nutritional stimulus, mTORC1 activation and the MPS response to acute resistance exercise or high‐force muscle contraction were not impaired in T2DM (Hulston et al., 2018; Katta et al., 2009a). Furthermore, a previous animal study observed that satellite cell activation to muscle contraction is not impaired in the T2DM model rat (Peterson et al., 2008). Given that the transient response of mTORC1, MPS and satellite cell activation is closely relevant to chronic RT‐mediated skeletal muscle adaptation (Baar & Esser, 1999; Bellamy et al., 2014; Damas et al., 2016), T2DM might not necessarily impair RT‐induced myonuclear accretion and muscle mass gain. However, previous studies observed that overload (an animal model of muscle contraction‐induced hypertrophy)‐induced muscle hypertrophy is impaired along with a reduction in mTORC1 activation in a T2DM animal model (Katta et al., 2010; Sitnick, Bodine, & Rutledge, 2009). Conversely, another study reported that impaired muscle hypertrophy is not observed with overload in a diabetic model rat (Peterson et al., 2008). Thus, although it is clear that T2DM causes muscle atrophy, the effect of load‐induced molecular adaptations and muscle mass gain in T2DM remains controversial and unknown.
Muscle overload in a synergistic muscle ablation model is very useful for understanding load‐induced skeletal muscle adaptation (Goodman et al., 2011; McCarthy et al., 2011). On the other hand, the muscle‐loading pattern is largely different between overload and conventional RT. Overload largely refers to constitutive loading on muscle, while RT is repetitive and intermittent acute exercise. Additionally, overload does not necessarily show physiological muscle adaptation (∼50% muscle fibre hypertrophy within 2 weeks) (Goodman et al., 2011; McCarthy et al., 2011) as compared with conventional RT (∼30% fibre hypertrophy within 12 weeks) (Damas et al., 2016; Snijders et al., 2016). Thus, rather than investigating the effect of overload on T2DM skeletal muscle as done in previous studies, it is important to examine the effect of RT on muscle hypertrophy in T2DM.
In this present study, we performed chronic RT on a T2DM model rat using an electrical stimulation‐evoked resistance exercise model to investigate the influence of T2DM on RT‐mediated molecular adaptations and muscle hypertrophy.
2. METHODS
2.1. Ethical approval
The experimental procedure in the present study was approved by the Ethics Committee for Animal Experiments at Ritsumeikan University (BKC2016‐041). The present study complied with principles and standards for reporting animal experiments in Experimental Physiology (Grundy, 2015).
2.2. Animals
Male Otsuka Long–Evans Tokushima Fatty (OLETF, n = 7) rats, and Long–Evans Tokushima Otsuka (LETO, n = 5) rats were purchased from Japan SLC (Shizuoka, Japan). OLETF rats and LETO rats were selectively bred and established from Long–Evans rats. Obesity and diabetes were induced by hyperphagia in OLETF rats (Kawano, Hirashima, Mori, & Natori, 1994). LETO rats were used as a healthy control for the OLETF rats. The animals were housed with an environmental temperature of 22–24°C with a 12 h light–dark cycle. Food and water were provided ad libitum. The required sample size was calculated on the basis of the effect size of the exercise training model calculated from previous studies (Kido, Ato, Yokokawa, Sato, & Fujita, 2018; Ogasawara et al., 2016), with statistical power (0.8) and critical P‐value (P < 0.05) using G*Power (v. 3.1.9.2).
2.3. Chronic RT procedure
Acute resistance exercise (details are given in the ‘Mimetic of resistance exercise’ section) was performed 3 days per week (e.g. Mon, Wed, Fri or Tue, Thu, Sat) over a period of 6 weeks (total 18 bouts) from 20 weeks old. To exclude an acute exercise response, sampling was performed approximately 72 h after the final exercise. After an overnight fast, animals were intraperitoneally injected with insulin (0.5 U (kg body weight)−1) and 10 min later killed by blood removal from the heart under inhaled isoflurane anaesthesia (with 4–5% concentration for anaesthetic induction and 2% concentration used for maintenance of anaesthesia; SN‐487, Shinano Seisakusho, Tokyo, Japan); gastrocnemius muscles were then sampled. Insulin was administered to distinguish the sensitivity of mTORC1 signalling to insulin and RT‐induced skeletal muscle mass adaptation. The gastrocnemius muscle was divided into lateral gastrocnemius (LG) muscle and medial gastrocnemius (MG) muscle. MG muscles were frozen in liquid nitrogen and stored at –80°C until analysis. The central part of LG muscle was trimmed (5 mm × 5 mm size) and fixed in relaxing solution containing 4% paraformaldehyde for more than 2 days.
2.4. Mimetic of acute resistance exercise
Under inhalation isoflurane anaesthesia (with 4–5% concentration for anaesthetic induction and 2% concentration for maintenance of anaesthesia), the hair of the lower limbs was shaved and wiped clean. The rats were then positioned in the prone posture and the right foot was set on a footplate (foot and tibia angle was set at 90°). The right triceps surae were contracted by percutaneous electrical stimulation, while the left leg acted as the non‐exercised control (unilateral muscle contraction). Stimulation frequency was 100 Hz, voltage (∼30 V) was set at maximal tetanic contraction force and contraction was exerted for 3 s, with a 7 s interval. A total of 10 contractions per set and a total of five such sets with a 3 min rest period in between each set were performed as the acute resistance exercise regimen. After an acute exercise, we monitored the animals until they are fully awake from anaesthesia, and subsequently they were returned to the cages.
2.5. Western blot analysis
Western blot analysis was performed as described previously (Ato, Makanae, Kido, & Fujita, 2016). Briefly, powdered frozen MG muscle tissues were homogenized in RIPA buffer containing phosphatase and protease inhibitor (Roche Life Science, Indianapolis, IN, USA). Homogenates were then centrifuged at 12,000 g for 10 min at 4°C, and protein concentration from supernatant was measured using the Protein Assay Rapid Kit (Wako Pure Chemical Corp., Osaka, Japan). Samples were diluted in 3 × Laemmli sample buffer and boiled for 5 min at 95°C. Protein samples (10–30 µg) were separated by SDS‐PAGE (10% and 15% gels), and subsequently transferred to polyvinylidene difluoride membranes (Immobilon‐P; Merck Millipore, Darmstadt, Germany). Membranes were washed in Tris‐buffered saline containing 0.1% Tween 20 (TBST) and blocked with 5% powdered milk in TBST for 1 h at room temperature. Membranes were incubated with primary antibody against phospho (p)‐p70S6K Thr389 (no. 9205, Cell Signaling Technology, Danvers, MA, USA), p‐4E‐BP1 Thr37/46 (no. 9459, Cell Signaling Technology), p‐ribosomal protein S6 (rpS6) (no. 2215, Cell Signaling Technology), light chain 3 (LC3) (no. 2775, Cell Signaling Technology), p62 (no. PM045, MBL, Nagoya, Japan) ubiquitin (no. 3933, Cell Signaling Technology), p53 (no. sc‐126, Santa Cruz Biotechnology, Dallas, TX, USA), GPR78/binding immunoglobulin protein (BiP) (no. sc‐376768, Santa Cruz Biotechnology), sucrose‐non‐fermenting protein kinase 1 (SNF1)/AMP‐activated protein kinase (AMPK)‐related kinase (SNARK) (no. 4100, Cell Signaling Technology), caspase‐3 (no. 9662, Cell Signaling Technology), Pax7 (no. sc‐81648, Santa Cruz Biotechnology), and MyoD (no. sc‐32758, Santa Cruz Biotechnology) overnight at 4°C. After overnight incubation, membranes were incubated with horseradish peroxidase‐conjugated secondary antibody for 60 min at room temperature. Protein bands were captured by chemiluminescence (Luminata Forte Western HRP Substrate; Merck Millipore) with an ImageQuant LAS 4000 imaging system (GE Healthcare, Chicago, IL, USA). After chemiluminescence detection, membranes were washed and stained with Coomassie brilliant blue (CBB), and images were scanned using the LAS 4000. Densitometry analysis was performed using ImageJ software (v.1.46; National Institutes of Health, Bethesda, MD, USA). Intensity of protein bands was normalized by CBB ladder band intensity, and normalized values were used for statistical analysis.
2.6. Myofibre isolation and morphometric analysis
Isolation of single myofibres was performed as reported previously (Wada, Takahashi, Katsuta, & Soya, 2002). Briefly, fixed muscles were incubated in 40% NaOH solution for 3 h at room temperature and then shaken in 20% NaOH solution for 8 min. Isolated myofibres were collected under a dissecting microscope and washed with phosphate‐buffered saline. Fibres were placed on MAS‐coated slides (Matsunami Glass, Osaka, Japan) and mounted with 4′,6‐diamidino‐2‐phenylindole (DAPI) (Vector Laboratories, Burlingame, CA, USA). Eighty fibres were collected per group (20 fibres were obtained from contralateral and trained leg in animals of the top and bottom two hypertrophic responses in each group). Mean fibre cross‐sectional area (CSA; mean 20 fibres as n = 1) in an individual leg was used to compare the change in fibre CSA (n = 4/condition/group). The required fibre numbers were calculated on the basis of the effect size of exercise training, with statistical power (0.8), and critical P‐value (P < 0.05) using G*Power software (ver. 3.1.9.2). Morphology of the myofibres was analysed as reported previously (Zhong, Roy, Siengthai, & Edgerton, 2005). Z‐stack image (with 1 µm interval) was filmed 20 times at three randomized points (near the middle of each fibre segment) per fibre using fluorescence microscopy (BZ9000; Keyence, Osaka, Japan). The myonuclear number, fibre diameter (estimated CSA) width × Z‐depth × π), fibre length and sarcomere length were measured and normalized using BZ Analyzer software (Keyence). Nuclear number counting was performed using an automated cell counter in BZ Analyzer software. The myonuclear number per millimetre fibre and CSA were multiplied by the average sarcomere length and divided by 2.5 (resting sarcomere length) to standardize differences in the conditions of stretch. The myonuclear domain size was calculated by fibre diameter multiplied by fibre length (fibre volume, µm3) and then divided by the myonuclear number (cytosolic volume per nucleus).
2.7. Statistical analysis
Student's unpaired t test was used to compare the body weight, blood glucose concentration and epididymal adipose tissue weight. Two‐way (T2DM × training) analysis of variance (ANOVA) was used to evaluate the change in skeletal muscle size, nuclear number, nuclear domain size, phosphorylated protein, and total protein expression (JMP PRO 14.0.0; SAS Institute, Cary, NC, USA). For significant differences, post hoc analyses were performed using t tests, with a Benjamini and Hochberg false discovery rate correction for multiple comparisons. All values are expressed as means ± standard deviation (SD). Pearson's product moment correlation coefficient was used for correlation analyses. A P value <0.05 was considered to be statistically significant.
3. RESULTS
3.1. Body weight, fasting blood glucose and epididymal adipose tissue weight
Body weight and epididymal adipose tissue weight were significantly higher in T2DM rats than in healthy rats after RT (P < 0.0001, Figure 1a,c). Further, the T2DM rat showed a significantly higher fasting blood glucose level as compared with healthy rats after RT (P < 0.0001) (Figure 1b).
Figure 1.
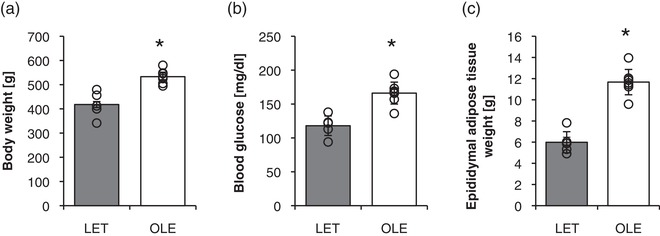
Physiological parameters of control and T2DM rats. Body weight (a), blood glucose (b), epididymal adipose tissue (c) in control and T2DM rats. LET (LETO), n = 5; OLE (OLETF), n = 7. *P < 0.05 vs. LET. Values are means ± SD
3.2. Change in skeletal muscle mass under T2DM and chronic RT in rat
We next evaluated the effect of RT on skeletal muscle wet weight in T2DM and healthy rats (Figure 2a). The skeletal muscle wet weight was significantly higher in T2DM rats than in healthy control rats in the untrained basal state (control leg) (main effect of T2DM; P < 0.0001). Further, when compared with the control leg, the RT leg had significantly increased skeletal muscle wet weight in similar proportions in both T2DM and control rats (P < 0.0001). Skeletal muscle wet weight per body weight was significantly lower in T2DM rats in comparison with those of the control rats in the untrained basal state (main effect of T2DM; P < 0.0001, Figure 2b). In addition, chronic RT significantly increased skeletal muscle wet weight per body weight in both groups to the same extent (main effect of training; P < 0.0001 vs. control leg).
Figure 2.
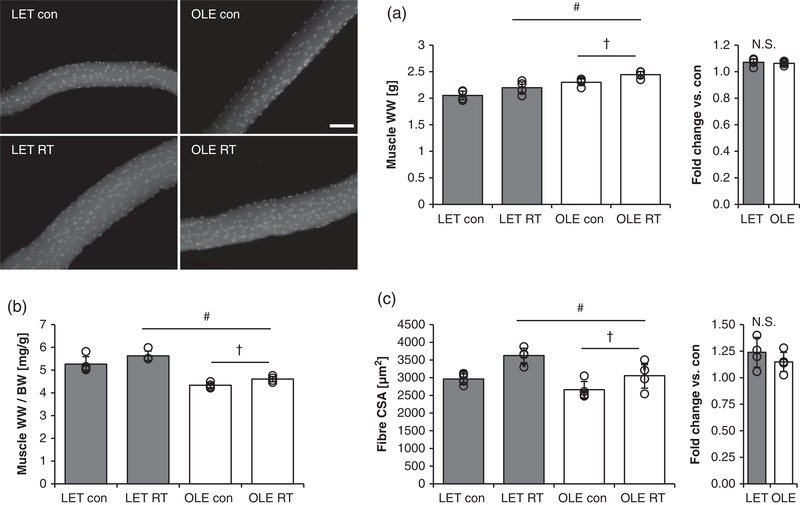
Effect of T2DM and resistance training on skeletal muscle size. Effect of RT on skeletal muscle mass (a,b; LET n = 5, OLE n = 7), fibre CSA (c; average value from 80 fibres in each condition, n = 4 per group) in control and T2DM rats. BW, body weight; RT, resistance training; WW, wet weight. #Main effect of training (P < 0.05). †Main effect of T2DM (P < 0.05). Values are means ± SD
The calculated muscle fibre CSA in T2DM rats was significantly lower as compared with that in control rats in the basal state (main effect of T2DM; P = 0.0107, Figure 2c). Similar to the muscle wet weight, fibre CSA significantly increased after RT in both groups to the same extent (main effect of training; P = 0.0024, Figure 2c).
3.3. Effect of T2DM and chronic RT on mTORC1 targeting substrates in rat skeletal muscle
Level of p70S6K Thr389 phosphorylation was significantly lower in T2DM rat than in control rat skeletal muscle in the control leg in the basal state with insulin treatment condition (main effect of T2DM; P = 0.0008, Figure 3a). Further, chronic RT did not alter the level of p70S6K Thr389 phosphorylation in both groups. As with p70S6K, phosphorylation of ribosomal protein S6 (rpS6) Ser240/244, the downstream target of p70S6K, was significantly lowered in T2DM rats compared with control rats in the basal state (main effect of T2DM; P = 0.0342, Figure 3b). Further, T2DM rats exhibited significantly lower phosphorylation of 4E‐BP1 Thr37/46 compared with control rats in the basal state (main effect of T2DM; P = 0.0357, Figure 3c). In addition, similar to p70S6K, the trained leg did not show altered phosphorylation of 4E‐BP1 Thr37/46 in both groups.
Figure 3.
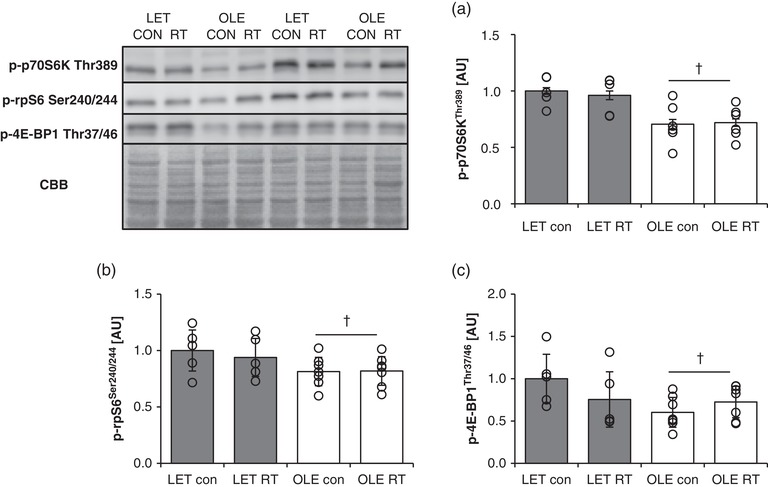
Effect of T2DM and resistance training on mTORC1 substrates in rat skeletal muscle. p‐p70S6K Thr389 (a), p‐rpS6 Ser240/244 (b), and p‐4E‐BP1 Thr37/46 (c) protein expression in control (LET, n = 5) and T2DM (OLE, n = 7) rat skeletal muscle. #Main effect of training (P < 0.05). †Main effect of T2DM (P < 0.05). Values are means ± SD
3.4. Effect of T2DM and chronic RT on signalling related to muscle protein breakdown in rat skeletal muscle
T2DM and chronic RT did not affect the LC3 II/I ratio, a marker of isolation membrane formation (Figure 4a). Further, p62, a substrate‐selective degradation in autophagy, was not influenced by T2DM and chronic RT (Figure 4b). Conversely, the level of ubiquitinated proteins, substrates for proteasomal degradation, was significantly lower in the control leg of T2DM rats than in the control leg of healthy control rats (P = 0.0010 vs. LET con, Figure 4c).
Figure 4.
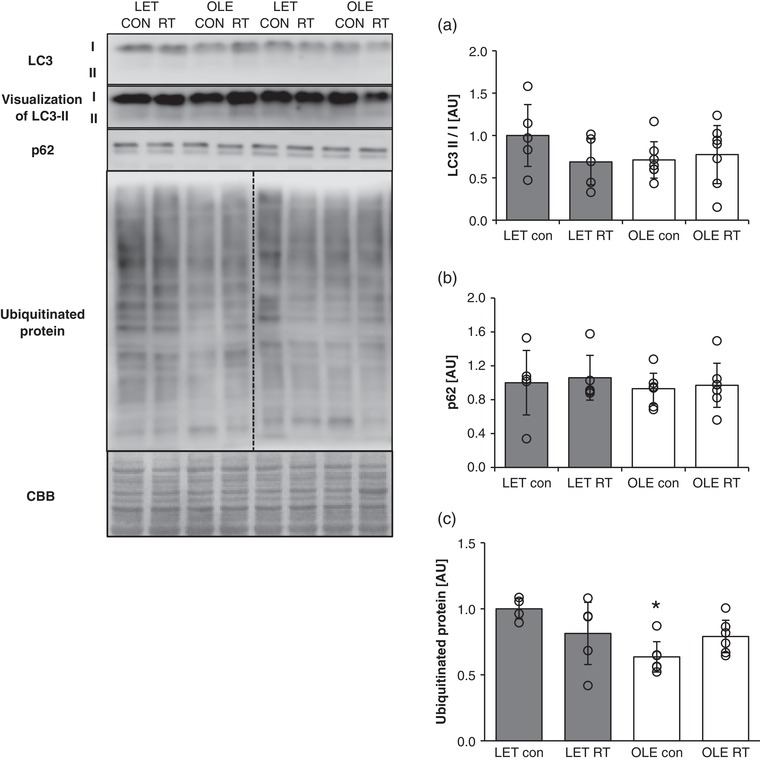
Effect of T2DM and resistance training on autophagy and ubiquitin–proteasome substrates in rat skeletal muscle. (a) LC3 II/I. (b) p62. (c) Expression of ubiquitinated protein in control (LET, n = 5) and T2DM (OLE, n = 7) rat skeletal muscle. *P < 0.05 vs. LET con. Values are means ± SD
3.5. Effect of T2DM and chronic RT on myonuclear content in rat skeletal muscle
The myonuclear numbers per unit fibre length were significantly lower in the control leg of T2DM rats as compared with those in healthy control rats (main effect of T2DM; P < 0.0001, Figure 5a). In addition, successive RT significantly increased myonuclear content in both groups to the same extent (main effect of training; P = 0.0094 vs. control leg, Figure 5a). The myonuclear domain size, a measure of cytosolic volume per nucleus, was significantly larger in the T2DM group than in the healthy control group (main effect of T2DM; P = 0.0038, Figure 5b).
Figure 5.
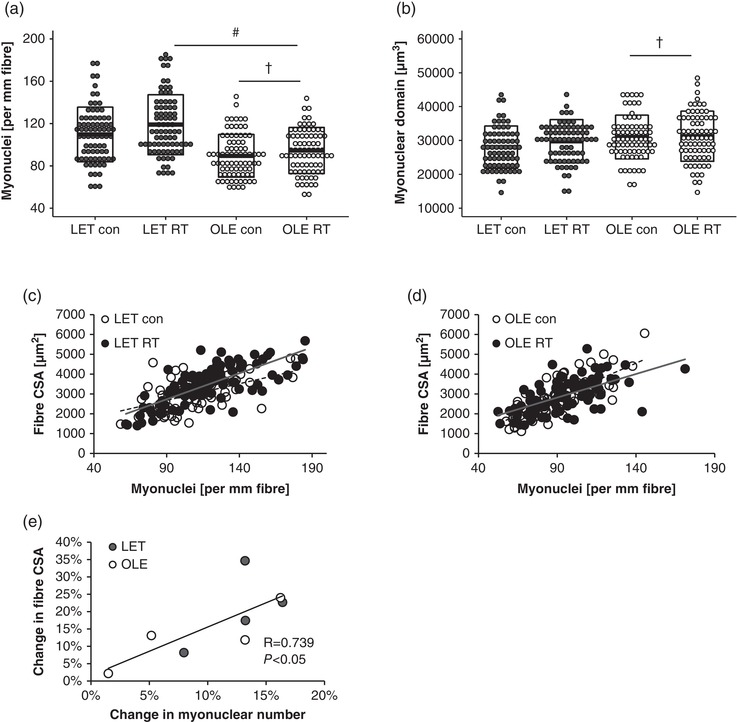
Effect of T2DM and resistance training on myonuclear number and myonuclear domain size. (a) Myonuclear number per unit fibre. (b) Myonuclear domain size. #Main effect of training (P < 0.05). †Main effect of T2DM (P < 0.05). Box indicates means ± SD. (c,d) Relationship between myonuclear number and fibre cross‐sectional area (CSA) in control rat (c) and T2DM rat (d). (e) Relationship between change in myonuclear numbers vs. change in fibre CSA
3.6. Relationship between myonuclear number and response of muscle hypertrophy to RT
A positive relationship between myonuclear number and fibre CSA was observed in control (r = 0.687, P = 0.0001, Figure 5c) and T2DM groups (r = 0.688, P = 0.0001, Figure 5d). A significant positive correlation was observed between percentage change in myonuclear number and percentage change in fibre CSA (r = 0.739, P = 0.0362, Figure 5e).
3.7. Effect of T2DM and chronic RT on the expression of apoptosis‐associated molecules in rat skeletal muscle
T2DM rat showed significantly lower p53 expression in control legs as compared with that in control rat (main effect of T2DM; P = 0.0050 vs. control rat, Figure 6a). Further, chronic RT significantly increased p53 expression in both groups (main effect of training; P = 0.0427, Figure 6a). Voltage‐dependent anion‐selective channel 1 (VDAC1) expression was unaltered in the resting state and after RT in both groups (Figure 6b). BiP/GRP78 was significantly decreased in T2DM rats in the basal state (main effect of T2DM; P = 0.0245 vs. control rat, Figure 6c). Changes in different forms of caspase‐3 expression are shown in Figure 6d (full‐length), Figure 6e (cleaved) and Figure 6f (cleaved/full‐length). Full‐length caspase‐3 was significantly increased in trained legs in both groups (main effect of training; P = 0.0009). T2DM rats showed significantly lower levels of cleaved caspase‐3 compared with the control rats in the basal state (main effect of T2DM; P = 0.009). The ratio of cleaved to full‐length caspase‐3 was significantly lowered in T2DM rats compared with that in control rats (main effect of T2DM; P = 0.0031). Additionally, RT significantly reduced the ratio when compared with the control legs in either group (main effect of training; P = 0.0124). In contrast, SNARK expression was unchanged in the resting state and after RT in both groups (Figure 6g).
Figure 6.
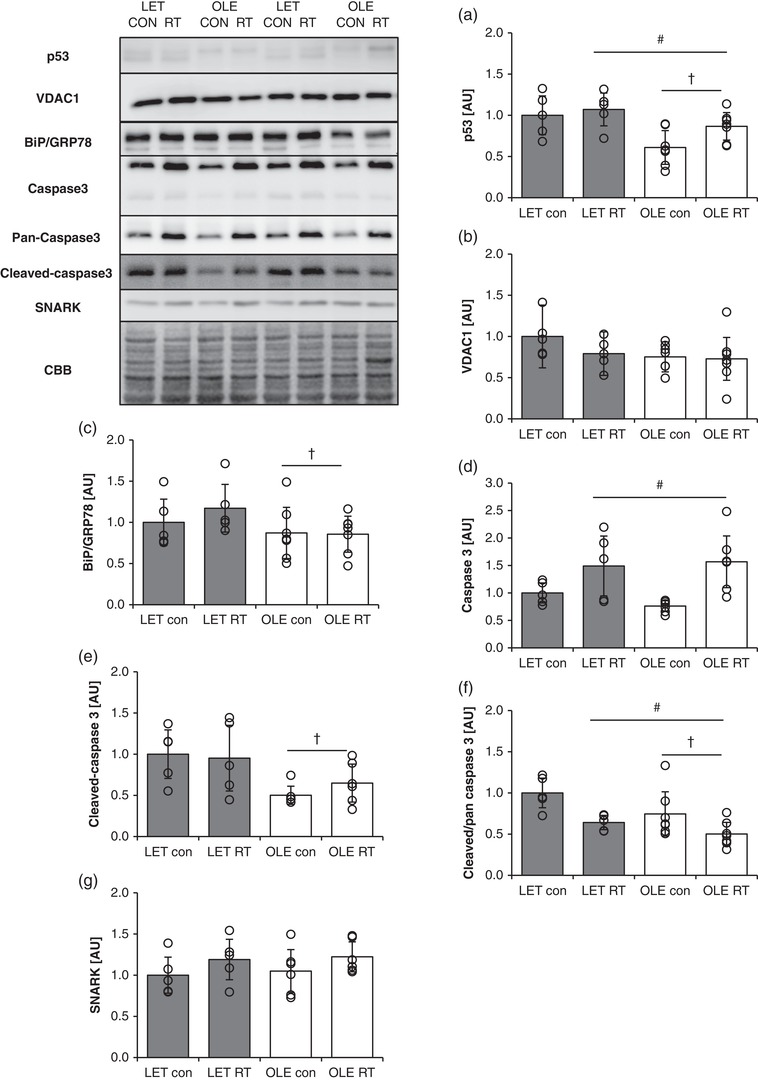
Influence of T2DM and resistance training on expression and activation of apoptosis‐related proteins in rat skeletal muscle. p53 (a), VDAC1 (b), BiP/GRP78 (c), full‐length caspase‐3 (d), cleaved caspase‐3 (e), ratio of cleaved caspase‐3/full‐length caspase‐3 (f) SNARK (g) in control (LET, n = 5) and T2DM (OLE, n = 7) rat skeletal muscle. #Main effect of training. †Main effect of T2DM. Values are means ± SD
3.8. Effect of T2DM and chronic RT on the expression of myogenic regulatory factors in rat skeletal muscle
T2DM rats showed significantly lower Pax7 protein expression as compared with control rats (main effect of T2DM; P = 0.0030, Figure 7a). On the other hand, MyoD expression was not statistically different between group at basal state and after chronic RT (Figure 7b).
Figure 7.
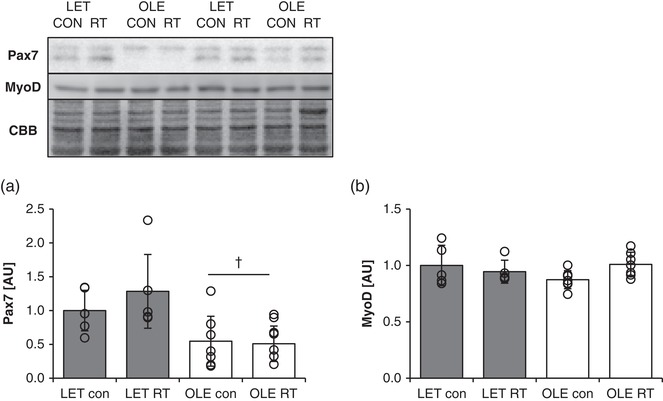
Effect of T2DM and resistance training on myogenic regulatory factors in rat skeletal muscle. Pax7 (a) and MyoD (b) protein expression in control (LET, n = 5) and T2DM (OLE, n = 7) rat skeletal muscle. †Main effect of T2DM (P < 0.05). Values are means ± SD
4. DISCUSSION
In the current study, we evaluated the effect of T2DM on RT‐mediated muscle hypertrophy using a RT mimetic rodent model. Although the skeletal muscle mass, number of myonuclei and mTORC1 activity deteriorated in T2DM rats compared with healthy control rats in the resting state, RT‐mediated muscle mass gain and myonuclear accretion in T2DM rats were similar to those observed in healthy control rats. Collectively, T2DM affects regulation of resting skeletal muscle mass and relevant molecular signalling in the resting state but not RT‐mediated skeletal muscle adaptation.
Previous studies have reported that spontaneous obese T2DM rats and high fat feeding‐induced T2DM mice showed a reduction of muscle size (Abrigo et al., 2016; Katta et al., 2010; Peterson et al., 2008; Wang et al., 2006). We observed that in the resting state, although skeletal muscle wet weight was higher in the T2DM rats, the estimated fibre CSA was significantly lower as compared with that in healthy rats, similar to the previous reports. Though the exact reason for the discrepancy in the results for muscle wet weight and fibre CSA is unclear, previous studies have reported that T2DM increases accumulation of cellular matrix content, such as extra myocellular lipid and/or collagen content, in skeletal muscle (Hua et al., 2017; Pincu, Linden, Zou, Baynard, & Boppart, 2015). Therefore, it is likely that alteration of factors other than myofibre size might be responsible for the muscle wet weight in T2DM rats. Furthermore, 18 bouts of RT significantly increased muscle wet weight and myofibre CSA in both T2DM and control groups to the same extent. There have been inconsistent reports on whether overload‐induced muscle hypertrophy is impaired in T2DM rats (Katta et al., 2010; Peterson et al., 2008; Sitnick et al., 2009). Our results with the RT mimetic rodent model support a previous observation that overload‐mediated muscle hypertrophy is not impaired at physiological levels (up to 30% hypertrophy) (Peterson et al., 2008). Thus, the present result indicated that modest muscle hypertrophy to RT is not necessarily impaired under the condition of T2DM.
mTORC1 is believed to be a principle positive regulator of muscle protein synthesis and RT‐mediated muscle hypertrophy (Drummond et al., 2009; Ogasawara et al., 2016). mTORC1 activity is typically measured by the phosphorylation status of its direct substrates, p70S6K and 4E‐BP1 (Sabatini, 2017). In the current study, the phosphorylation levels of downstream substrates of mTORC1, p70S6K, 4E‐BP1 and rpS6, were significantly reduced under insulin‐exposed condition in T2DM rat muscle in the resting state. This observation was consistent with a previous report (Katta et al., 2009b). Therefore, it is possible that a reduced or impaired mTORC1 activity to a nutritional stimulus (e.g. insulin or amino acid) may lead to loss of myofibre size in T2DM. Moreover, in the current study, chronic RT failed to improve the phosphorylation status of mTORC1 downstream substrates in the insulin‐treated condition in T2DM. In contrast, a previous study observed that endurance training recovered mTORC1 activity in striated muscle (Takamura, Nomura, Uchiyama, & Fujita, 2017). A conceivable reason for this difference could be that in the current study, RT was performed topically on only the right lower leg, unlike the systemic endurance training in the previous study. Moreover, basal mTORC1 activity is affected by systemic nutritional status such as insulin and/or lipid (Gordon, Steiner, Lang, Jefferson, & Kimball, 2014; Khamzina, Veilleux, Bergeron, & Marette, 2005). These parameters were improved by endurance training in the previous study (Takamura et al., 2017). Thus, local RT performed on unilateral hindlimb muscle, as performed in the current study, may not be sufficient to improve basal mTORC1 activity in T2DM skeletal muscle. Additionally, although activity of mTORC1‐targeting substrates is reduced in T2DM under insulin exposure, the response of muscle hypertrophy to RT did not differ between T2DM and healthy rats. Previously, it was observed that although fed‐state mTORC1 activity is reduced due to T2DM, the response of mTORC1 activation by high‐force muscle contraction does not necessarily diminish (Katta et al., 2009a, 2009b). Furthermore, a previous study showed that streptozotocin‐induced pharmacological lack of insulin secretion caused muscle atrophy, but did not impair muscle hypertrophy to overload in murine skeletal muscle (Fortes et al., 2015). Thus, insulin‐mediated mTORC1 activity may modulate muscle mass in the resting state, but RT‐mediated muscle adaptation is independent of the mTORC1 activity of insulin.
As well as muscle protein synthesis, the muscle protein degradation machinery is believed to be one more factor that determines skeletal muscle mass. In this study, changes in LC3 and p62 were measured to evaluate the progression of autophagy (Sakuma et al., 2016); T2DM rats did not show any change in their levels as compared with those in healthy control rats in the resting state and after RT. These observations were consistent with previous studies (Cho, Choi, & Cho, 2017; Turpin et al., 2009). p62 expression is known to increase in skeletal muscle at an early period of RT (Ulbricht et al., 2015). This accumulation is thought to occur as the remodelling of myofibril structure to exercise‐induced damage (Ulbricht et al., 2015). The RT‐induced muscle damage response is known to reduce in relation to the training period (Damas et al., 2016). We assumed that for this reason we did not observe the change in autophagy flux markers. In contrast to the autophagy markers, ubiquitinated protein expression was significantly reduced in the resting leg muscle of T2DM as compared with the same condition in the healthy control. Ubiquitinated protein expression is inversely proportional to proteasome activity (Tonoki et al., 2009). In addition, a previous study has shown that T2DM model mice show muscle atrophy concomitant with an increment in proteasomal activity (Wang et al., 2006). Thus, although we have not measured the alteration in the expression of ubiquitin ligase, it is assumed that proteasome activity may have been increased, and was related to the loss of muscle mass in T2DM. Furthermore, although a recent study has demonstrated that the ubiquitin–proteasome system is activated during overload‐induced muscle hypertrophy (Baehr, Tunzi, & Bodine, 2014) in mice, it remains unclear whether RT affects the ubiquitin–proteasome system. In this study, ubiquitinated protein expression was unaltered after chronic RT in both groups. Beahr et al. showed that overload‐induced proteasome activation transiently increases at the early phase, and then decreases. Therefore, in this study, proteasome activity was considered to return to the resting level. Taken together, our results implicated that activation of the machinery for muscle protein degradation might be partly related to the reduction in the muscle mass, but did not influence RT‐mediated muscle mass adaptation in T2DM.
Skeletal muscles have multiple nuclei in their cells; the number of nuclei is known to correlate with the myofibre size (Allen, Monke, Talmadge, Roy, & Edgerton, 1995; Zhong et al., 2005). In our study, we confirmed that myonuclear number was significantly correlated with fibre CSA in both T2DM and healthy rats. Additionally, T2DM rats showed significantly lower myonuclear number than control rats. This was consistent with a previous study that showed lower myonuclear content and lower muscle size in T2DM muscle (Abrigo et al., 2016; Peterson et al., 2008), and might be part of a mechanism inducing muscle atrophy in T2DM. Satellite cells are known to supply myonuclei constantly in the steady state (Pawlikowski, Pulliam, Betta, Kardon, & Olwin, 2015). In addition, numerous studies observed that T2DM impairs satellite cell function and number (D'Souza et al., 2015; D'Souza, Al‐Sajee, & Hawke, 2013). We observed that Pax7 expression was only significantly reduced in T2DM rats in both control and RT legs in this study. Although we could not confirm whether satellite cell dysfunction or reduction occurred, our result might implicate satellite cell abnormality in T2DM skeletal muscle. Furthermore, we observed that myonuclear domain size was slightly but significantly larger in T2DM than in the healthy skeletal muscle fibre in the resting state. This phenomenon indicates that loss of myonuclei might occur relatively earlier than muscle fibre atrophy. Interestingly, a previous study observed that loss of myonuclei precedes muscle atrophy by senescence in murine skeletal muscle (Brack, Bildsoe, & Hughes, 2005). Thus, it is implicated that loss of myonuclei might be associated with any muscle atrophic condition, such as senescence or T2DM.
Muscle hypertrophic stimuli such as overload and RT are known to increase the myonuclear number through satellite cell activation and differentiation (McCarthy et al., 2011; Snijders et al., 2016). In this study, myonuclear number was significantly increased in the RT leg as compared with the control leg in both groups to the same extent. Although previous studies observed that T2DM impairs satellite cell functions such as proliferation and differentiation (D'Souza et al., 2013; D'Souza et al., 2015), the current results implicated that T2DM does not necessarily affect the ability of myonuclear accretion during RT‐induced muscle hypertrophy. Further, our results support previous observations that the RT‐mediated muscle hypertrophic response is highly correlated with increased myonuclear number (Olsen et al., 2006; Snijders et al., 2016). On the other hand, myonuclear domain size was unaffected by RT in both groups, consistent with a previous study (Snijders et al., 2016). In addition, T2DM muscle could not recover myonuclear domain size by RT, while the response of muscle hypertrophy was unaffected. This observation implicated that myonuclear domain size might not relate to the RT‐induced muscle mass gain. However, physiological significance of myonuclear accretion during muscle hypertrophy remains to be determined. Further study is needed to clarify the physiological role underlying the relationship between the response of muscle hypertrophy and myonuclear accretion.
Obesity and T2DM are known to associate with endoplasmic reticulum (ER) stress and/or cellular metabolic dysfunction (Deldicque et al., 2010; Kelley, He, Menshikova, & Ritov, 2002; Ozcan et al., 2004). These stresses lead to a decrement of fibre size and cell apoptosis, which might be one of the factors causing loss of myonuclei in T2DM. In this study, we evaluated the expression of BiP/GRP78 and p53 as markers of ER stress and metabolic dysfunction, since expression of these molecules was observed to increase in obese or T2DM skeletal muscles (Deldicque et al., 2010; Morimoto, Bando, Shigeta, Monji, & Murohara, 2011). Ozcan et al. reported that high fat diet‐fed mice and spontaneous obesity model mice show increased BiP expression in the liver but not in skeletal muscles (Ozcan et al., 2004). In contrast, Deldiqcue and co‐workers observed that the ER stress response increased in high fat‐fed mouse skeletal muscle (Deldicque et al., 2010). These discrepancies between studies may be caused by differences in experimental procedure such as the animal model, period and content of high fat feeding. However, in the current study, BiP expression was significantly decreased in T2DM in the resting state. No previous study has observed BiP reduction in obese or T2DM skeletal muscles. On the contrary, a previous study reported that BiP expression was lowered in old rat skeletal muscle (O'Leary, Vainshtein, Iqbal, Ostojic, & Hood, 2013). Ageing‐associated reduction of ER stress response capacity may be related to the muscle loss (Deldicque, 2013). Although further study should be performed to investigate the physiological influence of change in BiP expression under T2DM conditions, the present results implicated that capacity of the ER stress response in skeletal muscle may be altered under chronic T2DM conditions. Additionally, we did not observe a change in BiP expression after RT in either group; however, Hamilton and colleagues have previously demonstrated that ER stress increases during overload‐induced muscle hypertrophy in rats (Hamilton et al., 2014). Although we could not identify the certain cause of discrepancy with previous observations, experimental modality might influence the result. In fact, a previous study has shown that exercise intensity affects activation of ER stress signalling (Estebanez, de Paz, Cuevas, & Gonzalez‐Gallego, 2018). Therefore, the role of the ER stress response during exercise‐induced skeletal muscle adaptation should be determined in further studies.
Similar to BiP expression, T2DM rats showed significantly lower muscle p53 expression than healthy rats in the basal state. Although previous studies have shown that p53 expression increased or remained unaltered in obese or T2DM murine skeletal muscles (Bogazzi et al., 2013; Morimoto et al., 2011), no study has observed a reduction of p53 in T2DM skeletal muscle in the resting state. A recent study reported that a specific lack of p53 causes mitochondrial abnormalities in skeletal muscles (Beyfuss, Erlich, Triolo, & Hood, 2018). In this study, T2DM did not affect VDAC1 protein content, which was measured as a rough estimate of mitochondrial content (Jackson et al., 2015). Thus, we assumed that change in p53 protein expression in T2DM was at least not relevant to the skeletal muscle mitochondrial content. Notably, a band corresponding to p53 showed a marked electrophoretic upshift in T2DM skeletal muscle. Such a shift in the band might implicate protein hyperphosphorylation. In fact, p53 has multiple phosphorylation sites and is involved in regulating various cellular signalling pathways other than mitochondrial homeostasis (Beyfuss & Hood, 2018). Thus, further study is warranted to clarify the effect of the change in p53 expression in skeletal muscle metabolism under conditions of T2DM. In addition, we observed that chronic RT significantly increased p53 to the same extent in both conditions. A previous human study also observed that exercise training increases p53 in an exercise intensity‐related manner (Granata, Oliveira, Little, Renner, & Bishop, 2016). Thus, it is assumed that chronic RT is an effective way to rescue p53 expression under the T2DM condition.
Apoptotic signalling is a conceivable pathway in obesity‐ or T2DM‐induced muscle atrophy (Brons & Vaag, 2009; Turpin et al., 2009). To clarify whether apoptotic signalling is altered in T2DM and chronic RT, we measured expression of caspase‐3, which has an important role in apoptosis progression (Janicke, Sprengart, Wati, & Porter, 1998). In the current study, T2DM rat muscle showed significantly lower levels of cleaved caspase‐3 expression (the active form) in both control and trained legs. Previous animal studies reported that caspase expression and activity decreased or remained unaltered in T2DM muscle, with no increase in DNA fragmentation (Campbell et al., 2015; Turpin et al., 2009). Therefore, our current observations indicate that apoptosis may not necessarily increase in T2DM rat muscle in the resting state. Further, successive RT increased the levels of full‐length (the inactive form) caspase‐3, without alteration in the levels of cleaved caspase‐3, consequently decreasing the ratio of active to inactive caspase‐3 in both groups. Muscle overload is known to increase full‐length caspase‐3, without changes in any other apoptosis‐related protein expression (Moriya & Miyazaki, 2018). Thus, our observation supported previous work. SNARK, which is an anti‐apoptotic factor, has been shown to transcriptionally increase in obese or T2DM skeletal muscle (Lessard et al., 2016). However, we could not observe any significant alteration in SNARK expression at the protein level. Thus, it remains to be determined whether expression of SNARK protein alters under conditions of T2DM; however, at least phenomenologically, our result suggest that change in SNARK expression is not relevant to the T2DM‐induced muscle atrophy and RT‐induced skeletal muscle adaptation. Taken together, we propose that apoptosis is not enhanced in T2DM muscle in the resting state; however, RT may tend to alter anti‐apoptotic signalling in the muscle. Additionally, reduced p53 expression might not necessarily be linked to the activity of apoptotic signalling in T2DM muscle in the resting state.
In summary, T2DM rat muscle shows impaired mTORC1 substrate activation, myonuclear number and satellite cell‐associated protein expression, and a decrease in skeletal muscle mass in the resting state. However, the response of muscle hypertrophy to chronic RT was not diminished in T2DM. This implicates that the metabolic status and muscle contraction regulate skeletal muscle mass through different mechanisms. Moreover, our current study emphasizes that RT is a strong driver to increase skeletal muscle mass in T2DM muscle, making it an important intervention for improving T2DM‐induced muscle atrophy. Further understanding of the mechanism of muscle mass regulation at various physiological statuses may help in the development of an efficient exercise regime and nutritional intervention for improving health.
COMPETING INTERESTS
All authors declare no conflict of interest.
AUTHOR CONTRIBUTIONS
Conception and design of the experiments: S.A., K.K., K.S. and S.F. Collection, analysis, and interpretation of data: S.A. and K.K. All authors drafted the article or revised it critically for important intellectual content. All authors have read and approved the final version of this manuscript and agree to be accountable for all aspects of the work in ensuring that questions related to the accuracy or integrity of any part of the work are appropriately investigated and resolved. All persons designated as authors qualify for authorship, and all those who qualify for authorship are listed.
Ato S, Kido K, Sato K, Fujita S. Type 2 diabetes causes skeletal muscle atrophy but does not impair resistance training‐mediated myonuclear accretion and muscle mass gain in rats. Experimental Physiology. 2019;104:1518–1531. 10.1113/EP087585
Funding information
This work was supported by the Japan Society for the Promotion of Science, Grants‐in‐Aid for Scientific Research (no. 17H02183 to S.F.); the Japanese Council for Science, Technology and Innovation (SIP, Project ID 14533567); and a grant (‘Technologies for creating next‐generation agriculture, forestry and fisheries’) from the Bio‐oriented Technology Research Advancement Institution (NARO).
Edited by: Julien Ochala
REFERENCES
- Abrigo, J. , Rivera, J. C. , Aravena, J. , Cabrera, D. , Simon, F. , Ezquer, F. , … Cabello‐Verrugio, C. (2016). High fat diet‐induced skeletal muscle wasting is decreased by mesenchymal stem cells administration: implications on oxidative stress, ubiquitin proteasome pathway activation, and myonuclear apoptosis. Oxidative Medicine and Cellular Longevity, 2016, 9047821 10.1155/2016/9047821 [DOI] [PMC free article] [PubMed] [Google Scholar]
- Allen, D. L. , Monke, S. R. , Talmadge, R. J. , Roy, R. R. , & Edgerton, V. R. (1995). Plasticity of myonuclear number in hypertrophied and atrophied mammalian skeletal muscle fibers. Journal of Applied Physiology, 78(5), 1969–1976. 10.1152/jappl.1995.78.5.1969 [DOI] [PubMed] [Google Scholar]
- Ato, S. , Makanae, Y. , Kido, K. , & Fujita, S. (2016). Contraction mode itself does not determine the level of mTORC1 activity in rat skeletal muscle. Physiological Reports, 4(19), e12976 10.14814/phy2.12976 [DOI] [PMC free article] [PubMed] [Google Scholar]
- Baar, K. , & Esser, K. (1999). Phosphorylation of p70S6k correlates with increased skeletal muscle mass following resistance exercise. American Journal of Physiology, 276(1), C120–C127. 10.1152/ajpcell.1999.276.1.C120 [DOI] [PubMed] [Google Scholar]
- Baehr, L. M. , Tunzi, M. , & Bodine, S. C. (2014). Muscle hypertrophy is associated with increases in proteasome activity that is independent of MuRF1 and MAFbx expression. Frontiers in Physiology, 5, 69 10.3389/fphys.2014.00069 [DOI] [PMC free article] [PubMed] [Google Scholar]
- Baehr, L. M. , West, D. W. , Marshall, A. G. , Marcotte, G. R. , Baar, K. , & Bodine, S. C. (2017). Muscle‐specific and age‐related changes in protein synthesis and protein degradation in response to hindlimb unloading in rats. Journal of Applied Physiology, 122(5), 1336–1350. 10.1152/japplphysiol.00703.2016 [DOI] [PMC free article] [PubMed] [Google Scholar]
- Baron, A. D. , Brechtel, G. , Wallace, P. , & Edelman, S. V. (1988). Rates and tissue sites of non‐insulin‐ and insulin‐mediated glucose uptake in humans. American Journal of Physiology, 255(6), E769–E774. 10.1152/ajpendo.1988.255.6.E769 [DOI] [PubMed] [Google Scholar]
- Bassil, M. S. , & Gougeon, R. (2013). Muscle protein anabolism in type 2 diabetes. Current Opinion in Clinical Nutrition and Metabolic Care, 16(1), 83–88. 10.1097/MCO.0b013e32835a88ee [DOI] [PubMed] [Google Scholar]
- Bellamy, L. M. , Joanisse, S. , Grubb, A. , Mitchell, C. J. , McKay, B. R. , Phillips, S. M. , … Parise, G. (2014). The acute satellite cell response and skeletal muscle hypertrophy following resistance training. Plos One, 9(10), e109739 10.1371/journal.pone.0109739 [DOI] [PMC free article] [PubMed] [Google Scholar]
- Beyfuss, K. , Erlich, A. T. , Triolo, M. , & Hood, D. A. (2018). The role of p53 in determining mitochondrial adaptations to endurance training in skeletal muscle. Scientific Reports, 8(1), 14710 10.1038/s41598-018-32887-0 [DOI] [PMC free article] [PubMed] [Google Scholar]
- Beyfuss, K. , & Hood, D. A. (2018). A systematic review of p53 regulation of oxidative stress in skeletal muscle. Redox Report: Communications in Free Radical Research, 23(1), 100–117. 10.1080/13510002.2017.1416773 [DOI] [PMC free article] [PubMed] [Google Scholar]
- Bogazzi, F. , Raggi, F. , Russo, D. , Bohlooly, Y. M. , Sardella, C. , Urbani, C. , … Martino, E. (2013). Growth hormone is necessary for the p53‐mediated, obesity‐induced insulin resistance in male C57BL/6J × CBA mice. Endocrinology, 154(11), 4226–4236. 10.1210/en.2013-1220 [DOI] [PubMed] [Google Scholar]
- Brack, A. S. , Bildsoe, H. , & Hughes, S. M. (2005). Evidence that satellite cell decrement contributes to preferential decline in nuclear number from large fibres during murine age‐related muscle atrophy. Journal of Cell Science, 118(20), 4813–4821. 10.1242/jcs.02602 [DOI] [PubMed] [Google Scholar]
- Brons, C. , & Vaag, A. (2009). Skeletal muscle lipotoxicity in insulin resistance and type 2 diabetes. Journal of Physiology, 587(16), 3977–3978. 10.1113/jphysiol.2009.177758 [DOI] [PMC free article] [PubMed] [Google Scholar]
- Campbell, T. L. , Mitchell, A. S. , McMillan, E. M. , Bloemberg, D. , Pavlov, D. , Messa, I. , … Quadrilatero, J. (2015). High‐fat feeding does not induce an autophagic or apoptotic phenotype in female rat skeletal muscle. Experimental Biology and Medicine, 240(5), 657–668. 10.1177/1535370214557223 [DOI] [PMC free article] [PubMed] [Google Scholar]
- Chang, P. Y. , Le Marchand‐Brustel, Y. , Cheatham, L. A. , & Moller, D. E. (1995). Insulin stimulation of mitogen‐activated protein kinase, p90rsk, and p70 S6 kinase in skeletal muscle of normal and insulin‐resistant mice. Implications for the regulation of glycogen synthase. Journal of Biological Chemistry, 270(50), 29928–29935. 10.1074/jbc.270.50.29928 [DOI] [PubMed] [Google Scholar]
- Cho, D. K. , Choi, D. H. , & Cho, J. Y. (2017). Effect of treadmill exercise on skeletal muscle autophagy in rats with obesity induced by a high‐fat diet. Journal of Exercise Nutrition & Biochemistry, 21(3), 26–34. 10.20463/jenb.2017.0013 [DOI] [PMC free article] [PubMed] [Google Scholar]
- Damas, F. , Phillips, S. M. , Libardi, C. A. , Vechin, F. C. , Lixandrao, M. E. , Jannig, P. R. , … Ugrinowitsch, C. (2016). Resistance training‐induced changes in integrated myofibrillar protein synthesis are related to hypertrophy only after attenuation of muscle damage. Journal of Physiology, 594(18), 5209–5222. 10.1113/JP272472 [DOI] [PMC free article] [PubMed] [Google Scholar]
- Damas, F. , Phillips, S. , Vechin, F. C. , & Ugrinowitsch, C. (2015). A review of resistance training‐induced changes in skeletal muscle protein synthesis and their contribution to hypertrophy. Sports Medicine, 45(6), 801–807. 10.1007/s40279-015-0320-0 [DOI] [PubMed] [Google Scholar]
- DeFronzo, R. A. , & Tripathy, D. (2009). Skeletal muscle insulin resistance is the primary defect in type 2 diabetes. Diabetes Care, 32(Suppl 2), S157–S163. 10.2337/dc09-S302 [DOI] [PMC free article] [PubMed] [Google Scholar]
- Deldicque, L. (2013). Endoplasmic reticulum stress in human skeletal muscle: Any contribution to sarcopenia? Frontiers in Physiology, 4, 236 10.3389/fphys.2013.00236 [DOI] [PMC free article] [PubMed] [Google Scholar]
- Deldicque, L. , Cani, P. D. , Philp, A. , Raymackers, J. M. , Meakin, P. J. , Ashford, M. L. , … Baar, K. (2010). The unfolded protein response is activated in skeletal muscle by high‐fat feeding: Potential role in the downregulation of protein synthesis. American Journal of Physiology. Endocrinology and Metabolism, 299(5), E695–E705. 10.1152/ajpendo.00038.2010 [DOI] [PubMed] [Google Scholar]
- Drummond, M. J. , Fry, C. S. , Glynn, E. L. , Dreyer, H. C. , Dhanani, S. , Timmerman, K. L. , … Rasmussen, B. B. (2009). Rapamycin administration in humans blocks the contraction‐induced increase in skeletal muscle protein synthesis. Journal of Physiology, 587(7), 1535–1546. 10.1113/jphysiol.2008.163816 [DOI] [PMC free article] [PubMed] [Google Scholar]
- D'Souza, D. M. , Al‐Sajee, D. , & Hawke, T. J. (2013). Diabetic myopathy: Impact of diabetes mellitus on skeletal muscle progenitor cells. Frontiers in Physiology, 4, 379 10.3389/fphys.2013.00379 [DOI] [PMC free article] [PubMed] [Google Scholar]
- D'Souza, D. M. , Trajcevski, K. E. , Al‐Sajee, D. , Wang, D. C. , Thomas, M. , Anderson, J. E. , & Hawke, T. J. (2015). Diet‐induced obesity impairs muscle satellite cell activation and muscle repair through alterations in hepatocyte growth factor signaling. Physiological Reports, 3(8), e12506 10.14814/phy2.12506 [DOI] [PMC free article] [PubMed] [Google Scholar]
- Egner, I. M. , Bruusgaard, J. C. , & Gundersen, K. (2016). Satellite cell depletion prevents fiber hypertrophy in skeletal muscle. Development, 143(16), 2898–2906. 10.1242/dev.134411 [DOI] [PubMed] [Google Scholar]
- Estebanez, B. , de Paz, J. A. , Cuevas, M. J. , & Gonzalez‐Gallego, J. (2018). Endoplasmic reticulum unfolded protein response, aging and exercise: an update. Frontiers in Physiology, 9, 1744 10.3389/fphys.2018.01744 [DOI] [PMC free article] [PubMed] [Google Scholar]
- Fortes, M. A. , Pinheiro, C. H. , Guimaraes‐Ferreira, L. , Vitzel, K. F. , Vasconcelos, D. A. , & Curi, R. (2015). Overload‐induced skeletal muscle hypertrophy is not impaired in STZ‐diabetic rats. Physiological Reports, 3(7), e12457 10.14814/phy2.12457 [DOI] [PMC free article] [PubMed] [Google Scholar]
- Fry, C. S. , Lee, J. D. , Jackson, J. R. , Kirby, T. J. , Stasko, S. A. , Liu, H. , … Peterson, C. A. (2014). Regulation of the muscle fiber microenvironment by activated satellite cells during hypertrophy. FASEB Journal, 28(4), 1654–1665. 10.1096/fj.13-239426 [DOI] [PMC free article] [PubMed] [Google Scholar]
- Goodman, C. A. , Frey, J. W. , Mabrey, D. M. , Jacobs, B. L. , Lincoln, H. C. , You, J. S. , & Hornberger, T. A. (2011). The role of skeletal muscle mTOR in the regulation of mechanical load‐induced growth. Journal of Physiology, 589(22), 5485–5501. 10.1113/jphysiol.2011.218255 [DOI] [PMC free article] [PubMed] [Google Scholar]
- Gordon, B. S. , Steiner, J. L. , Lang, C. H. , Jefferson, L. S. , & Kimball, S. R. (2014). Reduced REDD1 expression contributes to activation of mTORC1 following electrically induced muscle contraction. American Journal of Physiology. Endocrinology and Metabolism, 307(8), E703–E711. 10.1152/ajpendo.00250.2014 [DOI] [PMC free article] [PubMed] [Google Scholar]
- Granata, C. , Oliveira, R. S. , Little, J. P. , Renner, K. , & Bishop, D. J. (2016). Training intensity modulates changes in PGC‐1α and p53 protein content and mitochondrial respiration, but not markers of mitochondrial content in human skeletal muscle. FASEB Journal, 30(2), 959–970. 10.1096/fj.15-276907 [DOI] [PubMed] [Google Scholar]
- Grundy, D. (2015). Principles and standards for reporting animal experiments in The Journal of Physiology and Experimental Physiology . Experimental Physiology, 100(7), 755–758. 10.1113/EP085299 [DOI] [PubMed] [Google Scholar]
- Hamilton, D. L. , Philp, A. , MacKenzie, M. G. , Patton, A. , Towler, M. C. , Gallagher, I. J. , … Baar, K. (2014). Molecular brakes regulating mTORC1 activation in skeletal muscle following synergist ablation. American Journal of Physiology. Endocrinology and Metabolism, 307(4), E365–E373. 10.1152/ajpendo.00674.2013 [DOI] [PMC free article] [PubMed] [Google Scholar]
- Hua, N. , Takahashi, H. , Yee, G. M. , Kitajima, Y. , Katagiri, S. , Kojima, M. , … Hamilton, J. A. (2017). Influence of muscle fiber type composition on early fat accumulation under high‐fat diet challenge. Plos One, 12(8), e0182430 10.1371/journal.pone.0182430 [DOI] [PMC free article] [PubMed] [Google Scholar]
- Hulston, C. J. , Woods, R. M. , Dewhurst‐Trigg, R. , Parry, S. A. , Gagnon, S. , Baker, L. , … van Hall, G. (2018). Resistance exercise stimulates mixed muscle protein synthesis in lean and obese young adults. Physiological Reports, 6(14), e13799 10.14814/phy2.13799 [DOI] [PMC free article] [PubMed] [Google Scholar]
- Jackson, J. R. , Kirby, T. J. , Fry, C. S. , Cooper, R. L. , McCarthy, J. J. , Peterson, C. A. , & Dupont‐Versteegden, E. E. (2015). Reduced voluntary running performance is associated with impaired coordination as a result of muscle satellite cell depletion in adult mice. Skelet Muscle, 5, 41 10.1186/s13395-015-0065-3 [DOI] [PMC free article] [PubMed] [Google Scholar]
- Janicke, R. U. , Sprengart, M. L. , Wati, M. R. , & Porter, A. G. (1998). Caspase‐3 is required for DNA fragmentation and morphological changes associated with apoptosis. Journal of Biological Chemistry, 273(16), 9357–9360. [DOI] [PubMed] [Google Scholar]
- Katta, A. , Kakarla, S. , Wu, M. , Paturi, S. , Gadde, M. K. , Arvapalli, R. , … Blough, E. R. (2009a). Altered regulation of contraction‐induced Akt/mTOR/p70S6k pathway signaling in skeletal muscle of the obese Zucker rat. Experimental Diabetes Research, 2009, 384683 10.1155/2009/384683 [DOI] [PMC free article] [PubMed] [Google Scholar]
- Katta, A. , Karkala, S. K. , Wu, M. , Meduru, S. , Desai, D. H. , Rice, K. M. , & Blough, E. R. (2009b). Lean and obese Zucker rats exhibit different patterns of p70s6 kinase regulation in the tibialis anterior muscle in response to high‐force muscle contraction. Muscle & Nerve, 39(4), 503–511. 10.1002/mus.21255 [DOI] [PMC free article] [PubMed] [Google Scholar]
- Katta, A. , Kundla, S. , Kakarla, S. K. , Wu, M. , Fannin, J. , Paturi, S. , … Blough, E. R. (2010). Impaired overload‐induced hypertrophy is associated with diminished mTOR signaling in insulin‐resistant skeletal muscle of the obese Zucker rat. American Journal of Physiology. Regulatory, Integrative and Comparative Physiology, 299(6), R1666–R1675. 10.1152/ajpregu.00229.2010 [DOI] [PMC free article] [PubMed] [Google Scholar]
- Kawano, K. , Hirashima, T. , Mori, S. , & Natori, T. (1994). OLETF (Otsuka Long‐Evans Tokushima Fatty) rat: A new NIDDM rat strain. Diabetes Research and Clinical Practice, 24(Suppl), S317–S320. [DOI] [PubMed] [Google Scholar]
- Kelley, D. E. , He, J. , Menshikova, E. V. , & Ritov, V. B. (2002). Dysfunction of mitochondria in human skeletal muscle in type 2 diabetes. Diabetes, 51(10), 2944–2950. [DOI] [PubMed] [Google Scholar]
- Khamzina, L. , Veilleux, A. , Bergeron, S. , & Marette, A. (2005). Increased activation of the mammalian target of rapamycin pathway in liver and skeletal muscle of obese rats: Possible involvement in obesity‐linked insulin resistance. Endocrinology, 146(3), 1473–1481. 10.1210/en.2004-0921 [DOI] [PubMed] [Google Scholar]
- Kido, K. , Ato, S. , Yokokawa, T. , Sato, K. , & Fujita, S. (2018). Resistance training recovers attenuated APPL1 expression and improves insulin‐induced Akt signal activation in skeletal muscle of type 2 diabetic rats. American Journal of Physiology. Endocrinology and Metabolism, 314(6), E564–E571. 10.1152/ajpendo.00362.2017 [DOI] [PubMed] [Google Scholar]
- Lessard, S. J. , Rivas, D. A. , So, K. , Koh, H. J. , Queiroz, A. L. , Hirshman, M. F. , … Goodyear, L. J. (2016). The AMPK‐related kinase SNARK regulates muscle mass and myocyte survival. Journal of Clinical Investigation, 126(2), 560–570. 10.1172/JCI79197 [DOI] [PMC free article] [PubMed] [Google Scholar]
- McCarthy, J. J. , Mula, J. , Miyazaki, M. , Erfani, R. , Garrison, K. , Farooqui, A. B. , … Keller, C. (2011). Effective fiber hypertrophy in satellite cell‐depleted skeletal muscle. Development, 138(17), 3657–3666. 10.1242/dev.068858 [DOI] [PMC free article] [PubMed] [Google Scholar]
- Morimoto, Y. , Bando, Y. K. , Shigeta, T. , Monji, A. , & Murohara, T. (2011). Atorvastatin prevents ischemic limb loss in type 2 diabetes: Role of p53. Journal of Atherosclerosis and Thrombosis, 18(3), 200–208. [DOI] [PubMed] [Google Scholar]
- Moriya, N. , & Miyazaki, M. (2018). Akt1 deficiency diminishes skeletal muscle hypertrophy by reducing satellite cell proliferation. American Journal of Physiology. Regulatory, Integrative and Comparative Physiology, 314(5), R741–R751. 10.1152/ajpregu.00336.2017 [DOI] [PubMed] [Google Scholar]
- Ogasawara, R. , Fujita, S. , Hornberger, T. A. , Kitaoka, Y. , Makanae, Y. , Nakazato, K. , & Naokata, I. (2016). The role of mTOR signalling in the regulation of skeletal muscle mass in a rodent model of resistance exercise. Scientific Reports, 6, 31142 10.1038/srep31142 [DOI] [PMC free article] [PubMed] [Google Scholar]
- O'Leary, M. F. , Vainshtein, A. , Iqbal, S. , Ostojic, O. , & Hood, D. A. (2013). Adaptive plasticity of autophagic proteins to denervation in aging skeletal muscle. American Journal of Physiology. Cell Physiology, 304(5), C422–C430. 10.1152/ajpcell.00240.2012 [DOI] [PubMed] [Google Scholar]
- Olsen, S. , Aagaard, P. , Kadi, F. , Tufekovic, G. , Verney, J. , Olesen, J. L. , … Kjaer, M. (2006). Creatine supplementation augments the increase in satellite cell and myonuclei number in human skeletal muscle induced by strength training. Journal of Physiology, 573(2), 525–534. 10.1113/jphysiol.2006.107359 [DOI] [PMC free article] [PubMed] [Google Scholar]
- Ozcan, U. , Cao, Q. , Yilmaz, E. , Lee, A. H. , Iwakoshi, N. N. , Ozdelen, E. , … Hotamisligil, G. S. (2004). Endoplasmic reticulum stress links obesity, insulin action, and type 2 diabetes. Science, 306(5695), 457–461. 10.1126/science.1103160 [DOI] [PubMed] [Google Scholar]
- Pawlikowski, B. , Pulliam, C. , Betta, N. D. , Kardon, G. , & Olwin, B. B. (2015). Pervasive satellite cell contribution to uninjured adult muscle fibers. Skeletal Muscle, 5, 42 10.1186/s13395-015-0067-1 [DOI] [PMC free article] [PubMed] [Google Scholar]
- Peterson, J. M. , Bryner, R. W. , & Alway, S. E. (2008). Satellite cell proliferation is reduced in muscles of obese Zucker rats but restored with loading. American Journal of Physiology. Cell Physiology, 295(2), C521–C528. 10.1152/ajpcell.00073.2008 [DOI] [PMC free article] [PubMed] [Google Scholar]
- Pincu, Y. , Linden, M. A. , Zou, K. , Baynard, T. , & Boppart, M. D. (2015). The effects of high fat diet and moderate exercise on TGFβ1 and collagen deposition in mouse skeletal muscle. Cytokine, 73(1), 23–29. 10.1016/j.cyto.2015.01.013 [DOI] [PubMed] [Google Scholar]
- Sabatini, D. M. (2017). Twenty‐five years of mTOR: Uncovering the link from nutrients to growth. Proceedings of the National Academy of Sciences, USA, 114(45), 11818–11825. 10.1073/pnas.1716173114 [DOI] [PMC free article] [PubMed] [Google Scholar]
- Sakuma, K. , Kinoshita, M. , Ito, Y. , Aizawa, M. , Aoi, W. , & Yamaguchi, A. (2016). p62/SQSTM1 but not LC3 is accumulated in sarcopenic muscle of mice. Journal of Cachexia, Sarcopenia and Muscle, 7(2), 204–212. 10.1002/jcsm.12045 [DOI] [PMC free article] [PubMed] [Google Scholar]
- Sitnick, M. , Bodine, S. C. , & Rutledge, J. C. (2009). Chronic high fat feeding attenuates load‐induced hypertrophy in mice. Journal of Physiology, 587(23), 5753–5765. 10.1113/jphysiol.2009.180174 [DOI] [PMC free article] [PubMed] [Google Scholar]
- Snijders, T. , Smeets, J. S. , van Kranenburg, J. , Kies, A. K. , van Loon, L. J. , & Verdijk, L. B. (2016). Changes in myonuclear domain size do not precede muscle hypertrophy during prolonged resistance‐type exercise training. Acta Physiologica, 216(2), 231–239. 10.1111/apha.12609 [DOI] [PubMed] [Google Scholar]
- Srikanthan, P. , & Karlamangla, A. S. (2011). Relative muscle mass is inversely associated with insulin resistance and prediabetes. Findings from the third National Health and Nutrition Examination Survey. Journal of Clinical Endocrinology and Metabolism, 96(9), 2898–2903. 10.1210/jc.2011-0435 [DOI] [PubMed] [Google Scholar]
- Takamura, Y. , Nomura, M. , Uchiyama, A. , & Fujita, S. (2017). Effects of aerobic exercise combined with panaxatriol derived from ginseng on insulin resistance and skeletal muscle mass in type 2 diabetic mice. Journal of Nutritional Science and Vitaminology, 63(5), 339–348. 10.3177/jnsv.63.339 [DOI] [PubMed] [Google Scholar]
- Tonoki, A. , Kuranaga, E. , Tomioka, T. , Hamazaki, J. , Murata, S. , Tanaka, K. , & Miura, M. (2009). Genetic evidence linking age‐dependent attenuation of the 26S proteasome with the aging process. Molecular and Cellular Biology, 29(4), 1095–1106. 10.1128/MCB.01227-08 [DOI] [PMC free article] [PubMed] [Google Scholar]
- Turpin, S. M. , Ryall, J. G. , Southgate, R. , Darby, I. , Hevener, A. L. , Febbraio, M. A. , … Watt, M. J. (2009). Examination of ‘lipotoxicity’ in skeletal muscle of high‐fat fed and ob/ob mice. Journal of Physiology, 587(7), 1593–1605. 10.1113/jphysiol.2008.166033 [DOI] [PMC free article] [PubMed] [Google Scholar]
- Ulbricht, A. , Gehlert, S. , Leciejewski, B. , Schiffer, T. , Bloch, W. , & Hohfeld, J. (2015). Induction and adaptation of chaperone‐assisted selective autophagy CASA in response to resistance exercise in human skeletal muscle. Autophagy, 11(3), 538–546. 10.1080/15548627.2015.1017186 [DOI] [PMC free article] [PubMed] [Google Scholar]
- Wada, K. I. , Takahashi, H. , Katsuta, S. , & Soya, H. (2002). No decrease in myonuclear number after long‐term denervation in mature mice. American Journal of Physiology. Cell Physiology, 283(2), C484–C488. 10.1152/ajpcell.00025.2002 [DOI] [PubMed] [Google Scholar]
- Wang, X. , Hu, Z. , Hu, J. , Du, J. , & Mitch, W. E. (2006). Insulin resistance accelerates muscle protein degradation: Activation of the ubiquitin‐proteasome pathway by defects in muscle cell signaling. Endocrinology, 147(9), 4160–4168. 10.1210/en.2006-0251 [DOI] [PubMed] [Google Scholar]
- West, D. W. , Baehr, L. M. , Marcotte, G. R. , Chason, C. M. , Tolento, L. , Gomes, A. V. , … Baar, K. (2016). Acute resistance exercise activates rapamycin‐sensitive and ‐insensitive mechanisms that control translational activity and capacity in skeletal muscle. Journal of Physiology, 594(2), 453–468. 10.1113/JP271365 [DOI] [PMC free article] [PubMed] [Google Scholar]
- Williamson, D. L. , Li, Z. , Tuder, R. M. , Feinstein, E. , Kimball, S. R. , & Dungan, C. M. (2014). Altered nutrient response of mTORC1 as a result of changes in REDD1 expression: Effect of obesity vs. REDD1 deficiency. Journal of Applied Physiology, 117(3), 246–256. 10.1152/japplphysiol.01350.2013. [DOI] [PMC free article] [PubMed] [Google Scholar]
- Zhong, H. , Roy, R. R. , Siengthai, B. , & Edgerton, V. R. (2005). Effects of inactivity on fiber size and myonuclear number in rat soleus muscle. Journal of Applied Physiology, 99(4), 1494–1499. 10.1152/japplphysiol.00394.2005 [DOI] [PubMed] [Google Scholar]