

Abstract
Background
Retinal optical coherence tomography findings in Lewy body diseases and their implications for visual outcomes remain controversial. We investigated whether region‐specific thickness analysis of retinal layers could improve the detection of macular atrophy and unravel its association with visual disability in Parkinson's disease.
Methods
Patients with idiopathic Parkinson's disease (n = 63), dementia with Lewy bodies (n = 8), and E46K mutation carriers in the α‐synuclein gene (E46K‐SNCA) (n = 4) and 34 controls underwent Spectralis optical coherence tomography macular scans and a comprehensive battery of visual function and cognition tests. We computed mean retinal layer thicknesses of both eyes within 1‐, 2‐, 3‐, and 6‐mm diameter macular discs and in concentric parafoveal (1‐ to 2‐mm, 2‐ to 3‐mm, 1‐ to 3‐mm) and perifoveal (3‐ to 6‐mm) rings. Group differences in imaging parameters and their relationship with visual outcomes were analyzed. A multivariate logistic model was developed to predict visual impairment from optical coherence tomography measurements in Parkinson's disease, and cutoff values were determined with receiver operating characteristic analysis.
Results
When compared with controls, patients with dementia with Lewy bodies had significant thinning of the ganglion cell–inner plexiform layer complex within the central 3‐mm disc mainly because of differences in 1‐ to 3‐mm parafoveal thickness. This parameter was strongly correlated in patients, but not in controls, with low contrast visual acuity and visual cognition outcomes (P < .05, False Discovery Rate), achieving 88% of accuracy in predicting visual impairment in Parkinson's disease.
Conclusion
Our findings support that parafoveal thinning of ganglion cell–inner plexiform complex is a sensitive and clinically relevant imaging biomarker for Lewy body diseases, specifically for Parkinson's disease. © 2019 The Authors. Movement Disorders published by Wiley Periodicals, Inc. on behalf of International Parkinson and Movement Disorder Society.
Keywords: dementia with Lewy bodies, macula, optical coherence tomography, Parkinson's disease, visual dysfunction
Lewy body diseases (LBDs) encompass a spectrum of disorders pathologically characterized by widespread deposition of Lewy bodies in the central nervous system. The most representative LBDs include aggressive forms of idiopathic Parkinson's disease (iPD), dementia with Lewy bodies (DLB) and certain genetic variants of Parkinson's disease (PD), such as the E46K mutation in the α‐synuclein gene (E46K‐SNCA),1 recognized as the most pathogenic mutation‐inducing PD.2 Besides the typical parkinsonian motor features, LBDs share several nonmotor manifestations involving impairment in cognition, mood, sleep, autonomic function, pain perception, and vision.3 Interestingly, vision‐related manifestations are frequent and determine a patient's ability to perform activities of daily living,4 being recognized as major predictors of cognitive deterioration in iPD.5
A recent landmark histopathological study demonstrated that in iPD there is a preferential degeneration of neurons within inner retinal layers (ganglion cell layer [GCL], inner plexiform layer and inner nuclear layer [INL]) associated with anomalous α‐synuclein deposits.6 Consistent with these findings, several in vivo imaging studies with spectral‐domain optical coherence tomography (OCT) have demonstrated an atrophy of macular GCL and the inner plexiform layer in iPD.7, 8, 9, 10, 11, 12, 13, 14 Nevertheless, macular OCT studies in iPD have yielded conflicting results because of the diversity of OCT machines, image acquisition protocols, and segmentation algorithms used. Interestingly, when applying mathematical models to analyze macular morphology, Bodis‐Wollner and colleagues found that iPD patients had a specific pattern of macular thinning 0.5‐ to 2‐mm eccentric to the foveola.7, 15, 16
Considering that the extent of retinal injury in LBDs might be subtle and selectively located within the central macula, in the present study we evaluated whether the distribution of retinal damage—measured by OCT—was related to visual disability in LBDs, particularly in iPD patients.
Material and Methods
Participants and Study Design
We performed a cross‐sectional study of 75 patients with LBDs, including iPD (n = 63), DLB (n = 8) and symptomatic E46K‐SNCA carriers (n = 4), and 34 controls. Controls were selected to approximately match the E46K‐SNCA carriers in age and sex. Participants were recruited through the Department of Neurology at Cruces University Hospital and the Biscay PD Association (ASPARBI). Patients with iPD fulfilled Parkinson's UK Brain Bank criteria for the diagnosis of PD and patients with DLB had a diagnosis of probable DLB by 2016 revised criteria for the clinical diagnosis of DLB. All patients were studied in an on‐medication condition to complete all study assessments.
The study protocol was approved by the regional Basque Clinical Research Ethics Committee. All participants gave written informed consent prior to their participation in the study, in accordance with the tenets of the Declaration of Helsinki.
Demographical and PD‐Related Features
Age, sex and years of education were recorded for all participants. Two neurologists experienced in the field of movement disorders recorded disease duration, Hoehn & Yahr Scale score, Unified Parkinson's Disease Rating Scale part III (motor examination) scores (UPDRS III), and Levodopa Equivalent Daily Dose (LEDD).
Visual Outcome Assessment
A protocol was designed for the screening of ocular conditions and overall cognitive status in all candidates (see Supplementary Material). Primary vision measurements were obtained binocularly with best‐corrected refraction. We registered high‐ and low‐contrast visual acuities as the total number of letters correctly identified in, respectively, standard Early Treatment Diabetic Retinopathy Study (ETDRS) charts and Sloan 2.5% charts (Precision Vision, La Salle, Illinois, USA) mounted in a retro‐illuminated cabinet at 4 meters. Contrast sensitivity was measured with a Pelli‐Robson chart at 1 meter under photopic conditions (280 lux), and the lowest contrast at which 2 letters in a triplet were correctly identified was recorded. For color vision testing, we used the Hardy Rand and Rittler pseudoisochromatic plates and the Roth 28 (R28) hue test.
In addition, we performed a detailed evaluation of visual cognition with a battery of neuropsychological tests grouped into the following 4 domains: (1) visual attention and processing speed, based on the results from the Salthouse Perceptual Comparison Test (correct answers), Trail Making Test part A (inverse of the time to complete the test), and Symbol Digit Modalities Test (number of correct answers); (2) visual memory, measured by the Brief Visual Memory Test‐Revised (total score + delayed recall); (3) visual perception, based on the number of correct answers in the Picture Completion subtest of the Wechsler Adult Intelligence Scale IV, Benton Judgement of Line Orientation Test (H‐form), and Number Location and Cube Analysis tests of the Visual Object and Space Perception battery; and (4) visual construction, consisting of the Clock Drawing Test (Rouleau scoring method). All neuropsychological outcome variables were converted to z‐scores and averaged to create a composite score for each visual cognition domain. The internal consistency of each composite score was examined by calculating Cronbach's α, and this was found to be above 0.85 in all cases.
OCT Acquisition, Segmentation, and Processing
We obtained macular volumetric images with a Spectralis spectral‐domain OCT system (Heidelberg Engineering, Heidelberg, Germany). All macular scans were centered on the fovea and consisted of 25 single horizontal axial scans covering a 20° x 20° area, with 512 A‐scans per B‐scan, and 49 frames were averaged per B‐scan (automatic real‐time tracking: 49). All acquisitions were obtained by the same experienced operator, and the built‐in tracking system was used to compensate for eye movements. All OCT images fulfilled quality control criteria from OSCAR‐IB consensus, accounting for Obvious problems (O), poor Signal strength (S), Centration of scan (C), Algorithm failure (A), Retinal pathology other than PD‐related (R), Illumination (I) and Beam placement (B).17 The built‐in software of the Spectralis OCT equipment (HRA Spectralis Viewing Module version 6.0.9.0) automatically segmented macular layers, and the thickness measures were calculated for the combinations of layers and regions illustrated in Figure 1A,B. Following Advised Protocol for OCT Study Terminology and Elements (APOSTEL) recommendations,18 the measurements of both eyes were averaged to account for intereye within‐patient dependencies unless any pathological condition affected one of the eyes, in which case only the healthy eye was included in the analysis.
Figure 1.
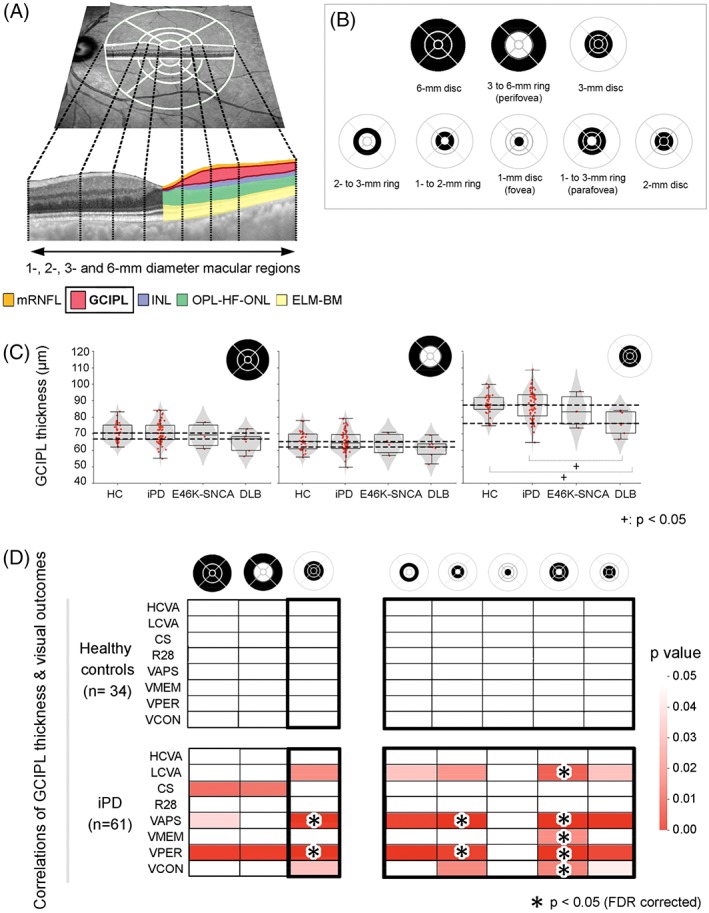
(A) A funduscopic image with superimposed foveola‐centered 1‐, 3‐, 6‐mm diameter and 1‐, 2‐, 3‐mm diameter Early Treatment Diabetic Retinopathy Study (ETDRS) grids provided by the Spectralis optical coherence tomography (OCT) (above). Dotted lines delimitate foveal, parafoveal, and perifoveal boundaries in a transversal macular OCT section (below), in which colors represent the set of macular layers and/or layer complexes analyzed for the present study. (B) Macular regions used for calculating mean layer thicknesses of both eyes. (C) Combined violin‐ and box‐plots with individual data points of each diagnostic group for the distribution of mean GCIPL thicknesses of 6‐mm disc (left), 3‐ to 6‐mm ring (middle), and 3‐mm disc (right). Dashed lines indicate highest and lowest median GCIPL thickness values for all groups within each plot. (D) Age‐adjusted partial correlations between mean GCIPL thicknesses in different macular regions and visual outcomes in control participants (above) and iPD patients (below). Only macular parameters that were statistically significant (P < .05) in partial correlations are shown in color. Asterisks represent correlations that remained statistically significant after False Discovery Rate (FDR) adjustment of P values for multiple comparisons. CS, contrast sensitivity; DLB, dementia with Lewy bodies; E46K‐SNCA, carriers of E46K mutation in α‐synuclein gene; ELM‐BM, the complex including external limiting membrane, ellipsoid band, retinal pigment epithelium and Bruch membrane; GCIPL, ganglion cell–inner plexiform layer complex; HC, healthy controls; HCVA, high‐contrast visual acuity; INL, inner nuclear layer; iPD, idiopathic Parkinson's disease; LCVA, low‐contrast visual acuity; mRNFL, macular retinal nerve fiber layer; OPL‐HF‐ONL, outer plexiform–Henle fiber–outer nuclear layer complex; R28, Roth 28 hue test; VAPS, visual attention and processing speed composite; VCON, visual construction composite; VMEM, visual memory composite; VPER, visual perception composite; FDR, False Discovery Rate. [Color figure can be viewed at http://wileyonlinelibrary.com]
Statistical and Classification Analyses
Statistical analyses were carried out using IBM SPSS Statistics for Windows, version 20.0 (IBM‐SPSS, Armonk, New York). Continuous variables were assessed for normality with the Shapiro–Wilks test. Categorical variables were computed with pairwise Fisher's exact tests, and the differences in continuous variables were analyzed using the Mann–Whitney U test for pairwise comparisons or Kruskal–Wallis analysis of variance with Dunn's post hoc test for multiple‐group comparisons. We calculated partial correlations between OCT measurements and visual outcomes, controlling for age. Correction for multiple comparisons was performed via False Discovery Rate. Next, we classified LBD patients into 2 groups based on visual outcomes using unsupervised K‐means clustering algorithm with a predefined number of 2 clusters (scikit‐learn package [https://scikit-learn.org] running under Python 3.7 [https://www.python.org/]), and we evaluated with univariate logistic regression the significance of the association between OCT parameters and visual impairment status in iPD. The P values of significant predictors were corrected with the Bonferroni method for multiple comparisons. In addition, to account for the effect of age on retinal atrophy,19 we performed a multivariate logistic regression analysis including both age and individual OCT measures. Then, we used the estimated probabilities to create receiver operating characteristic curves, calculated as P = 1/[1 + e^(−y)], where ‘y’ corresponds to the fitted model resulting from the logistic regression. The optimal cutoff values were calculated with Youden's Index (see Supplementary Material).
Results
Overall Demographic, Cognitive, and PD‐Related Features
The general characteristics of the study participants are displayed in Table 1. The patients were predominantly men (65.3%) and relatively young (mean, 62.96 years old). We did not observe significant differences in terms of sex or years of education between the controls and patients, but those with DLB were significantly older than other patient groups and controls. Patients’ mean disease duration was 6.49 years, and they had mild to moderate bilateral motor disability (mean UPDRS III, 27.04; median Hoehn & Yahr score, 2.5), without significant differences between groups. Overall cognitive performance was significantly lower in patients than in controls and in DLB patients when compared with iPD patients.
Table 1.
Demographics, PD characteristics, primary visual function and visual cognition for each diagnostic category
| Variables, units | Control | All patients | P | iPD | E46K‐SNCA | DLB | P |
|---|---|---|---|---|---|---|---|
| Demographics and PD characteristics | |||||||
| n | 34 | 75 | 63 | 4 | 8 | ||
| Age, years | 59.79 (6.22) | 62.96 (9.11) | .036 | 61.91 (8.56) | 57.58 (5.27) | 73.92 (7.29) | .001a |
| Males, n (%) | 16 (47.1) | 49 (65.3) | .266 | 41 (65.1) | 2 (50.0) | 6 (75.0) | .208b.c |
| Education, years | 12.50 (3.98) | 11.04 (4.28) | .121 | 10.97 (4.28) | 14.75 (2.63) | 9.75 (4.23) | .089 |
| Disease duration, years | NA | 6.49 (4.10) | NA | 6.15 (3.77) | 8.81 (5.15) | 7.98 (5.76) | .454 |
| Hoehn & Yahr score | NA | 2.5 (1.0‐4.0) | NA | 2.0 (1.0‐4.0) | 2.5 (0.0‐3.0) | 2.5 (2.0‐3.0) | .108 |
| UPDRS III total score | NA | 27.04 (11.92) | NA | 25.76 (10.67) | 28.25 (20.37) | 37.14 (13.74) | .052 |
| LEDD, mg/day | NA | 657.56 (396.70) | NA | 666.70 (384.30) | 800.38 (701.56) | 514.13 (329.71) | .663 |
| MoCA total score | 26.56 (2.43) | 23.05 (4.60) | <.001 | 24.02 (3.24) | 19.00 (6.98) | 17.63 (7.52) | <.001d.e |
| Primary visual function | |||||||
| High‐contrast VA, # correct letters | 62.53 (4.23) | 57.93 (7.10) | <.001 | 59.50 (5.01) | 52.75 (3.59) | 48.38 (12.13) | <.001d.f |
| Low‐contrast VA, # correct letters | 38.29 (6.32) | 25.61 (12.44) | <.001 | 27.92 (11.28) | 11.50 (13.89) | 15.38 (11.65) | <.001d.f |
| Contrast sensitivity, log units | 2.04 (0.15) | 1.90 (0.15) | <.001 | 1.91 (0.15) | 1.84 (0.07) | 1.84 (0.19) | <.001d |
| HRR color vision, # correct symbols | 36.00 (0.00) | 35.14 (2.06) | .003 | 35.62 (1.23) | 34.00 (1.41) | 32.25 (4.06) | <.001e.g |
| R28 hue color vision test, TES | 47.54 (53.93) | 101.52 (130.49) | .464 | 84.54 (129.62) | 117.00 (104.79) | 244.00 (46.58) | .005b.e |
| Visual cognition composite scores | |||||||
| Visual attention and processing speed | 0.53 (0.61) | −0.28 (0.91) | <.001 | −0.10 (0.83) | −1.26 (0.83) | −1.38 (0.50) | <.001d.f |
| Visual memory | 0.47 (0.39) | −0.24 (0.84) | <.001 | −0.15 (0.81) | −1.12 (1.00) | −0.67 (0.58) | <.001h |
| Visual perception | 0.64 (0.52) | −0.32 (1.00) | <.001 | −0.23 (0.97) | −0.58 (1.34) | −1.04 (0.95) | <.001d |
| Visual construction | 0.49 (0.55) | −0.25 (1.09) | <.001 | −0.09 (0.94) | −2.15 (1.39) | −0.58 (1.20) | <.001d.i |
The results are displayed as mean (standard deviation) except for sex and Hoehn & Yahr score, which are shown, respectively, as number of males (% of males) and as median (range). The results for visual cognition composite scores are quantified as z‐scores. Statistically significant results (P < .05) in post hoc group‐wise comparisons (see Methods section) are indicated as the following: (a) DLB vs control, iPD and E46K‐SNCA; (b) E46K‐SNCA vs DLB; (c) control vs iPD; (d) control vs iPD, E46K‐SNCA and DLB; (e) iPD vs DLB; (f) iPD vs E46K‐SNCA and DLB; (g) control vs E46K‐SNCA and DLB; (h) control vs iPD and DLB; (i) iPD vs E46K‐SNCA. DLB, dementia with Lewy bodies; E46K‐SNCA, patients with E46K mutation in α‐synuclein (SNCA) gene; HRR, color vision with Hardy Rand and Rittler pseudoisochromatic plates; iPD, idiopathic Parkinson's disease; LEDD, Levodopa Equivalent Daily Dose; MoCA, Montreal Cognitive Assessment; NA, nonapplicable; TES, Total Error Score; UPDRS III, Unified Parkinson's Disease Rating Scale part III; VA, visual acuity.
Primary Visual Function and Visual Cognition
As shown in Table 1, primary visual function was significantly worse in patients than in controls, mainly low‐contrast visual acuity, which was severely impaired in the E46K‐SNCA and DLB patients and moderately impaired in iPD patients. Regarding visual cognition scores, patients also performed worse than controls. E46K‐SNCA and DLB patients showed the most marked differences with respect to controls, especially for visual attention and processing speed domain, whereas E46K‐SNCA patients also performed significantly worse than iPD patients in the visual construction domain.
Macular Layer Thickness
When patients where compared as a single group with controls, the differences in retinal layer thicknesses that reached statistical significance were primarily within the range of 1 to 2 μm, which is below the 3.9‐μm axial resolution of Spectralis OCT (Supplementary Table 1). When individual patient groups were compared separately with controls, we identified a tendency for inner retinal layer thinning in LBD patients with aggressive phenotypes, especially in areas within the 3‐mm diameter disc. When compared with controls, ganglion cell‐inner plexiform layer complex (GCIPL) was significantly thinner in patients with DLB (−10.88 μm, P = .002), and INL was significantly thinner in the E46K‐SNCA mutation carriers (−3.72 μm, P = .02). Interestingly, the thinning of the GCIPL in DLB was significant for all subdivisions of the 3‐mm disc except the fovea (1‐mm disc), suggesting a selective thinning of the parafovea in DLB. Following a similar distribution, GCIPL and INL were significantly thinner in the DLB and E46K‐SNCA patients, respectively, than in the iPD patients. Contrarily, the ELM‐BM layer complex (see Figure 1) within the 3‐ to 6‐mm and 2‐ to 3‐mm rings was significantly thicker in the E46K‐SNCA mutation carriers when compared with controls and iPD patients, but the average differences were below 4 μm.
Association Between Regional Thickness of Macular Layers and Visual Outcomes
We first analyzed age‐corrected correlations between macular thickness measures and primary visual function and visual cognition parameters in LBD patients and controls separately. While correlations for the 3‐ to 6‐mm ring measures (perifovea) yielded practically nonsignificant results, the correlations for the disc and ring thicknesses of GCIPL within the 3‐mm area were positive and markedly significant in patients. In fact, we observed that, after False Discovery Rate correction, the most central area of the macula (3‐mm disc) was the region with the highest number of significant correlations with visual outcomes, specifically with low‐contrast visual acuity, visual attention and processing speed and visual perception. The former correlation pattern persisted when the 1‐ to 3‐mm ring (parafovea) was analyzed alone, whereas foveal GCIPL thickness (1‐mm disc) did not correlate with visual function. Interestingly, GCIPL thickness in the parafovea was also the parameter most frequently correlated with visual outcomes in iPD patients (Figs. 1D and 2). Furthermore, in univariate regression analysis, we confirmed that the selective atrophy of 1‐ to 3‐mm GCIPL ring was the single best predictor of visual dysfunction in patients with iPD (Table 2). The correlations of visual functions with INL thickness were statistically significant within the 3‐mm disc, but they were limited to visual cognitive abilities when all LBD patients were considered, losing significance when only iPD were assessed. It is worth mentioning that outer plexiform–Henle fiber–outer nuclear layer mean thickness within the 1‐mm disc was highly correlated with low‐contrast visual acuity and visual attention and processing speed in patients, even when iPD patients were analyzed separately. No other parameter from external retinal layers was found to be significantly correlated with visual function. None of the former associations were found in control participants (Fig. 1D).
Figure 2.
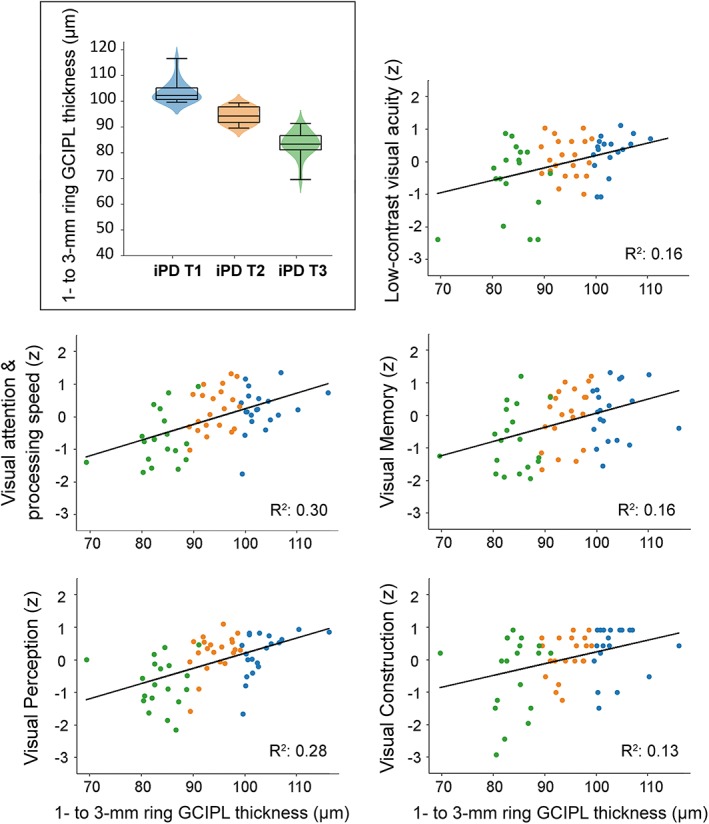
Scatterplots representing the relationship between 1‐ to 3‐mm mean GCIPL thickness and visual outcomes in iPD patients. Individual dots of scatter plots have been color‐coded according to iPD tertiles obtained from 1‐ to 3‐mm mean GCIPL thickness distribution: blue for upper tertile (T1), orange for middle tertile (T2) and green for lower tertile (T3). A combined violin‐ and box‐plot for 1‐ to 3‐mm mean GCIPL thickness distribution displaying iPD tertiles is shown in the upper left corner. Visual outcomes are provided in z‐scores. R 2 represents the proportion of the variance explained for each individual visual outcome by GCIPL thickness. Only False Discovery Rate (FDR)‐adjusted significant correlations are plotted. GCIPL, ganglion cell–inner plexiform layer complex; iPD, idiopathic Parkinson's disease. [Color figure can be viewed at http://wileyonlinelibrary.com]
Table 2.
Coefficients of regression models for significant predictors of visual impairment in patients with Parkinson's disease
| Univariate model | Constant (β0) | β | Bonferroni‐adjusted P |
|---|---|---|---|
| 3‐mm GCIPL thickness | 16.16 | −0.20 | .007 |
| 2‐mm GCIPL thickness | 13.46 | −0.19 | .008 |
| 1‐ to 3‐mm GCIPL thickness | 16.93 | −0.20 | .006 |
| 1‐ to 2‐mm GCIPL thickness | 13.52 | −0.17 | .006 |
| 2‐ to 3‐mm GCIPL thickness | 13.53 | −0.15 | .030 |
| Multivariate model | β | SE | P |
|---|---|---|---|
| Constant | 4.98 | 6.99 | .476 |
| 1‐ to 3‐mm GCIPL thickness | −0.15 | 0.06 | .007 |
| Age | 0.13 | 0.06 | .041 |
Univariate regression analysis of optical coherence tomography measurements revealed GCIPL thickness variables within the central 3 mm of the macula as significant predictors of visual disability in Parkinson's disease patients, after correcting P values for multiple comparisons with the Bonferroni method. Concretely, from the overlapping optical coherence tomography variables, the mean GCIPL thickness in a 1‐ to 3‐mm ring was found to be the most relevant variable. Multivariate regression analysis showed that age also acted as a significant predictor of visual dysfunction. β, beta coefficient resulting from logistic regression; GCIPL, ganglion cell–inner plexiform layer; SE, standard error.
Because 1‐ to 3‐mm ring (parafoveal) GCIPL thickness was the retinal parameter that presented the greatest atrophy in DLB patients and the best correlation with visual dysfunction in iPD patients, we used the latter measure for dividing iPD patients into 3 groups using tertiles to illustrate the exposure–response relationship between GCIPL atrophy and visual dysfunction (Fig. 2). The median GCIPL thickness of middle tertile was equivalent to that in controls, and median parafoveal GCIPL thickness of the lower tertile was similar to that in DLB patients (Supplementary Table 2). iPD tertiles did not differ in disease duration (Kruskal–Wallis, P = .283) or motor impairment (P = .279), but patients in the lower tertile were significantly older (Kruskal–Wallis, P = .001).
Accuracy of Parafoveal GCIPL Thickness to Identify Visually Impaired PD Patients
Clustering analysis identified 16 of 57 iPD patients as visually impaired because they were grouped together with patients from aggressive phenotype groups (DLB and E46K‐SNCA; Fig. 3). The receiver operating characteristic curve analysis of estimated probabilities showed that the predictive accuracy of 1‐ to 3‐mm GCIPL thickness alone or in combination with age was high (Table 2 and Fig. 3). The area under the curve of the univariate model was 0.85 (P < .001; 95% confidence interval, 0.738‐0.962; standard error, 0.057), and the optimal cutoff value of estimated probability was 0.35 (sensitivity, 81.3%; specificity, 85.4%; Youden's Index, 0.66). When age was added as an independent predictor to the model, the area under the curve increased to 0.88 (P < .001; 95% confidence interval, 0.779‐0.971; standard error, 0.049), and the optimal cutoff value was 0.44 (sensitivity, 81.3%; specificity, 90.2%; Youden's Index, 0.72; Fig. 3). The accuracy of the multivariate model (88%) was higher than the baseline accuracy of 72% (determined by the prevalence of visually unaffected iPD). When we repeated this process to determine whether 1‐ to 3‐mm GCIPL thickness alone or in combination with age could discriminate control participants from iPD patients, the area under the curve was below 0.61 (P > .05), and there was no improvement in the classification accuracy when compared with baseline accuracy (64%). These results suggest that GCIPL thickness in the parafovea is a suitable parameter for identifying iPD patients with visual impairment, but not for discriminating healthy controls from iPD.
Figure 3.
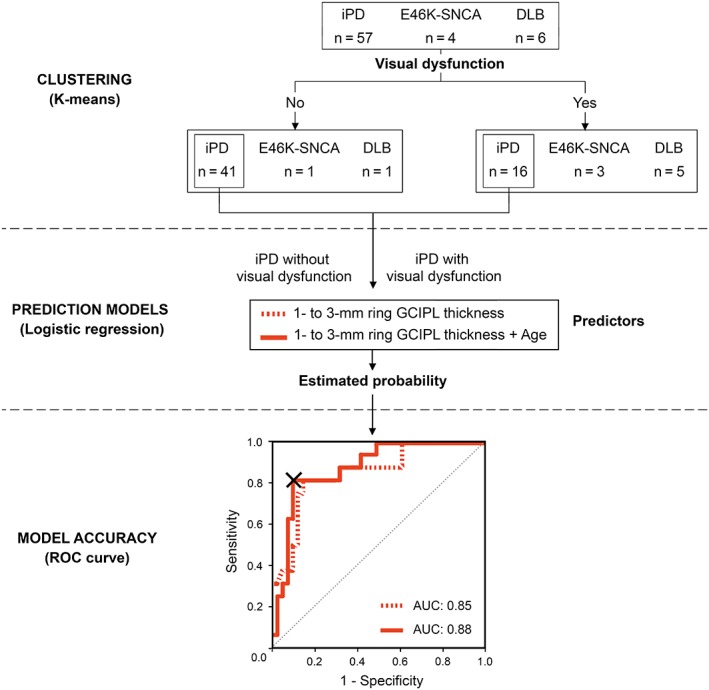
Upper panel, visual function–based clustering of patients. Middle panel, logistic regression analysis to assess the predictive ability of 1‐ to 3‐mm GCIPL thickness in differentiating iPD patients with visual dysfunction from visually unaffected iPD patients as a single predictor (dashed red line) or in combination with age (continuous red line). Lower panel, receiver operating characteristic (ROC) curve. Estimated probabilities resulting from logistic regression were used as classifiers. The “X” inside the ROC curve indicates the cutoff point of multivariate analysis that corresponds to an estimated probability of 0.44. The individual probability can be calculated using the following formula: P = 1 / [1 + e^(−4.98 + 0.15·[parafoveal GCIPL thickness] − 0.13·(age)]. Patients with probabilities above the cutoff value are considered to have visual dysfunction. AUC, area under the curve; DLB, dementia with Lewy bodies; E46K‐SNCA, carriers of E46K mutation in α‐synuclein gene; GCIPL, ganglion cell–inner plexiform layer complex; iPD, idiopathic Parkinson's disease. [Color figure can be viewed at http://wileyonlinelibrary.com]
Discussion
To our knowledge, this is the first study evaluating the influence that the specific distribution of retinal injury in LBDs has on a wide range of primary vision and visual cognition outcomes measured, respectively, with high‐resolution OCT images and a comprehensive battery of visual function and neuropsychological tests. Moreover, our study supports the view that selective atrophy of GCIPL in the parafoveal region (1‐ to 3‐mm ring) is a major contributor to visual disability in LBD patients and may help to identify iPD patients with severe visual impairment. Interestingly, thickness measurements in the perifoveal region (3‐ to 6‐mm ring) were not correlated with visual outcomes in patients, a finding that further highlights the specificity of macular damage in the most central and parafoveal regions in LBDs.
Several studies have evaluated retinal thickness using OCT in iPD and other parkinsonian syndromes. Most publications used standard 6‐mm diameter ETDRS grids to compute overall macular measurements of the entire retina and/or selected macular layers. ETDRS grids divide the macula into foveola‐centered concentric circular subfields of 1, 3, and 6 mm in diameter, and 3‐ and 6‐mm rings are further divided into superior, inferior, temporal, and nasal sectors. Altintas and colleagues20 first reported that macular volume and thickness were reduced in patients with iPD, except in the fovea. Similarly, the following year, Hajee and colleagues21 observed a significant thinning of inner retinal layers in the superior and inferior sectors of the macula, but failed to find differences in outer retinal layers. Despite that early evidence on retinal thinning in iPD, several subsequent studies have provided conflicting results. Whereas some authors have reported that iPD patients have a significant and marked thinning of the macula10, 12, 13, 14 and its inner retinal layers,8, 9, 11, 21, 22, 23, 24, 25, 26 others have evidenced outer retinal layer thinning,27 or even thickening,11, 24 and some have failed to find any differences.28, 29, 30, 31, 32, 33, 34 The variability in scanning protocols, acquisition parameters and built‐in segmentation algorithms across different OCT systems is a well‐established limitation for comparing the results of different studies35 and could account for the discrepancies found in the literature regarding retinal alterations in iPD. Specifically, the differences in acquisition speed and axial resolution between time‐domain and spectral‐domain OCTs might explain why studies using older time‐domain OCT devices (eg, Stratus) only detected significant differences between iPD patients and controls when absolute differences in thickness were greater than 10 μm,20, 36 whereas studies using spectral‐domain OCTs have yielded significant results with differences from 2 to 7 μm in thickness regardless of the area analyzed,7, 9, 12, 24, 25, 27, 34, 37, 38, 39, 40 which is consistent with the magnitude of inner retinal thinning observed in our E46K‐SNCA cohort. Some authors have found even greater thinning (11 to 19 μm) of selected ETDRS sectors in iPD patients,10, 22, 23 but none of them reported disease duration or measures of disease severity (eg, motor scales), meaning that we are unable to ascertain whether the latter OCT findings could be ascribed to longer disease duration or more severe disease, as we found in the present study for the most aggressive LBDs (DLB and E46K‐SNCA).
Another important factor that might underline the discrepancies between OCT studies in iPD relates to the retinal areas and layers for which macular measures were obtained.41 For example, the RTVue‐100 OCT (Optovue Inc., Fremont, CA, USA) calculates the average thickness of the inner retinal layers (retinal nerve fiber layer, GCL, and IPL) within foveola‐centered 5‐mm, 6‐mm, or 7‐mm diameter circular grids, whereas the Spectralis OCT provides the average thickness per layer in each sector of the 1‐, 3‐, and 6‐mm ETDRS grid, and the Cirrus OCT (Carl Zeiss Meditec AG, Jena, Germany) computes GCL and IPL thickness as a single measure and provides the mean values of the 6 sectors within an elliptical annulus around the fovea. Despite the differences in OCT devices and acquisition protocols, our findings are consistent with the results of several other studies, supporting the view that the parafoveal region of the macula is specifically affected in iPD and the hypothesis of foveal pit remodeling in iPD.7, 15, 16, 39, 42 Intriguingly, in all of the studies that have failed to find differences between iPD patients and controls, the analyses were limited to computing whole macular thickness,28, 29, 32, 37 overall macular volumes,27, 31 or average inner retinal layer thickness24, 29, 30, 31, 32, 33 in a 6‐mm diameter disc without further topographical analysis, which may have masked significant focal retinal differences. Spund and colleagues7 reported that the major difference in retinal thickness between controls and iPD patients was found between 0.5‐ and 2‐mm eccentric to the foveola. In accordance with those findings, our data indicated that macular layer thinning of inner retinal layers occurred in DLB and E46K‐SNCA groups, and this was evident when using the average thicknesses obtained from the 3‐mm disc, suggesting that macular changes in LBDs might exclusively occur in the most central regions. As we report in this work, 6‐mm disc average measures are highly influenced by values from the external 3‐ to 6‐mm ring, masking the differences that are mainly present within the central 3 mm of the macula.
Regarding the relationship between retinal parameters and functional outcomes, some studies have claimed that the pattern of retinal thinning is associated with a longer duration and clinical severity of the disease.7, 8, 43 However, we found that disease duration and motor impairment were comparable across iPD patients with different degrees of parafoveal GCIPL atrophy, suggesting that retinal atrophy might be present from the early stages. Moreover, the fact that a significant thinning of the inner retinal layers was only present in the DLB and E46K‐SNCA groups may indicate that the loss of inner retinal cells predominantly occurs in patients with aggressive phenotypes. A similar idea has also emerged from brain imaging studies, in which more pronounced gray matter loss has been found in individuals with aggressive LBDs than in those with iPD or healthy controls,44, 45 suggesting that this difference in tissue loss may help identify iPD patients with a worse prognosis. It is important to underline that so far, few studies have evaluated the association between OCT measures and primary vision or visual cognition in LBDs. Polo and colleagues38 reported that overall macular thinning in PD patients was correlated with worse low‐contrast visual acuity, contrast sensitivity and color vision, whereas Miri and colleagues46 observed that only the thinning of the parafoveal region correlated with contrast sensitivity. Our work extends the data far beyond those observations, showing that central macular parameters, especially those for the parafoveal region, are significantly associated with visual outcomes measured by a comprehensive set of primary vision and visual cognition tests. Even though we also found that foveal (1‐mm disc) outer plexiform–Henle fiber–outer nuclear layer thickness was highly correlated with visual outcomes, the lack of detectable thickness differences between controls and LBD patients make this parameter less interesting as a biomarker for PD.
To date, it is not known why retinal thinning takes place in LBDs, and there is no satisfactory pathophysiological explanation of the observed selective changes in the parafoveal inner retinal layers, while the other macular layers and areas seem to remain unaltered. Preclinical studies have provided some insights into the morphological retinal impairment in iPD, where a loss of dopaminergic network and synaptic contacts with amacrine cells has been observed.47 As the extent of GCIPL thinning is for some iPD patients lower than the thickness of a single cell body, a loss of the dendritic network in the inner retinal layers could be a plausible explanation in such cases.
Potential limitations of the current study include the smaller sample sizes of DLB and E46K‐SNCA groups and the older DLB group. First, it was challenging to identify patients fulfilling probable DLB criteria that were able to complete all study assessments. Second, genetic PD variants, including E46K‐SNCA, are rare and limited to specific families and series around the world. We believe the effects of sample size and age differences were mitigated by using Kruskal–Wallis, a robust statistical test for the heterogeneity of variances, and by controlling for age in correlation analyses. Another potential limitation of our study is that, given its exploratory nature, we did not correct for multiple testing when computing group differences in macular thicknesses for areas with different eccentricities. Likewise, it is reasonable to suppose that, in addition to retinal alterations, patients with LBDs may have abnormalities at any level of the visual pathway or visual associative areas, as demonstrated by quantitative structural, functional and metabolic brain magnetic resonance imaging,48, 49, 50 and such abnormalities may further contribute to visual impairment. Finally, in the multivariate classification strategy, we provide cutoff values to estimate the individual probability of iPD patients for presenting visual impairment. Although age incremented the accuracy of the model, the assumption of independence of predictors may not hold true, and the data must be interpreted with caution.
In conclusion, the present work represents an innovative approach for understanding the impact of the distribution of retinal injury on visual outcomes in patients with LBDs, demonstrating that selective atrophy of GCIPL in the parafoveal region, observable with spectral‐domain OCT, might be a key contributor to visual disability. Furthermore, given that OCT provides noninvasive, fast, and highly reproducible measures, our results may ultimately have practical implications for the screening of nonmotor disabilities in iPD patients.
Author Roles
1) Research project: A. Conception, B. Organization, C. Execution; 2) Statistical Analysis: A. Design, B. Execution, C. Review and Critique; 3) Manuscript: A. Writing of the first draft, B. Review and Critique.
A.M.‐G.: 1B, 1C, 2A, 2B, 2C, 3A, 3B
R.P.: 1B, 1C, 3B
P.R.: 2C
M.G.: 1C, 3B
B.A.: 1C, 3B
O.L.‐J.: 1B, 1C, 3B
M.A.: 1B, 1C, 3B
B.T.: 1C, 3B
N.I.‐B.: 3B
N.O.: 3B
J.P.: 3B
J.C.: 2A, 2C
J.C.G.‐E.: 1A, 1C, 3B
I.G.: 1A, 1B, 2A, 2C, 3B
Full financial disclosures for the past 12 months
Nothing to report.
Supporting information
Appendix S1: Supplementary Information
Acknowledgments
We thank Biscay PD Association (ASPARBI) and all the participants involved in the study for making this research possible.
Correction added on September 13, 2019, after first online publication: Article title in article PDF has been corrected.
Correction added on May 30, 2019, after first online publication: Figure 1 image has been updated.
Funding agencies: This study was partially cofunded by the Michael J. Fox Foundation (2014 Rapid Response Innovation Awards; Grant 10189), by the Carlos III Health Institute through Projects PI14/00679 and PI16/00005, and Juan Rodes Grant JR15/00008 (I.G.) (cofunded by the European Regional Development Fund/European Social Fund "Investing in Your Future"), and by the Department of Health of the Basque Government through Project 2016111009.
Relevant conflicts of interests/financial disclosures: B.T.: speaking fees, AbbVie, and travel expenses, Italfarmaco. J.C.G.‐E.: speaking fees, AbbVie, and travel expenses, Italfarmaco; I.G.: travel expenses, Zambon Group.
References
- 1. Zarranz JJ, Alegre J, Gomez‐Esteban JC, et al. The new mutation, E46K, of alpha‐synuclein causes Parkinson and Lewy body dementia. Ann Neurol 2004;55(2):164‐173. [DOI] [PubMed] [Google Scholar]
- 2. Inigo‐Marco I, Valencia M, Larrea L, et al. E46K alpha‐synuclein pathological mutation causes cell‐autonomous toxicity without altering protein turnover or aggregation. Proc Natl Acad Sci U S A 2017;114(39):E8274‐E8283. [DOI] [PMC free article] [PubMed] [Google Scholar]
- 3. Schapira AHV, Chaudhuri KR, Jenner P. Non‐motor features of Parkinson disease. Nat Rev Neurosci 2017;18(7):435‐450. [DOI] [PubMed] [Google Scholar]
- 4. Armstrong RA. Visual dysfunction in Parkinson's disease. Int Rev Neurobiol 2017;134:921‐946. [DOI] [PubMed] [Google Scholar]
- 5. Williams‐Gray CH, Foltynie T, Brayne CE, Robbins TW, Barker RA. Evolution of cognitive dysfunction in an incident Parkinson's disease cohort. Brain 2007;130(Pt 7):1787‐1798. [DOI] [PubMed] [Google Scholar]
- 6. Ortuno‐Lizaran I, Beach TG, Serrano GE, Walker DG, Adler CH, Cuenca N. Phosphorylated alpha‐synuclein in the retina is a biomarker of Parkinson's disease pathology severity. Mov Disord 2018;33(8):1315‐1324. [DOI] [PMC free article] [PubMed] [Google Scholar]
- 7. Spund B, Ding Y, Liu T, et al. Remodeling of the fovea in Parkinson disease. J Neural Transm 2013;120(5):745‐753. [DOI] [PubMed] [Google Scholar]
- 8. Garcia‐Martin E, Larrosa JM, Polo V, et al. Distribution of retinal layer atrophy in patients with Parkinson disease and association with disease severity and duration. Am J Ophthalmol 2014;157(2):470‐478.e472. [DOI] [PubMed] [Google Scholar]
- 9. Bayhan HA, Aslan Bayhan S, Tanik N, Gurdal C. The association of spectral‐domain optical coherence tomography determined ganglion cell complex parameters and disease severity in Parkinson's disease. Curr Eye Res 2014;39(11):1117‐1122. [DOI] [PubMed] [Google Scholar]
- 10. Garcia‐Martin E, Satue M, Otin S, et al. Retina measurements for diagnosis of Parkinson disease. Retina (Philadelphia, Pa) 2014;34(5):971‐980. [DOI] [PubMed] [Google Scholar]
- 11. Chorostecki J, Seraji‐Bozorgzad N, Shah A, et al. Characterization of retinal architecture in Parkinson's disease. J Neurol Sci 2015;355(1‐2):44‐48. [DOI] [PubMed] [Google Scholar]
- 12. Mailankody P, Battu R, Khanna A, Lenka A, Yadav R, Pal PK. Optical coherence tomography as a tool to evaluate retinal changes in Parkinson's disease. Parkinsonism Relat Disord 2015;21(10):1164‐1169. [DOI] [PubMed] [Google Scholar]
- 13. Ma LJ, Xu LL, Mao CJ, et al. Progressive changes in the retinal structure of patients with Parkinson's disease. J Parkinsons Dis 2018;8(1):85‐92. [DOI] [PubMed] [Google Scholar]
- 14. Sengupta P, Dutta K, Ghosh S, Mukherjee A, Pal S, Basu D. Optical coherence tomography findings in patients of Parkinson's disease: an Indian perspective. Ann Indian Acad Neurol 2018;21(2):150‐155. [DOI] [PMC free article] [PubMed] [Google Scholar]
- 15. Miri S, Shrier EM, Glazman S, et al. The avascular zone and neuronal remodeling of the fovea in Parkinson disease. Ann Clin Transl Neurol 2015;2(2):196‐201. [DOI] [PMC free article] [PubMed] [Google Scholar]
- 16. Slotnick S, Ding Y, Glazman S, et al. A novel retinal biomarker for Parkinson's disease: Quantifying the foveal pit with optical coherence tomography. Mov Disord 2015;30(12):1692‐1695. [DOI] [PubMed] [Google Scholar]
- 17. Tewarie P, Balk L, Costello F, et al. The OSCAR‐IB consensus criteria for retinal OCT quality assessment. PLoS One 2012;7(4):e34823. [DOI] [PMC free article] [PubMed] [Google Scholar]
- 18. Cruz‐Herranz A, Balk LJ, Oberwahrenbrock T, et al. The APOSTEL recommendations for reporting quantitative optical coherence tomography studies. Neurology 2016;86(24):2303‐2309. [DOI] [PMC free article] [PubMed] [Google Scholar]
- 19. Demirkaya N, van Dijk HW, van Schuppen SM, et al. Effect of age on individual retinal layer thickness in normal eyes as measured with spectral‐domain optical coherence tomography. Invest Ophthalmol Vis Sci 2013;54(7):4934‐4940. [DOI] [PMC free article] [PubMed] [Google Scholar]
- 20. Altintas O, Iseri P, Ozkan B, Caglar Y. Correlation between retinal morphological and functional findings and clinical severity in Parkinson's disease. Doc Ophthalmol 2008;116(2):137‐146. [DOI] [PubMed] [Google Scholar]
- 21. Hajee ME, March WF, Lazzaro DR, et al. Inner retinal layer thinning in Parkinson disease. Arch Ophthalmol 2009;127(6):737‐741. [DOI] [PubMed] [Google Scholar]
- 22. Aaker GD, Myung JS, Ehrlich JR, Mohammed M, Henchcliffe C, Kiss S. Detection of retinal changes in Parkinson's disease with spectral‐domain optical coherence tomography. Clin Ophthalmol 2010;4:1427‐1432. [DOI] [PMC free article] [PubMed] [Google Scholar]
- 23. Zivkovic M, Dayanir V, Stamenovic J, et al. Retinal ganglion cell/inner plexiform layer thickness in patients with Parkinson's disease. Folia Neuropathol 2017;55(2):168‐173. [DOI] [PubMed] [Google Scholar]
- 24. Unlu M, Gulmez Sevim D, Gultekin M, Karaca C. Correlations among multifocal electroretinography and optical coherence tomography findings in patients with Parkinson's disease. Neurol Sci 2018;39(3):533‐541. [DOI] [PubMed] [Google Scholar]
- 25. Ucak T, Alagoz A, Cakir B, Celik E, Bozkurt E, Alagoz G. Analysis of the retinal nerve fiber and ganglion cell ‐ Inner plexiform layer by optical coherence tomography in Parkinson's patients. Parkinsonism Relat Disord 2016;31:59‐64. [DOI] [PubMed] [Google Scholar]
- 26. Moschos MM, Chatziralli IP. Evaluation of choroidal and retinal thickness changes in Parkinson's disease using spectral domain optical coherence tomography. Semin Ophthalmol 2018;33(4):494‐497. [DOI] [PubMed] [Google Scholar]
- 27. Roth NM, Saidha S, Zimmermann H, et al. Photoreceptor layer thinning in idiopathic Parkinson's disease. Mov Disord 2014;29(9):1163‐1170. [DOI] [PubMed] [Google Scholar]
- 28. Archibald NK, Clarke MP, Mosimann UP, Burn DJ. Retinal thickness in Parkinson's disease. Parkinsonism Relat Disord 2011;17(6):431‐436. [DOI] [PubMed] [Google Scholar]
- 29. Albrecht P, Muller AK, Sudmeyer M, et al. Optical coherence tomography in parkinsonian syndromes. PLoS One 2012;7(4):e34891. [DOI] [PMC free article] [PubMed] [Google Scholar]
- 30. Schneider M, Muller HP, Lauda F, et al. Retinal single‐layer analysis in Parkinsonian syndromes: an optical coherence tomography study. J Neural Transm (Vienna) 2014;121(1):41‐47. [DOI] [PubMed] [Google Scholar]
- 31. Pillai JA, Bermel R, Bonner‐Jackson A, et al. Retinal nerve fiber layer thinning in Alzheimer's disease: a case‐control study in comparison to normal aging, Parkinson's disease, and non‐Alzheimer's dementia. Am J Alzheimers Dis Other Demen 2016;31(5):430‐436. [DOI] [PMC free article] [PubMed] [Google Scholar]
- 32. Eraslan M, Balci SY, Cerman E, Temel A, Suer D, Elmaci NT. Comparison of optical coherence tomography findings in patients with primary open‐angle glaucoma and Parkinson disease. J Glaucoma 2016;25(7):e639‐646. [DOI] [PubMed] [Google Scholar]
- 33. Matlach J, Wagner M, Malzahn U, et al. Retinal changes in Parkinson's disease and glaucoma. Parkinsonism Relat Disord 2018;56:41‐46. [DOI] [PubMed] [Google Scholar]
- 34. Bittersohl D, Stemplewitz B, Keseru M, Buhmann C, Richard G, Hassenstein A. Detection of retinal changes in idiopathic Parkinson's disease using high‐resolution optical coherence tomography and heidelberg retina tomography. Acta Ophthalmol 2015;93(7):e578‐584. [DOI] [PubMed] [Google Scholar]
- 35. Giani A, Cigada M, Choudhry N, et al. Reproducibility of retinal thickness measurements on normal and pathologic eyes by different optical coherence tomography instruments. Am J Ophthalmol 2010;150(6):815‐824. [DOI] [PubMed] [Google Scholar]
- 36. Cubo E, Tedejo RP, Rodriguez Mendez V, Lopez Pena MJ, Trejo Gabriel YGJM. Retina thickness in Parkinson's disease and essential tremor. Mov Disord 2010;25(14):2461‐2462. [DOI] [PubMed] [Google Scholar]
- 37. Satue M, Seral M, Otin S, et al. Retinal thinning and correlation with functional disability in patients with Parkinson's disease. Br J Ophthalmol 2014;98(3):350‐355. [DOI] [PubMed] [Google Scholar]
- 38. Polo V, Satue M, Rodrigo MJ, et al. Visual dysfunction and its correlation with retinal changes in patients with Parkinson's disease: an observational cross‐sectional study. BMJ Open 2016;6(5):e009658. [DOI] [PMC free article] [PubMed] [Google Scholar]
- 39. Ahn J, Lee JY, Kim TW, et al. Retinal thinning associates with nigral dopaminergic loss in de novo Parkinson disease. Neurology 2018;91(11):e1003‐e1012. [DOI] [PubMed] [Google Scholar]
- 40. Garcia‐Martin E, Rodriguez‐Mena D, Satue M, et al. Electrophysiology and optical coherence tomography to evaluate Parkinson disease severity. Invest Ophthalmol Vis Sci 2014;55(2):696‐705. [DOI] [PubMed] [Google Scholar]
- 41. Sander B, Al‐Abiji HA, Kofod M, Jorgensen TM. Do different spectral domain OCT hardwares measure the same? Comparison of retinal thickness using third‐party software. Graefes Arch Clin Exp Ophthalmol 2015;253(11):1915‐1921. [DOI] [PMC free article] [PubMed] [Google Scholar]
- 42. Adam CR, Shrier E, Ding Y, Glazman S, Bodis‐Wollner I. Correlation of inner retinal thickness evaluated by spectral‐domain optical coherence tomography and contrast sensitivity in Parkinson disease. J Neuroophthalmol 2013;33(2):137‐142. [DOI] [PubMed] [Google Scholar]
- 43. Moreno‐Ramos T, Benito‐Leon J, Villarejo A, Bermejo‐Pareja F. Retinal nerve fiber layer thinning in dementia associated with Parkinson's disease, dementia with Lewy bodies, and Alzheimer's disease. J Alzheimers Dis 2013;34(3):659‐664. [DOI] [PubMed] [Google Scholar]
- 44. Beyer MK, Larsen JP, Aarsland D. Gray matter atrophy in Parkinson disease with dementia and dementia with Lewy bodies. Neurology 2007;69(8):747‐754. [DOI] [PubMed] [Google Scholar]
- 45. Lee JE, Park B, Song SK, Sohn YH, Park HJ, Lee PH. A comparison of gray and white matter density in patients with Parkinson's disease dementia and dementia with Lewy bodies using voxel‐based morphometry. Mov Disord 2010;25(1):28‐34. [DOI] [PubMed] [Google Scholar]
- 46. Miri S, Glazman S, Mylin L, Bodis‐Wollner I. A combination of retinal morphology and visual electrophysiology testing increases diagnostic yield in Parkinson's disease. Parkinsonism Relat Disord 2016;22(suppl 1):S134‐S137. [DOI] [PubMed] [Google Scholar]
- 47. Cuenca N, Herrero MT, Angulo A, et al. Morphological impairments in retinal neurons of the scotopic visual pathway in a monkey model of Parkinson's disease. J Comp Neurol 2005;493(2):261‐273. [DOI] [PubMed] [Google Scholar]
- 48. Shine JM, Muller AJ, O'Callaghan C, Hornberger M, Halliday GM, Lewis SJ. Abnormal connectivity between the default mode and the visual system underlies the manifestation of visual hallucinations in Parkinson's disease: a task‐based fMRI study. NPJ Parkinsons Dis 2015;1:15003. [DOI] [PMC free article] [PubMed] [Google Scholar]
- 49. Summerfield C, Gomez‐Anson B, Tolosa E, et al. Dementia in Parkinson disease: a proton magnetic resonance spectroscopy study. Arch Neurol 2002;59(9):1415‐1420. [DOI] [PubMed] [Google Scholar]
- 50. Arrigo A, Calamuneri A, Milardi D, et al. Visual system involvement in patients with newly diagnosed Parkinson disease. Radiology 2017;285(3):885‐895. [DOI] [PubMed] [Google Scholar]
Associated Data
This section collects any data citations, data availability statements, or supplementary materials included in this article.
Supplementary Materials
Appendix S1: Supplementary Information