

Abstract
Understanding the role of biotic interactions in shaping natural communities is a long-standing challenge in ecology. It is particularly pertinent to parasite communities sharing the same host communities and individuals, as the interactions among parasites—both competition and facilitation—may have far-reaching implications for parasite transmission and evolution. Aggregated parasite burdens may suggest that infected host individuals are either more prone to infection, or that infection by a parasite species facilitates another, leading to a positive parasite–parasite interaction. However, parasite species may also compete for host resources, leading to the prediction that parasite–parasite associations would be generally negative, especially when parasite species infect the same host tissue, competing for both resources and space. We examine the presence and strength of parasite associations using hierarchical joint species distribution models fitted to data on resident parasite communities sampled on over 1300 small mammal individuals across 22 species and their resident parasite communities. On average, we detected more positive associations between infecting parasite species than negative, with the most negative associations occurring when two parasite species infected the same host tissue, suggesting that parasite species associations may be quantifiable from observational data. Overall, our findings suggest that parasite community prediction at the level of the individual host is possible, and that parasite species associations may be detectable in complex multi-species communities, generating many hypotheses concerning the effect of host community changes on parasite community composition, parasite competition within infected hosts, and the drivers of parasite community assembly and structure.
Keywords: host–parasite interactions, coinfection, niche model, parasite niche, within-host dynamics, competition
1. Introduction
Parasite species tend to infect multiple host species [1–4], and the specificity of parasite species has been intensively studied [5,6], providing insight into the host trait [7] and phylogenetic [8–12] relationships that promote differential host species utilization. However, substantially less research has been performed to understand the distribution of parasite species on individuals in the host community [13]. Coinfection at the individual host level is quite common [14], as a subset of particular individuals tend to harbour the majority of internal and external parasite species [15]. Aggregated parasite burdens suggest that infected host individuals are either far more prone to infection or that parasite species are potentially facilitative, which would occur if the infection of the host individual by one parasite enhances transmission of other parasite species [4,16]. This would lead to positive parasite–parasite associations [17,18]. However, parasite species may also compete for host resources (resource-mediated interaction) or through differential regulation of host immune response (immune-mediated interaction). Parasite competition for host resources would suggest that parasite–parasite associations would generally be negative [19], especially when parasite species infect the same host tissue, competing for both resources and space [20]. Immune-mediated interactions are more nuanced. In a sequential infection scenario, immunosuppression of the host by first arriving parasite may facilitate establishment and replication of later arriving parasites [21]. However, a cross-reactive immune responses elicited by the first parasite influence has the potential to suppress the success of later arriving parasites [22]. In theory, the intensity of within-host interactions is expected to be stronger between closely related parasites due to, for example, overlap in resource use and similarity in the elicited immune recognition profiles [23,24]. Regardless of the mechanism mediating within-host dynamics of parasites, the sequence and timing of infections may be a critical determinant of the outcome [20]. Understanding how parasite species form interactive communities within infected host individuals has significant epidemiological [25] and evolutionary [23] implications.
Previous work at the individual host scale has focused on the influence of host behaviour [26], geographical location [15,27] and traits [28] to understand why some individuals, typically of a single host species, are infected and some are not. However, the processes underlying differential parasite burdens among host individuals may depend on coinfecting parasite species [7]. By examining the entire coinfecting parasite community (i.e. the infracommunity), it may be possible to gain further insight into how host traits, geographical influences, and associations among coinfecting parasite species contribute to coinfection differences. Perhaps the strongest evidence for parasite–parasite associations within infected hosts has come from manipulative experiments of natural populations of host species infected by two potentially interacting parasites [16,29], as this approach is capable of disentangling correlated exposure and transmission from parasite–parasite association [30]. However, a number of field studies have examined changes in parasite infection intensity to understand within-host parasite interactions [3,31]. Extensions of this work into multi-species host and parasite assemblages would become logistically untenable experimentally, but understanding how complex interactions among parasite species shape communities is an important issue in disease ecology [32]. Further, approaches that consider the influence of host traits, geographical and seasonal dynamics may provide further insight into the structure of parasite communities and associations across space and in shifting climate conditions.
If we consider host individuals as islands [33], which parasitic species occupy and obtain resources from, then it follows that parasitic species may interact with one another [31,34]. A prevailing idea in ecology is that more similar species should interact more strongly [35,36] through shared demand of resources and shared habitats. The importance of species interactions and competition in structuring free-living communities has been acknowledged for decades [37–39], while assessment of how similar associations shape parasite communities has lagged considerably behind. For parasitic species, the habitat is the host, such that the overlap between two parasitic species in the assemblages of host species they infect is a measure of functional overlap in habitat utilization. This suggests that parasite species that often occupy the same location within or on an infected host individual are predicted to interact more strongly [31]. This can be mediated by a number of factors. For instance, competition for space in the host intestine may lead to stronger negative species associations for intestinal parasites [3]. However, parasite species associations may also be mediated through the lens of the host immune system [21,40], as the host response to infection by one parasite can influence transmission success of other parasite species through the effects of immunodepression, or the balance between host resources and regulation of Th1 and Th2 arms of the host immune response [41]. The recent advent of joint species distribution modelling [42] provides opportunities to model the distribution of parasite communities among host individuals and species (see [43] for an example in a single host species), potentially providing insight into parasite interactions and host utilization patterns [44].
Predicting parasite community composition and detecting parasite associations within infected host individuals are challenging ecological questions. Inherent difficulties exist due to the logistics of parasite community data collection, issues of accounting for both host traits and geographical variables, and lack of appropriate statistical modelling frameworks [44]. However, the ability to predict parasite community composition is a pressing need, as host distributions are shifting in response to climate [45], resulting in the formation of novel host and parasite communities [46]. Further, determining the extent to which parasite species form interactive communities is still unknown [31]. Here, we disentangle the effects of host traits and habitat covariates using a joint species modelling framework, allowing the examination of parasite associations after accounting for individual host variation, host species, seasonal effects and site-level variation. We use data from parasite occurrence records from 65 parasitic species inhabiting over 1300 host individuals across 22 small mammal host species in the Sonoran desert. Parasite species found infecting the stomach and cecum tended to interact more negatively, suggesting a potential role for parasite competition. However, parasite associations were generally positive, suggesting that unmeasured host trait variation, geographical variation in transmission or host distribution, or correlated transmission and infection processes may promote apparently facilitatory associations among many parasite species, despite competing for host resources.
2. Methods
(a). Parasite communities of Sonoran desert small mammals
Small mammal and parasite data (available from [47]) were collected as part of the Sevilleta Long-Term Ecological Research project, located in central New Mexico. The data used here are from 1992 to 1997, and represent 1830 parasitized individuals of 23 host species across three families (Cricetidae, Heteromyidae and Sciuridae). Sampling design and mammal processing protocols are reported elsewhere [47]. Each site contained two sampling webs each consisting of 144 kill traps. During each sampling event, traps were set and checked for three trap nights.
Internal and external parasites were examined by necropsy [48], including host coat, stomach, intestines, body cavity and faeces. Parasites included coccidians (Eucoccidiorida), acanthocephalans (Moniliformida), tapeworms (Cyclophyllidea), nematodes (Ascaridida, Oxyurida, Rhabditida, Spirurida, Strongylida and Trichurida) and arthropods (Siphonaptera, Phthiraptera and Diptera), resulting in a total of 65 parasite species. However, we did not consider parasite species that were only found in host faeces in our main analyses, as these parasite species (33% of the species examined) may infect any part of the host gastrointestinal tract. The inclusion of these parasite species and associated host records does not substantially change our findings (see electronic supplementary material). After removing these parasites and the associated host individuals where only these parasite species occurred, a total of 1347 individual hosts of 22 different species and their associated parasite communities remained.
Host traits and geographical location could jointly influence host susceptibility and parasite transmission (e.g. [7]). As part of the data collection, several geographical (year, site, season) and host trait (host sex and species) data were collected. There were a total of six sites, spanning three distinct habitat types (i.e. grassland, larrea and woodland) that were sampled across three seasons (early summer, late summer and autumn).
(b). Hierarchical modelling of species communities framework
While the majority of evidence for parasite–parasite associations comes from manipulative studies [29,49], the advent of species distribution models which leverage community-scale data may provide a way to utilize observational data to predict parasite community composition and detect parasite–parasite associations. Joint species distribution models extend single species distribution models by leveraging data on entire ecological communities and their responses to environmental variation and to each other [50,51]. Here, we apply the hierarchical modelling of species communities (HMSC) approach [51], which allows one to incorporate study designs with multiple hierarchical levels, species traits and phylogenetic relationships. When compared with a large set of other single and joint species distribution models, HMSC had the highest model performance of any method, especially for communities with a large proportion of rare species [42]. We used this approach to characterize how the structure of parasite communities varies in space, time and among host species.
As a response matrix (Y matrix [51]), we used the presence–absences of 43 parasite species scored on 1347 host individuals. As fixed effects (X matrix [51]), we included the sex (male or female) of the host individual. As community-level random effects that relate to spatial and temporal variation, we included the year of the study (six levels), the study site (six levels), and the season of sampling (three levels). As community-level random effects that relate to host traits, we include the host species (22 levels). To examine parasite-to-parasite associations among individual hosts, we also included the host individual (1347 levels) as a community-level random effects. As species traits (T matrix [51]), we included the range of host tissues each parasite was found (i.e. cecum, coat, small intestine or stomach), effectively measuring tissue specificity of each parasite species. The inclusion of parasite species only found in host faeces into the model is provided in the electronic supplementary material. Lastly, we compared parasite species associations estimated by this full model (measuring residual associations) to a model with host individual as a random effect, but excluding other random effects as well as the fixed effects (measuring raw associations). This is more similar to traditional correlational approaches at estimating parasite associations [44], and the differences between estimated parasite associations could be suggestive of the importance of considering the random effects discussed above.
We fitted models by running four MCMC chains with 100 × thin iterations used for burn-in and 200 × thin iterations for the actual sampling, where we varied thinning (thin = 1, 10, 100, …) until the results converged. The model was cross-validated using fivefold cross validation, in which the 1347 sampling units were randomly allocated into five equally sized folds. Model performance was assessed using Tjur’s R2, area under the receiver operating characteristic (AUC), and root-mean-squared error (RMSE). Tjur’s R2 measures the difference in predicted probabilities of occurrence and probability of absence. AUC captures the ability of the model to rank occurrences correctly. RMSE measures the squared difference between estimated occurrence and true species occurrence.
(c). Determinants of community structure and parasite–parasite associations
Here, we were interested in assessing both the determinants of community structure, and the nature of parasite–parasite associations within host individuals. First, to quantify determinants of community structure, we performed a variance partitioning among the fixed and random effects included in the model. To address the relative differences in the effect of host species and other covariates on parasite communities, we compared the proportions of variance attributed to each effect as a function of the host tissue which the parasite infects.
Second, we characterized parasite–parasite associations through variance–covariance matrices (Ω [51]) defined for each of the five community-level random effects included at the model, which is standardized to a correlation matrix with values bounded between −1 and 1. Among these, we were especially interested at the host individual level, as that potentially relates to ecological interactions among the parasite species. We visualized the parasite-to-parasite associations with more than 75% and 90% posterior support for either positive or negative interaction. For each possible combination of infection site, we calculated the mean and variance for each combination of host tissues infected (e.g. the mean and variance of parasite–parasite associations of those parasites infecting the host stomach compared to ectoparasitic species). We would expect that if parasite species interact through direct competition for resources (e.g. space), host tissues in closer proximity should have more negative species associations. On the other hand, positive pairwise associations between parasite species could be indicative of facilitation or unmeasured host variation.
3. Results
(a). Host–parasite interactions in the Sonoran desert
A total of 1347 host individuals were sampled for internal and external parasites (table 1; electronic supplementary material, table S4). The number of parasite occurrences varied across host species, as did the specificity of parasite species (figure 1). There were nearly equal numbers of internal and external parasite species, though parasites found in host stomach were fairly rare (figure 1). We used the dominant host tissue a given parasite infects as a parasite trait in our model. However, apart from ectoparasite species, parasite species were sometimes found in multiple parts of the gastrointestinal tract (electronic supplementary material, figure S1).
Table 1.
The number of host individuals sampled for parasite species at each of the six habitats and three habitat types (grassland, larrea and woodland) for each of host species. One host species, Peromyscus difficilis, had no recorded non-fecal parasites, and was therefore omitted from the main text analyses. Two of the sites (Five Points and Rio Salado) contain both grassland and larrea habitat types.
| grassland |
larrea |
woodland |
|||||
|---|---|---|---|---|---|---|---|
| host species | Five Points | Rio Salado | Five Points | Rio Salado | Sepultrua | Two-Twenty-Two | total |
| Ammospermophilus interpres | 0 | 0 | 0 | 0 | 2 | 0 | 2 |
| Chaetodipus intermedius | 0 | 0 | 0 | 0 | 7 | 53 | 60 |
| Dipodomys merriami | 9 | 106 | 316 | 236 | 0 | 104 | 771 |
| Dipodomys ordi | 102 | 201 | 1 | 25 | 0 | 0 | 329 |
| Dipodomys spectabilis | 75 | 0 | 68 | 5 | 0 | 1 | 149 |
| Eutamias dorsalis | 0 | 0 | 0 | 0 | 0 | 7 | 7 |
| Eutamias quadrivittatus | 0 | 0 | 0 | 0 | 20 | 0 | 20 |
| Neotoma albigula | 1 | 101 | 8 | 31 | 29 | 35 | 205 |
| Neotoma micropus | 2 | 0 | 5 | 1 | 0 | 0 | 8 |
| Onychomys arenicola | 34 | 6 | 34 | 6 | 0 | 0 | 80 |
| Onychomys leucogaster | 0 | 64 | 0 | 32 | 0 | 0 | 96 |
| Perognathus flavus | 1 | 94 | 2 | 21 | 0 | 8 | 126 |
| Perognathus flavescens | 125 | 1 | 41 | 36 | 16 | 38 | 257 |
| Peromyscus boylii | 0 | 0 | 0 | 0 | 6 | 7 | 13 |
| Peromyscus difficilis | 0 | 0 | 0 | 0 | 1 | 1 | 2 |
| Peromyscus eremicus | 0 | 1 | 7 | 2 | 0 | 0 | 10 |
| Peromyscus leucopus | 2 | 35 | 0 | 40 | 0 | 4 | 81 |
| Peromyscus maniculatus | 0 | 3 | 0 | 0 | 0 | 0 | 3 |
| Peromyscus truei | 7 | 22 | 1 | 34 | 163 | 13 | 240 |
| Reithrodontomys megalotis | 3 | 18 | 5 | 28 | 1 | 0 | 55 |
| Reithrodontomys montanus | 3 | 2 | 1 | 10 | 0 | 0 | 16 |
| Sigmodon hispidus | 0 | 1 | 0 | 2 | 0 | 0 | 3 |
| Spermophilus spilosoma | 15 | 7 | 1 | 2 | 0 | 0 | 25 |
| total | 146 | 389 | 290 | 307 | 108 | 107 | 1347 |
Figure 1.

Parasite occurrence records on Sonoran desert small mammals. The top bar identifies each parasite species (columns) by the host tissue they infect (caecum in purple; ectoparasites in blue; small intestine in green; stomach in yellow). Cells of the matrix are coloured based on the log number of times a given parasite was found on a given host species. One host species, Peromyscus difficilis, had no recorded non-fecal parasites, and was therefore omitted from the main text analyses. (Online version in colour.)
(b). Model performance
Parasite species responded differentially to geographical (year, site, season) and host trait (host species and sex) variables (figure 2), though host species commonly explained the most variation in infection at the individual level. Despite the variation in the importance of fixed and random effects, model performance—based on fivefold cross validation—was generally high when predicting species occurrence probability when model performance was quantified using AUC (AU̅C = 0.82, σAUC = 0.09), Tjur’s R2 (Tjur̅’s R2 = 0.09, σTjur’s R2 = 0.08) or RMSE (RM̅SE = 0.11, σRMSE = 0.09). Measures of model performance were strongly positively related (electronic supplementary material, figure S2), suggesting that our measures are capturing model performance in a similar manner. In the electronic supplementary material, we examine how each of the fixed and random effects influence model performance, providing support for the use of the HMSC framework and the importance of the inclusion of random effects—particularly information on host species—to model performance (see electronic supplementary material, section ‘Model structure and random effects’). That is, model performance was the highest when random levels were included in the model fitting, and when species associations were used in model predictions.
Figure 2.

The variance explained by each random effect for each parasite species (columns), suggesting that host species explains the most variation in the distribution of parasite communities among host individuals. The coloured bar at the bottom identifies parasite species by the dominant host tissue they are found to infect (caecum in purple; ectoparasites in blue; small intestine in green; stomach in yellow). Bar height was standardized such that the highest Tjur’s R2 value of the trained model contained no unexplained variation, in order to show the relative importance of fixed and random effects to model performance. (Online version in colour.)
The importance of host species was consistent across the different host tissue groups a parasite could infect, suggesting that host species influenced parasite occurrence roughly the same regardless of the host tissue infected (figure 2), a value closely tied to parasite life-history and transmission mode. Further, when random effects were considered individually, the largest improvement in model performance with the addition of one random effect was achieved by including information on host species (see electronic supplementary material, table S2). While the inclusion of an individual-level random effect did not increase model performance (electronic supplementary material, table S1), including information on the habitat, season and host characteristics improved model performance (see electronic supplementary material, table S1). Further, model performance (AUC and Tjur’s R2 values) showed no strong variation as a function of dominant host tissue infected by parasite species, though model performance was reduced for parasite species that infected few host species or were found on few host individuals (figure 3).
Figure 3.
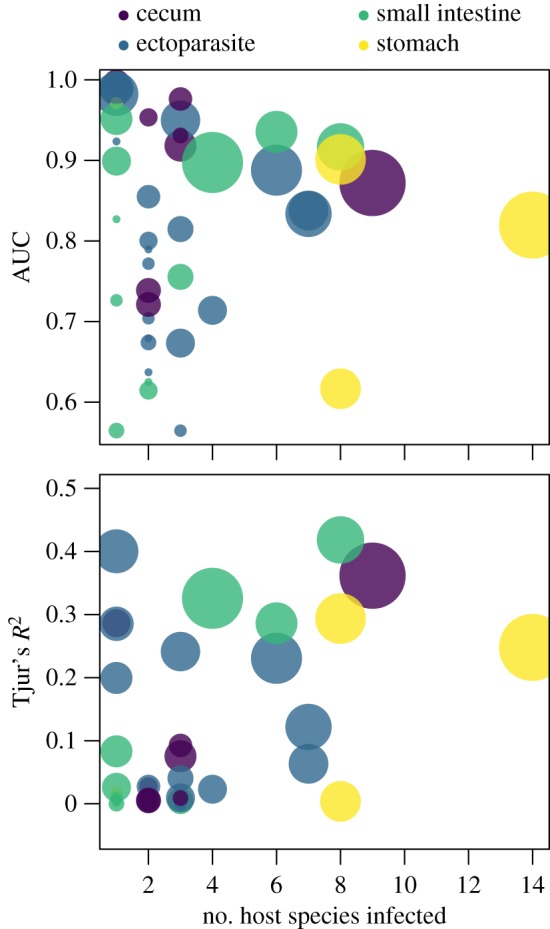
AUC and Tjur’s R2 as a function of the number of host species infected. These values are based on predictions from the fivefold cross-validated model. Each point represents a parasite species, and point size is proportional to the log number of individuals that each parasite species infects. Model performance appears to degrade when occurrence data is limited (smaller point size) and when the number of host species infected is small (host specificity increases). (Online version in colour.)
(c). Parasite–parasite associations as function of tissue infected
After controlling for host trait (i.e. host species and sex), parasite trait (i.e. host tissues infected) and geographical (i.e. site, season, year) differences, the residual variance–covariance matrix (Ω) captures the potential associations between parasite species. This matrix is standardized to a correlation matrix to ensure values are bounded between − 1 and 1. Parasite associations with substantial support tended to be much more sparse in the model considering the random effects of site, season, year and host species included relative to a model only considering host individual as a random effect (figures 4 and 5). The effect of the random effects becomes especially clear for the estimation of positive associations, where the model only incorporating an individual random effect estimated 116 positive parasite–parasite associations, while controlling for the effects of site, season, year and host species yielded an estimated 26 positive parasite–parasite associations. Meanwhile, numbers of negative associations were slightly more conserved between models, with the model incorporating random effects estimating 16 negative parasite–parasite associations compared with the 46 estimated when only considering the individual-level random effect (figure 4).
Figure 4.

Estimated parasite–parasite associations (90% support threshold) for (a) a model not incorporating random effects compared with (b) a model incorporating random effects. Parasite species are ordered based on the host tissue they predominantly infect, with coloured boxes indicating parasite–parasite associations when the same host tissue is infected (caecum in purple; ectoparasites in blue; small intestine in green; stomach in yellow). Pervasive positive associations detected in the model which does not consider geographical and host trait covariates suggests the importance of conditioning parasite associations on relevant covariates, suggesting simple correlational approaches are inappropriate for detecting parasite associations. (Online version in colour.)
Figure 5.

Mean parasite–parasite associations as a function of host tissue infected for both 75% (a) and 90% (b) posterior probability support. The majority of host tissue pairs had overall positive associations, suggestive of potentially facilitatory associations through correlated exposure or transmission, while parasite species coinfecting the stomach had strong negative interactions, suggesting a potential role for parasite competition in resource limited host tissues. Zero-valued associations were not considered when calculating the mean association strength. (Online version in colour.)
We also examined whether these associations varied as a function of which host tissue a parasite species was found to most commonly infect. We found generally positive associations, suggestive of potentially facilitatory relationships between coinfecting parasite species (figure 5). However, these relationships were generally weak. In an attempt to estimate potential parasite species which co-occur more (or less) often than expected, we used two posterior support thresholds (75% and 90%). Here, the 90% threshold is more conservative, but still provides evidence for some parasite associations (figure 5), and both thresholds suggested that parasite species infecting the same tissue may interact more negatively (figure 5).
4. Discussion
Even with a relatively small number of host trait covariates and coarse geographical information, joint species distribution models were able to leverage data on coinfecting parasite species to predict parasite communities at the individual host scale. This suggests that individual-scale infection patterns may be predictable even with limited data, and that predictive accuracy will likely only increase with more detailed life-history information of individual hosts (e.g. host body size, home range, etc.). The variation in the relative importance of geography and host traits suggests that shifts in host demography and habitat quality may differentially affect host–parasite relationships. On average, the most important variable in predicting parasite community composition among individual hosts was host species, suggesting that host specificity is important in predicting parasite community composition. By incorporating the effect of sampling site, season and year, we account for variation in potential spatial or temporal niche partitioning, which would result in a lack of parasite infection not as a function of host specificity, but simply as a result of limited encounter [52,53]. However, the importance of host species could relate to host species level variation in susceptibility, or be related to unmeasured host trait variation or co-evolutionary relationships between host and parasite species [12,54]. It also suggests that changes in host species relative abundance or community composition would be likely to change parasite community composition, potentially more so than climatic seasonality or habitat quality. After controlling for the effects of host traits and habitat variation, we found evidence that parasite species infecting the host stomach and cecum tended to be more negatively associated than parasite species infecting other host tissues. Together, we demonstrate the utility of joint species distribution models to understanding and predicting parasite communities of individual hosts, and identify how the strength and sign of parasite associations changes with parasite location on the host individual.
While joint species distribution models tended to perform best when more parasite occurrence records were available and the observed host range was small, model performance was not substantially reduced for generalist or rare species. This suggests that leveraging information on the resident parasite communities may provide insight into the distributions of these parasite species which are typically more difficult to predict (especially at the scale of the host individual). Apart from the prediction of parasite distributions, we examined parasite associations among coinfecting parasite species, finding evidence for both positive and negative associations, dependent on host tissue infected. That is, parasite associations tended to be slightly positive, suggestive of facilitatory associations, but parasite species coinfecting the stomach were strongly negatively associated. This suggests the possibility of parasite competition for space or resources, potentially modulated through the host immune response [4,55–57]. That is, different timing in infection may result in the infection by one parasite species resulting in increased host immune response, which may prevent the successful transmission of subsequent parasite species. For instance, helminth parasites may suppress host immune function [58], potentially promoting subsequent infections by other parasite species. Meanwhile the generally slightly positive associations suggest that correlated exposure (e.g. parasites are aggregated in the environment, so encounter of parasite species is not independent) or unmeasured host trait variation (e.g. host range size) may affect encounter and transmission of these parasite species [59,60]. While these parasite associations must be treated more as hypotheses than as certainties, we offer a novel way to examine parasite–parasite associations, an inherently difficult problem using cross-sectional observational data [44]. Relating parasite associations to differences in parasite traits, transmission modes, evolutionary relationships or host community overlap may provide insight into the processes that shape parasite communities within host individuals and species.
Parasite associations are typically examined in simple communities and through manipulative experiments [16,29,61]. That is, parasite infection is assessed, one parasite species is manipulated and then the resulting changes to the other parasite species is assessed [49,62]. Associated parasites would respond to the availability of host resources by increasing in abundance. While these experiments are incredibly important for understanding parasite associations in infected host individuals, the use of joint species distribution models provides additional evidence for parasite associations, and extends current approaches to understanding parasite associations [44] and the predictability of naturally formed parasite communities [7]. First, the approach does not require experimentation, and models can be used to identify potentially associated parasite species to provide a good starting point for experimental studies that would not be able to address the full complexity of these communities. Second, the approach can assess potential associations for entire parasite communities, which more closely resembles the reality of host–parasite associations, as host individuals are commonly infected by numerous parasitic species. Lastly, joint species distribution models do not only assess parasite associations, but gauge how host traits and geographical covariates relate to parasite occurrences, and predict parasite community composition. Previous studies have argued that correlational approaches are unable to estimate parasite associations [44]. We provide a putative explanation for this failure; parasite associations are conditional on covariates related to geography, season and host traits (figure 4). Assessing how parasite associations change across relevant ecological and trait gradients is possible using these approaches, while potentially intractable experimentally.
While host individuals are analogous to islands in some ways [33], there are several differences which make predicting parasite distributions and associations difficult, necessitating further experimentation and integration of manipulative experiments and computational approaches (e.g. joint species distribution models) [43]. For one, while some free-living species may modify the occupied habitat, parasitic species nearly universally alter the occupied habitat through the modulation of the host immune response [56,57]. This makes the order of parasite arrival important to subsequent coinfection dynamics [63,64], analogous to a priority effect commonly observed in free-living communities. While we have demonstrated parasite–parasite associations using presence–absence data, parasite–parasite associations are perhaps more likely to result not in reduced colonization, but in reduced abundance of parasites within infected host individuals (i.e. infection intensity). Applying similar techniques as used here to parasite infection intensity will further help elucidate how parasite associations influence parasite community composition (occurrence of parasite species) and structure (relative abundance of parasite species). The integration of manipulative experiments and computational approaches could provide model validation and a synthetic view of parasite associations in multi-parasite communities, identify key host traits promoting coinfection [65,66], and disentangle correlated coinfection from parasite associations [30].
Understanding what controls parasite species distributions among host individuals and species is a longstanding research area in disease ecology and parasitology [32]. More generally, the role of competition relative to environment and geographical space in structuring ecological communities is a long-standing ecological question [67]. We present the results of a modelling approach that allows for the prediction of parasite communities of host individuals [43], a scale which is controlled not only by host traits and geographical covariates, but by stochasticity in encounter and infection rates [31]. This stochasticity in encounter and infection rates has led researchers to claim that parasite assemblages are non-equilibrial and random [68]. The predictability we have observed at the level of host species [7] and host individual (figure 3) suggests that parasite communities may be predictable assemblages. With respect to host condition, negative associations between parasite species may reduce overall burden of parasite species through parasite competition, creating a testable hypothesis concerning the effects of parasite diversity on the cost of infection. Predictive models based on host traits and geographical covariates may provide insight into parasite spillover to humans or livestock [69,70] and changes in parasite infection with shifting land use or host trait distributions [71], and provide insight into the complex interactions between host and parasite species [1,72].
Supplementary Material
Acknowledgements
We sincerely thank all individuals associated with the Sevilleta Long Term Ecological Research effort, especially those associated with the collection and curation of the host–parasite data used here [47].
Data accessibility
Data and R code is available on figshare at https://doi.org/10.6084/m9.figshare.6865247. When using the Sevilleta host–parasite data, cite the original source [47].
Authors' contributions
T.A.D. designed the study. T.A.D. and O.O. performed the analyses. All authors contributed to manuscript writing.
Competing interests
We declare we have no competing interests.
Funding
The research was funded by the Academy of Finland (grant no. 273253 to O.O.) and the Research Council of Norway(SFF-III grant no. 223257). The Research Centre for Ecological Change is funded by the Jane and Aatos Erkko Foundation.
Reference
- 1.Dobson A. 2004. Population dynamics of pathogens with multiple host species. Am. Nat. 164, S64–S78. ( 10.1086/424681) [DOI] [PubMed] [Google Scholar]
- 2.Pedersen AB, Fenton A. 2007. Emphasizing the ecology in parasite community ecology. Trends Ecol. Evol. 22, 133–139. ( 10.1016/j.tree.2006.11.005) [DOI] [PubMed] [Google Scholar]
- 3.Lello J, Boag B, Fenton A, Stevenson IR, Hudson PJ. 2004. Competition and mutualism among the gut helminths of a mammalian host. Nature 428, 840–844. ( 10.1038/nature02490) [DOI] [PubMed] [Google Scholar]
- 4.Vaumourin E, Vourc’h G, Gasqui P, Vayssier-Taussat M. 2015. The importance of multiparasitism: examining the consequences of co-infections for human and animal health. Parasites Vectors 8, 545 ( 10.1186/s13071-015-1167-9) [DOI] [PMC free article] [PubMed] [Google Scholar]
- 5.Andrews JM. 1927. Host-parasite specificity in the coccidia of mammals. J. Parasitol. 13, 183–194. ( 10.2307/3271500) [DOI] [Google Scholar]
- 6.Clark NJ, Clegg SM. 2017. Integrating phylogenetic and ecological distances reveals new insights into parasite host specificity. Mol. Ecol. 26, 3074–3086. ( 10.1111/mec.2017.26.issue-11) [DOI] [PubMed] [Google Scholar]
- 7.Dallas T, Park AW, Drake JM. 2017. Predictability of helminth parasite host range using information on geography, host traits and parasite community structure. Parasitology 144, 200–205. ( 10.1017/S0031182016001608) [DOI] [PubMed] [Google Scholar]
- 8.Adamson M, Caira J. 1994. Evolutionary factors influencing the nature of parasite specificity. Parasitology 109, S85–S95. ( 10.1017/S0031182000085103) [DOI] [PubMed] [Google Scholar]
- 9.Poulin R, Krasnov BR, Morand S. 2006. Patterns of host specificity in parasites exploiting small mammals. In Micromammals and macroparasites (eds Morand S, Krasnov BR, Poulin R), pp. 233–256. Berlin, Germany: Springer. [Google Scholar]
- 10.Little TJ, Watt K, Ebert D. 2006. Parasite-host specificity: experimental studies on the basis of parasite adaptation. Evolution 60, 31–38. ( 10.1111/evo.2006.60.issue-1) [DOI] [PubMed] [Google Scholar]
- 11.Poulin R. 2011. Evolutionary ecology of parasites. Princeton, NJ: Princeton University Press. [Google Scholar]
- 12.Park A. et al 2018. Characterizing the phylogenetic specialism–generalism spectrum of mammal parasites. Proc. R. Soc. B 285, 20172613 ( 10.1098/rspb.2017.2613) [DOI] [PMC free article] [PubMed] [Google Scholar]
- 13.Pilosof S, Morand S, Krasnov BR, Nunn CL. 2015. Potential parasite transmission in multi-host networks based on parasite sharing. PLoS ONE 10, e0117909 ( 10.1371/journal.pone.0117909) [DOI] [PMC free article] [PubMed] [Google Scholar]
- 14.Griffiths EC, Pedersen AB, Fenton A, Petchey OL. 2011. The nature and consequences of coinfection in humans. J. Inf. 63, 200–206. ( 10.1016/j.jinf.2011.06.005) [DOI] [PMC free article] [PubMed] [Google Scholar]
- 15.Shaw D, Dobson A. 1995. Patterns of macroparasite abundance and aggregation in wildlife populations: a quantitative review. Parasitology 111, S111–S133. ( 10.1017/S0031182000075855) [DOI] [PubMed] [Google Scholar]
- 16.Lello J, McClure SJ, Tyrrell K, Viney ME. 2018. Predicting the effects of parasite co-infection across species boundaries. Proc. R. Soc. B 285, 20172610 ( 10.1098/rspb.2017.2610) [DOI] [PMC free article] [PubMed] [Google Scholar]
- 17.Ramiro RS, Pollitt LC, Mideo N, Reece SE. 2016. Facilitation through altered resource availability in a mixed-species rodent malaria infection. Ecol. Lett. 19, 1041–1050. ( 10.1111/ele.12639) [DOI] [PMC free article] [PubMed] [Google Scholar]
- 18.Johnson PT, Hoverman JT. 2012. Parasite diversity and coinfection determine pathogen infection success and host fitness. Proc. Natl Acad. Sci. USA 109, 9006–9011. ( 10.1073/pnas.1201790109) [DOI] [PMC free article] [PubMed] [Google Scholar]
- 19.Griffiths EC, Fairlie-Clarke K, Allen JE, Metcalf CJE, Graham AL. 2015. Bottom-up regulation of malaria population dynamics in mice co-infected with lung-migratory nematodes. Ecol. Lett. 18, 1387–1396. ( 10.1111/ele.12534) [DOI] [PubMed] [Google Scholar]
- 20.Karvonen A, Rellstab C, Louhi K-R, Jokela J. 2011. Synchronous attack is advantageous: mixed genotype infections lead to higher infection success in trematode parasites. Proc. R. Soc. B 279, 171–176. ( 10.1098/rspb.2011.0879) [DOI] [PMC free article] [PubMed] [Google Scholar]
- 21.Graham AL. 2008. Ecological rules governing helminth–microparasite coinfection. Proc. Natl Acad. Sci USA 105, 566–570. ( 10.1073/pnas.0707221105) [DOI] [PMC free article] [PubMed] [Google Scholar]
- 22.Porrozzi R, Teva A, Amaral VF, DA COSTA MVS, Grimaldi G Jr. 2004. Cross-immunity experiments between different species or strains of leishmania in rhesus macaques (Macaca mulatta). Am. J. Trop. Med. Hyg. 71, 297–305. ( 10.4269/ajtmh.2004.71.297) [DOI] [PubMed] [Google Scholar]
- 23.Alizon S, de Roode JC, Michalakis Y. 2013. Multiple infections and the evolution of virulence. Ecol. Lett. 16, 556–567. ( 10.1111/ele.12076) [DOI] [PubMed] [Google Scholar]
- 24.Choisy M, de Roode JC. 2010. Mixed infections and the evolution of virulence: effects of resource competition, parasite plasticity, and impaired host immunity. Am. Nat. 175, E105–E118. ( 10.1086/651587) [DOI] [PubMed] [Google Scholar]
- 25.de Roode JC. et al 2005. Virulence and competitive ability in genetically diverse malaria infections. Proc. Natl Acad. Sci. USA 102, 7624–7628. ( 10.1073/pnas.0500078102) [DOI] [PMC free article] [PubMed] [Google Scholar]
- 26.Grear DA, Luong LT, Hudson PJ. 2013. Network transmission inference: host behavior and parasite life cycle make social networks meaningful in disease ecology. Ecol. Appl. 23, 1906–1914. ( 10.1890/13-0907.1) [DOI] [PubMed] [Google Scholar]
- 27.Smith NF. 2001. Spatial heterogeneity in recruitment of larval trematodes to snail intermediate hosts. Oecologia 127, 115–122. ( 10.1007/s004420000560) [DOI] [PubMed] [Google Scholar]
- 28.Johnson PT, Rohr JR, Hoverman JT, Kellermanns E, Bowerman J, Lunde KB. 2012. Living fast and dying of infection: host life history drives interspecific variation in infection and disease risk. Ecol. Lett. 15, 235–242. ( 10.1111/ele.2012.15.issue-3) [DOI] [PubMed] [Google Scholar]
- 29.Pedersen AB, Antonovics J. 2013. Anthelmintic treatment alters the parasite community in a wild mouse host. Biol. Lett. 9, 20130205 ( 10.1098/rsbl.2013.0205) [DOI] [PMC free article] [PubMed] [Google Scholar]
- 30.Johnson PT, Buller ID. 2011. Parasite competition hidden by correlated coinfection: using surveys and experiments to understand parasite interactions. Ecology 92, 535–541. ( 10.1890/10-0570.1) [DOI] [PubMed] [Google Scholar]
- 31.Telfer S, Lambin X, Birtles R, Beldomenico P, Burthe S, Paterson S, Begon M. 2010. Species interactions in a parasite community drive infection risk in a wildlife population. Science 330, 243–246. ( 10.1126/science.1190333) [DOI] [PMC free article] [PubMed] [Google Scholar]
- 32.Johnson PT, De Roode JC, Fenton A. 2015. Why infectious disease research needs community ecology. Science 349, 1259504 ( 10.1126/science.1259504) [DOI] [PMC free article] [PubMed] [Google Scholar]
- 33.Kuris AM, Blaustein AR, Alio JJ. 1980. Hosts as islands. Am. Nat. 116, 570–586. ( 10.1086/283647) [DOI] [Google Scholar]
- 34.Dobson A. 1985. The population dynamics of competition between parasites. Parasitology 91, 317–347. ( 10.1017/S0031182000057401) [DOI] [PubMed] [Google Scholar]
- 35.Burns JH, Strauss SY. 2011. More closely related species are more ecologically similar in an experimental test. Proc. Natl Acad. Sci. USA 108, 5302–5307. ( 10.1073/pnas.1013003108) [DOI] [PMC free article] [PubMed] [Google Scholar]
- 36.Wiens JJ. 2011. The niche, biogeography and species interactions. Phil. Trans. R. Soc. B 366, 2336–2350. ( 10.1098/rstb.2011.0059) [DOI] [PMC free article] [PubMed] [Google Scholar]
- 37.Hairston NG, Smith FE, Slobodkin LB. 1960. Community structure, population control, and competition. Am. Nat. 94, 421–425. ( 10.1086/282146) [DOI] [Google Scholar]
- 38.Tilman D. 1982. Resource competition and community structure, vol. 17 Princeton, NJ: Princeton University Press. [PubMed] [Google Scholar]
- 39.Chesson P. 2000. Mechanisms of maintenance of species diversity. Annu. Rev. Ecol. Syst. 31, 343–366. ( 10.1146/annurev.ecolsys.31.1.343) [DOI] [Google Scholar]
- 40.Jolles AE, Ezenwa VO, Etienne RS, Turner WC, Olff H. 2008. Interactions between macroparasites and microparasites drive infection patterns in free-ranging african buffalo. Ecology 89, 2239–2250. ( 10.1890/07-0995.1) [DOI] [PubMed] [Google Scholar]
- 41.Cox F. 2001. Concomitant infections, parasites and immune responses. Parasitology 122, S23–S38. ( 10.1017/S003118200001698X) [DOI] [PubMed] [Google Scholar]
- 42.Norberg A. et al 2019. A comprehensive evaluation of predictive performance of 33 species distribution models at species and community levels. Ecol. Monogr. 89, e01370 ( 10.1002/ecm.1370) [DOI] [Google Scholar]
- 43.Aivelo T, Norberg A. 2018. Parasite–microbiota interactions potentially affect intestinal communities in wild mammals. J. Anim. Ecol. 87, 438–447. ( 10.1111/1365-2656.12708) [DOI] [PubMed] [Google Scholar]
- 44.Fenton A, Knowles SC, Petchey OL, Pedersen AB. 2014. The reliability of observational approaches for detecting interspecific parasite interactions: comparison with experimental results. Int. J. Parasitol. 44, 437–445. ( 10.1016/j.ijpara.2014.03.001) [DOI] [PubMed] [Google Scholar]
- 45.Carlson CJ. et al 2017. Parasite biodiversity faces extinction and redistribution in a changing climate. Sci. Adv. 3, e1602422 ( 10.1126/sciadv.1602422) [DOI] [PMC free article] [PubMed] [Google Scholar]
- 46.Phillips BL, Kelehear C, Pizzatto L, Brown GP, Barton D, Shine R. 2010. Parasites and pathogens lag behind their host during periods of host range advance. Ecology 91, 872–881. ( 10.1890/09-0530.1) [DOI] [PubMed] [Google Scholar]
- 47.Duszyinski D. 2010. Rodent parasite data for the Sevilleta National Wildlife Refuge, New Mexico (1990–1998). Long Term Ecological Research Network ( 10.6073/pasta/b739d2c75e142f5742b7bfe74c97d5c1). [DOI]
- 48.Duszynski DW, Wilber PG. 1997. A guideline for the preparation of species descriptions in the Eimeriidae. J. Parasitol. 83, 333–336. ( 10.2307/3284470) [DOI] [PubMed] [Google Scholar]
- 49.Knowles SC, Fenton A, Petchey OL, Jones TR, Barber R, Pedersen AB. 2013. Stability of within-host–parasite communities in a wild mammal system. Proc. R. Soc. B 280, 20130598 ( 10.1098/rspb.2013.0598) [DOI] [PMC free article] [PubMed] [Google Scholar]
- 50.Warton DI, Blanchet FG, O’Hara RB, Ovaskainen O, Taskinen S, Walker SC, Hui FK. 2015. So many variables: joint modeling in community ecology. Trends Ecol. Evol. 30, 766–779. ( 10.1016/j.tree.2015.09.007) [DOI] [PubMed] [Google Scholar]
- 51.Ovaskainen O, Tikhonov G, Norberg A, Guillaume Blanchet F, Duan L, Dunson D, Roslin T, Abrego N. 2017. How to make more out of community data? A conceptual framework and its implementation as models and software. Ecol. Lett. 20, 561–576. ( 10.1111/ele.12757) [DOI] [PubMed] [Google Scholar]
- 52.Agosta SJ, Janz N, Brooks DR. 2010. How specialists can be generalists: resolving the ‘parasite paradox’ and implications for emerging infectious disease. Zoologia 27, 151–162. ( 10.1590/S1984-46702010000200001) [DOI] [Google Scholar]
- 53.Hoberg EP, Brooks DR. 2008. A macroevolutionary mosaic: episodic host-switching, geographical colonization and diversification in complex host–parasite systems. J. Biogeogr. 35, 1533–1550. ( 10.1111/jbi.2008.35.issue-9) [DOI] [Google Scholar]
- 54.Gandon S, Buckling A, Decaestecker E, Day T. 2008. Host–parasite coevolution and patterns of adaptation across time and space. J. Evol. Biol. 21, 1861–1866. ( 10.1111/jeb.2008.21.issue-6) [DOI] [PubMed] [Google Scholar]
- 55.Ulrich Y, Schmid-Hempel P. 2012. Host modulation of parasite competition in multiple infections. Proc. R. Soc. B 279, 20120474 ( 10.1098/rspb.2012.0474) [DOI] [PMC free article] [PubMed] [Google Scholar]
- 56.Ezenwa VO, Etienne RS, Luikart G, Beja-Pereira A, Jolles AE. 2010. Hidden consequences of living in a wormy world: nematode-induced immune suppression facilitates tuberculosis invasion in african buffalo. Am. Nat. 176, 613–624. ( 10.1086/656496) [DOI] [PubMed] [Google Scholar]
- 57.Beechler BR, Jolles AE, Budischak SA, Corstjens PL, Ezenwa VO, Smith M, Spaan RS, van Dam GJ, Steinauer ML. 2017. Host immunity, nutrition and coinfection alter longitudinal infection patterns of schistosomes in a free ranging african buffalo population. PLoS Negl. Trop. Dis. 11, e0006122 ( 10.1371/journal.pntd.0006122) [DOI] [PMC free article] [PubMed] [Google Scholar]
- 58.Maizels RM, Balic A, Gomez-Escobar N, Nair M, Taylor MD, Allen JE. 2004. Helminth parasites–masters of regulation. Immunol. Rev. 201, 89–116. ( 10.1111/imr.2004.201.issue-1) [DOI] [PubMed] [Google Scholar]
- 59.Krasnov BR, Poulin R, Morand S. 2006. Patterns of macroparasite diversity in small mammals. In Micromammals and macroparasites (eds Morand S, Krasnov BR, Poulin R), pp. 197–231. Berlin, Germany: Springer. [Google Scholar]
- 60.Poulin R. 2013. Explaining variability in parasite aggregation levels among host samples. Parasitology 140, 541–546. ( 10.1017/S0031182012002053) [DOI] [PubMed] [Google Scholar]
- 61.Holland C. 1984. Interactions between Moniliformis (Acanthocephala) and Hippostrongylus (Nematoda) in the small intestine of laboratory rats. Parasitology 88, 303–315. ( 10.1017/S003118200005455X) [DOI] [PubMed] [Google Scholar]
- 62.Pedersen AB, Fenton A. 2015. The role of antiparasite treatment experiments in assessing the impact of parasites on wildlife. Trends Parasitol. 31, 200–211. ( 10.1016/j.pt.2015.02.004) [DOI] [PubMed] [Google Scholar]
- 63.Hoverman JT, Hoye BJ, Johnson PT. 2013. Does timing matter? How priority effects influence the outcome of parasite interactions within hosts. Oecologia 173, 1471–1480. ( 10.1007/s00442-013-2692-x) [DOI] [PubMed] [Google Scholar]
- 64.Klemme I, Louhi K-R, Karvonen A. 2016. Host infection history modifies co-infection success of multiple parasite genotypes. J. Anim. Ecol. 85, 591–597. ( 10.1111/1365-2656.12472) [DOI] [PubMed] [Google Scholar]
- 65.Clark NJ, Wells K, Dimitrov D, Clegg SM. 2016. Co-infections and environmental conditions drive the distributions of blood parasites in wild birds. J. Anim. Ecol. 85, 1461–1470. ( 10.1111/1365-2656.12578) [DOI] [PubMed] [Google Scholar]
- 66.Lange B, Reuter M, Ebert D, Muylaert K, Decaestecker E. 2014. Diet quality determines interspecific parasite interactions in host populations. Ecol. Evol. 4, 3093–3102. ( 10.1002/ece3.2014.4.issue-15) [DOI] [PMC free article] [PubMed] [Google Scholar]
- 67.Connell JH. 1983. On the prevalence and relative importance of interspecific competition: evidence from field experiments. Am. Nat. 122, 661–696. ( 10.1086/284165) [DOI] [Google Scholar]
- 68.Kennedy C. 2009. The ecology of parasites of freshwater fishes: the search for patterns. Parasitology 136, 1653–1662. ( 10.1017/S0031182009005794) [DOI] [PubMed] [Google Scholar]
- 69.Han BA, Schmidt JP, Bowden SE, Drake JM. 2015. Rodent reservoirs of future zoonotic diseases. Proc. Natl Acad. Sci. USA 112, 7039–7044. ( 10.1073/pnas.1501598112) [DOI] [PMC free article] [PubMed] [Google Scholar]
- 70.Olival KJ, Hosseini PR, Zambrana-Torrelio C, Ross N, Bogich TL, Daszak P. 2017. Host and viral traits predict zoonotic spillover from mammals. Nature 546, 646–650. ( 10.1038/nature22975) [DOI] [PMC free article] [PubMed] [Google Scholar]
- 71.Patz JA, Olson SH, Uejio CK, Gibbs HK. 2008. Disease emergence from global climate and land use change. Med. Clin. 92, 1473–1491. ( 10.1016/j.mcna.2008.07.007) [DOI] [PubMed] [Google Scholar]
- 72.Holt RD, Dobson AP, Begon M, Bowers RG, Schauber EM. 2003. Parasite establishment in host communities. Ecol. Lett. 6, 837–842. ( 10.1046/j.1461-0248.2003.00501.x) [DOI] [Google Scholar]
Associated Data
This section collects any data citations, data availability statements, or supplementary materials included in this article.
Data Citations
- Duszyinski D. 2010. Rodent parasite data for the Sevilleta National Wildlife Refuge, New Mexico (1990–1998). Long Term Ecological Research Network ( 10.6073/pasta/b739d2c75e142f5742b7bfe74c97d5c1). [DOI]
Supplementary Materials
Data Availability Statement
Data and R code is available on figshare at https://doi.org/10.6084/m9.figshare.6865247. When using the Sevilleta host–parasite data, cite the original source [47].