

Abstract
Visual information conveyed by iconic hand gestures and visible speech can enhance speech comprehension under adverse listening conditions for both native and non‐native listeners. However, how a listener allocates visual attention to these articulators during speech comprehension is unknown. We used eye‐tracking to investigate whether and how native and highly proficient non‐native listeners of Dutch allocated overt eye gaze to visible speech and gestures during clear and degraded speech comprehension. Participants watched video clips of an actress uttering a clear or degraded (6‐band noise‐vocoded) action verb while performing a gesture or not, and were asked to indicate the word they heard in a cued‐recall task. Gestural enhancement was the largest (i.e., a relative reduction in reaction time cost) when speech was degraded for all listeners, but it was stronger for native listeners. Both native and non‐native listeners mostly gazed at the face during comprehension, but non‐native listeners gazed more often at gestures than native listeners. However, only native but not non‐native listeners' gaze allocation to gestures predicted gestural benefit during degraded speech comprehension. We conclude that non‐native listeners might gaze at gesture more as it might be more challenging for non‐native listeners to resolve the degraded auditory cues and couple those cues to phonological information that is conveyed by visible speech. This diminished phonological knowledge might hinder the use of semantic information that is conveyed by gestures for non‐native compared to native listeners. Our results demonstrate that the degree of language experience impacts overt visual attention to visual articulators, resulting in different visual benefits for native versus non‐native listeners.
Keywords: Speech comprehension, Gesture, Semantic integration, Degraded speech, Non‐native, Eye‐tracking, Visual attention, Multimodal
1. Introduction
In everyday conversational contexts, we often communicate in challenging or adverse listening conditions. These listener‐related challenges can emerge because of external factors, such as noise (Peelle, 2018), but also because of internal factors, such as when communicating in a non‐native language (Lecumberri, Cooke, & Cutler, 2010). Everyday conversational contexts are often multimodal and can include auditory inputs, such as speech, but also visual input, such as visible speech and gestures. These visual inputs can aid challenges that listeners face during speech comprehension. Visible speech, which consists of movements of tongue, teeth and lip movements, has been shown to enhance clear and degraded speech comprehension for both native and non‐native listeners (Erber, 1975; Munhall, 1998; Navarra & Soto‐Faraco, 2007; Ross, Saint‐Amour, Leavitt, Javitt, & Foxe, 2006; Sumby & Pollock, 1954), as it can provide phonological information about the speech signal that can enhance comprehension. Next to visible speech, iconic hand gestures, which can convey semantic information about object attributes, actions, and space (McNeill, 1992), can also enhance clear and degraded speech comprehension (Drijvers, Özyürek, & Jensen, 2018; Holle, Obleser, Rueschemeyer, & Gunter, 2010), especially in a joint context with visible speech (Drijvers & Özyürek, 2017), and for both native and non‐native speakers (Drijvers & Özyürek, 2019; Drijvers, van der Plas, Özyürek, & Jensen, 2019). However, little is known about how native and non‐native listeners allocate their visual attention to benefit from these inputs during speech comprehension in a joint context, especially in adverse listening conditions, such as when speech is degraded.
Understanding speech in the presence of noise has been demonstrated to be more difficult for non‐native than for native listeners (Bradlow & Alexander, 2007; Brouwer, Van Engen, Calandruccio, & Bradlow, 2012; Kilman, Zekveld, Hällgren, & Rönnberg, 2014; Mayo, Florentine, & Buus, 1997; Scharenborg, Coumans, & van Hout, 2018; Scharenborg & van Os, 2019), even when non‐native listeners are highly proficient (Cutler, Garcia Lecumberri, & Cooke, 2008). As noise decreases the available acoustic information in the speech signal, it might be more difficult for non‐native listeners to make a phonological mapping between the speech signal and perceptual/linguistic representations, as these might have not been fully tuned to the non‐native language (Flege, 1992; Iverson et al., 2003; Lecumberri et al., 2010). Specifically in such situations, visual phonological information that is conveyed by visible speech has been shown to enhance non‐native language learning and comprehension (Hannah et al., 2017; Jongman, Wang, & Kim, 2003; Kawase, Hannah, & Wang, 2014; Kim, Sonic, & Davis, 2011; Wang, Behne, & Jiang, 2008). In native listeners, it has been suggested that visual attention is more often directed to the mouth of a talker to extract more information from visible speech when speech is degraded (Buchan, Paré, & Munhall, 2007; Król, 2018; Munhall, 1998; Rennig, Wegner‐Clemens, & Beauchamp, 2018). However, it has not been studied how non‐native listeners might allocate their visual attention to benefit from visible speech information in adverse listening conditions.
Visible speech is not the only visual information source that can aid comprehension. Listeners often perceive visual input that not only consists of visible speech, but also iconic hand gestures, which can convey semantic information about the speech signal. Previous work has demonstrated that listeners integrate this semantic information with speech (Kelly, Creigh, & Bartolotti, 2010) and that both native and non‐native listeners can benefit from semantic information that is conveyed by gestures (Dahl & Ludvigsen, 2014; Sueyoshi & Hardison, 2005), especially when speech is degraded (Drijvers & Özyürek, 2017, 2018, 2019; Drijvers et al., 2018, 2019).
To date, there is no work that investigated whether listeners allocate overt visual attention to gestures when speech is degraded to aid comprehension. In clear speech, native speakers tend to fixate on the speaker's face during multimodal language comprehension for 90–95% of the time (Argyle & Cook, 1976; Argyle & Graham, 1976; Gullberg & Kita, 2009), and therefore tend not to gaze to gestures (Gullberg & Holmqvist, 1999, 2002, 2006; Gullberg & Kita, 2009), except when speakers look at their own gestures (Gullberg & Holmqvist, 2006), a gesture is produced in the periphery of gesture space (McNeill, 1992), or when a gesture moves into a hold before moving on (Gullberg & Kita, 2009). Although gestures thus convey meaningful information, listeners seem to be able to abstract this information without directly fixating on them (Gullberg & Kita, 2009), which is in line with findings from the sign language domain, where signers fixate on the face more than other visual cues, such as the hands (Agrafiotis, Canagarajah, Bull, & Dye, 2003; Emmorey, Thompson, & Colvin, 2009; Muir & Richardson, 2005).
However, this could be different for non‐native listeners, especially when they try to understand degraded speech. As non‐native listeners are more hindered by noise compared to native listeners (Bradlow & Alexander, 2007; Mayo et al., 1997), they might rely more strongly on visual semantic information conveyed by gestures. However, previous work has demonstrated that non‐native listeners can only benefit from visual semantic information by gestures when there are enough reliable auditory cues to map the semantic information from the gesture to (Drijvers & Özyürek, 2018, 2019). For example, previous EEG work suggested that non‐native listeners might focus more on gestures when speech is clear than native listeners (Drijvers & Özyürek, 2018). In this study, we investigated modulations of the N400 component during speech‐gesture integration in clear and degraded speech, in a native and non‐native listener group by using a violation paradigm where gestures either matched or mismatched the speech signal. The N400 component is thought to be sensitive to semantic unification operations (Kutas & Federmeier, 2014). We observed an N400 effect when comparing mismatching to matching gestures in both clear and degraded speech for native listeners. However, we only observed an N400 effect in clear speech for non‐native listeners, but not in degraded speech. This N400 effect in clear speech was larger for non‐native listeners than native listeners, which might indicate that they focus more strongly on gestures than native listeners, to extract semantic information to aid comprehension. Similarly, previous neuroimaging work has indicated that both native and non‐native listeners engage their visual cortex more when speech is degraded and a gesture is present than when speech is clear or no gesture is present, possibly to allocate more visual attention to gestures and increase information uptake (Drijvers et al., 2018, 2019). Non‐native listeners, however, engage areas involved in semantic retrieval and semantic unification, and visible speech processing less than native listeners during gestural enhancement of degraded speech, suggesting that non‐native listeners might be hindered in integrating the degraded phonological cues with the semantic information conveyed by the gesture. So far, it is unknown if this is in any way reflected in the overt visual attention that listeners allocate to visible speech or to gestures, and if overt visual attention to gestures correlates with an enhancement in speech comprehension. Listeners might, for example, more overtly gaze at gestures when speech is degraded to try to benefit from the semantic information that a gesture conveys, especially when peripheral processing might not be sufficient to aid degraded speech comprehension.
1.1. The present study
This study investigates how native and non‐native listeners allocate visual attention to visible speech and gestures in clear and degraded speech. More specifically, we aim to gain insight into whether allocating gaze towards gestures when speech is degraded can predict how much a listener benefits from gestural information during comprehension, and whether and how this may differ for native compared to non‐native listeners. To investigate this, we used eye‐tracking to record eye movements with a high temporal resolution. Eye‐tracking provides an excellent method to study how signal degradation affects online processes of native and non‐native word comprehension (e.g., Brouwer & Bradlow, 2016; McQueen & Huettig, 2012; see for a review: Van Engen & McLaughlin, 2018), and to study how allocating attention is reflected in gaze behavior (Posner, 2016).
To investigate these questions, we presented native and highly proficient non‐native participants with videos in which an actress uttered a verb in clear or degraded speech, and while making a gesture or not. We chose to only include highly proficient non‐native participants, as less proficient participants might not be able to understand the verbs. All participants completed a behavioral cued‐recall task after each item that asked which verb they had heard in the videos. We were interested in their accuracy results and reaction times, as well as gaze allocation to the face, the mouth, and the body during clear and degraded speech comprehension, as measured by the proportion of fixations to these areas of interest.
1.1.1. Behavioral hypotheses
On the behavioral‐cued recall task, we expected that both listener groups would benefit more from gestures when speech is degraded than when speech is clear. We predicted that this benefit would be larger for native listeners than for non‐native listeners (Drijvers & Özyürek, 2019). This would then be reflected by a higher accuracy level and faster reaction times, as well as a larger gestural enhancement effect during degraded speech comprehension. This gestural enhancement effect reflects an enhancement of recall accuracy under adverse as compared to clear listening conditions when a gesture is present as compared to not present, and a larger reduction of reaction time cost when comparing gesture to no‐gesture trials in degraded speech as compared to clear speech.
1.1.2. Eye‐tracking hypotheses—Face and mouth
In the eye‐tracking results, we expected that within the two listener groups, both native and non‐native listeners would look more at the face and mouth when speech was degraded than when speech was clear, irrespective of whether a gesture was present or not (Buchan et al., 2007; Król, 2018; Munhall, 1998; Rennig et al., 2018).
However, previous literature suggested that non‐native speakers might have difficulties in resolving phonological information in the speech signal when speech is degraded (Cutler, Weber, Smits, & Cooper, 2004; Krizman, Bradlow, Lam, & Kraus, 2016) and are aided by extra visual information to resolve the degraded phonological input (Hazan et al., 2006). We therefore expected that when comparing the two groups, non‐native listeners would look more to the face and mouth than native listeners, especially when speech was degraded. However, in the presence of gesture, non‐native listeners' gaze allocation to visible speech might be less pronounced, as will be outlined below.
1.1.3. Eye‐tracking hypotheses—Gesture
We had similar expectations for gaze allocation to gesture. Although previous literature suggested that listeners do not often gaze overtly to gesture in natural communication, as they are able to extract visual semantic information peripherally (Gullberg & Holmqvist, 1999, 2002, 2006; Gullberg & Kita, 2009), we did expect that within the two listener groups both native and non‐native listeners gaze more overtly at gestures when speech was degraded than when speech was clear. This would be in line with previous research that suggested that more visual attention is allocated to gestures to increase the uptake of gestural information when speech is degraded (Drijvers et al., 2018, 2019).
When comparing the two groups, we expected that non‐native listeners would gaze more at gestures than native listeners in both clear and degraded speech. As non‐native listeners might find it difficult to couple the phonological information conveyed by visible speech to the speech signal, they might try to increase their visual semantic information uptake to aid comprehension. This might also result in sustained visual attention to gestures, especially when the phonological information conveyed by visible speech is difficult to resolve. We explored this option by using cluster‐based permutation tests to analyze the exact moment when gaze allocation patterns might diverge within and between groups during comprehension, which is not possible by using conventional eye‐tracking analysis methods.
Finally, we were interested in whether gaze allocation to gestures could predict the gestural enhancement the listeners experienced during comprehension. We expected that gaze allocation to gestures during degraded speech comprehension would predict the benefit a listener experiences from the gesture during the cued–recall task in both groups.
2. Methods
2.1. Participants
Twenty Dutch participants (M age = 26.0, SD = 7.58) and twenty‐one German advanced learners of Dutch (M age = 23.05, SD = 2.62) with no neurological, language, hearing, or motor disorders participated in the experiment. All participants were right‐handed and obtained education at a University level.
The non‐native German advanced learners of Dutch were recruited on the basis of the following inclusion criteria: (a) having lived/studied in the Netherlands for at least a year, (b) having used Dutch for at least once a week, (c) acquired Dutch after age 12. On average, the German participants acquired Dutch between 12 and 22 years (M age = 18.25, SD = 2.8) as part of their preparation for a Dutch educational program. One of the German participants had to be excluded because the inclusion criteria were not met. All participants gave informed written consent before participating and received a financial compensation for participation.
2.2. LexTALE assessment
We used the Dutch version of the Lexical Test for Advanced Learners of English (LexTALE), a non‐speeded visual lexical decision test (Lemhöfer & Broersma, 2012), to ensure our German participants were indeed highly proficient in Dutch. In this test, participants were presented with 40 Dutch words and 20 non‐words. The non‐words are formed by either changing letters in an existing words, or a recombination of existing morphemes, and the task for participants was to note down whether a word was an existing word in Dutch or not. Participants had to score above 60% in on the LexTALE test to participate in the experiment. A score of 60% and higher is predicted to correlate with an upper intermediate level (B2 level or higher). Native listeners were asked to also fill out the LexTALE test as a control. After the main experiment, we administered an adapted version of the LexTALE test (LexTALE 2), which contained 40 verbs that were used in the experiment to ensure that participants were familiar with them, and 20 non‐words that were created in a similar manner as the non‐words in the first LexTALE test. When a participant gave a wrong answer to one of these items, this item was excluded from later analyses.
2.3. Stimulus materials
The stimuli that were used in this experiment were the same stimuli as described in Drijvers et al. (2018). Participants were presented with 160 video clips in which a non‐professional actress uttered a highly frequent Dutch action verbs in clear or degraded speech, while she performed an iconic gesture or not. The actress in the video was always visible from her knees up, in front of a neutrally colored background, and wearing neutrally colored clothing. Previous work confirmed that both native and non‐native listeners were familiar with the verbs that were used (see e.g., Drijvers & Özyürek, 2017, 2018), and in every video a different verb was used.
All videos were 2 s long. In the videos that contained a gesture, gesture preparation (i.e., the first frame in which the actress moved her hand up) started 120 ms (SD = 0) after video onset (see for video structure Fig. 1). On average, the stroke of the gesture started at 550 ms (SD = 74.4 ms), followed by gesture retraction at 1,380 ms (SD = 109.6 ms), and gesture offset at 1,780 ms. (SD = 150.1 ms). Speech onset on average started at 680 ms (SD = 112.5 ms), which maximized the overlap between the stroke and gesture segment so that the iconic gesture and speech could benefit mutual comprehension (see Habets, Kita, Shao, Özyürek, & Hagoort, 2011).
Figure 1.
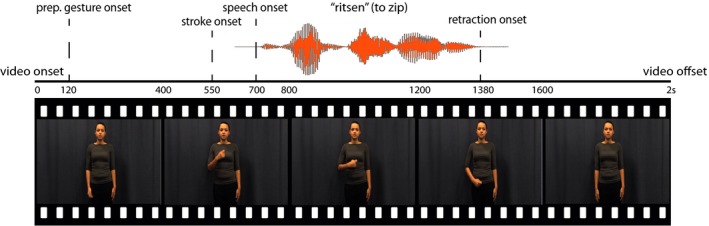
Schematic overview of video file. Videos were 2,000 ms long. Preparation of a gesture started at 120 ms, stroke at 550 ms, speech at 680 ms, retraction onset was at 1,380 ms, and gesture offset was at 1,780 ms.
All the gestures that were used were iconic, but were potentially ambiguous without speech, as they are in the case of naturally occurring co‐speech gestures (Krauss et al., 1991). In a pretest that was conducted as part of Drijvers and Özyürek (2017), we presented participants with the gesture videos without any sound. We asked participants to write down which verb they thought was depicted in the video, and then presented them with the verb we associated with the gesture in the video and asked them to indicate on a 7‐point scale how iconic they found that verb of the gesture in the video. Iconic gestures that did not reach 5 points on this scale were discarded. Overall, our gestures had a mean recognition rate of 59%, which indicates that they are potentially ambiguous in the absence of speech (e.g., a “rowing”—gesture that could fit with the verbs “sweeping” or “rowing,” and thus needs speech to be disambiguated).
The sound files that were played in the videos were extracted, intensity‐scaled to 70 dB, denoised in Praat (Boersma & Weenink, 2019), and then recombined with their corresponding video files. All sound files were cleaned, and from these clean versions, a 6‐band noise‐vocoded version was created using a custom script in Praat. Noise‐vocoding degrades the spectral content of the audio file (Shannon, Zeng, Kamath, Wygonski, & Ekelid, 1995), while the temporal envelope of the sound preservers. This causes the sound to still be intelligible to some extent, with more bands being present in the signal, the more intelligible the signal becomes (e.g., 6‐band noise‐vocoding is more intelligible than 2‐band noise‐vocoding). For both native and non‐native listeners, 6‐band noise‐vocoding is the noise‐vocoding level where listeners benefit most from the semantic information that is conveyed by the gesture. Therefore, we used 6‐band noise‐vocoding as the degradation level for the current experiment.
We included four conditions in our experiment, divided over 2 within‐subject factors (Noise‐vocoding (degraded/clear) and Gesture (present/absent): clear speech + no gesture (CO), degraded speech + no gesture (DO), clear speech + gesture (CGCG), degraded speech + gesture (DG). The differences between these conditions were assessed between the two listener groups; native and non‐native listeners. We were particularly interested in the “gestural enhancement effect,” which can be calculated by taking the interaction between Noise‐vocoding (present/absent) and Gesture (present/absent), for both accuracy and reaction times. For accuracy, the gestural enhancement effect reflects an enhancement of recall accuracy in degraded as compared to clear speech, when comparing trials that contain a gesture to trials that do not contain a gesture. For reaction times, this reflects a larger reduction in reaction time cost in degraded speech compared to clear speech, when comparing trials that contain a gesture to trials that do not contain a gesture. All conditions contained 40 unique verbs and videos. Every participant thus saw 160 different videos in total.
2.4. Procedure
Non‐native listeners were asked to fill out the LexTALE assessment online prior to coming to the laboratory, to ensure their proficiency level was high enough to participate. If their score was above 60%, they learned Dutch after or at age 12, and they used Dutch on a regular basis, they were invited to participate in the study. Native listeners filled in the LexTALE test on paper upon arrival.
The participants were then instructed on the task and set up with the eye tracker in a dimly‐lit soundproof booth. They were asked to watch and listen to videos and fill out what verb they heard in the videos in a subsequent cued–recall task. All participants were seated approximately 70 cm from the computer screen and held a 4‐button box to submit their answers. The experimental stimuli were presented on a 1,650 × 1,080 monitor using Experiment Builder (SR Research), while eye‐movements were monitored at a sampling rate of 1 kHz with an SR Research EyeLink 1000 eye‐tracker.
After being instructed on the task, participants underwent a 9‐point calibration and validation procedure. This procedure was repeated until the average discrepancy between the calibration point and the participants gaze was <0.75º. Each trial started with a fixation cross (1,000 ms), which was followed by an experimental video (2,000 ms), a blank screen (1,000 ms), and finally, the four answering options of the cued–recall task where the participant had to indicate what verb they heard (5,000 ms) (see Fig. 2). Here, participants could indicate their choice by a right‐hand button press on a 4‐buttonbox, where the buttons represented the answering options. These answering options always contained a phonological distractor, a semantic distractor, an unrelated answer, and the correct answer. For example, if the correct answer would be “kruiden” (to season), the phonological distractor could be “kruipen,” to crawl, the semantic distractor could be “zouten” (to salt), and the unrelated answer could be “vouwen,” to fold (see Fig. 2). These distractors were chosen based on earlier pre‐tests which were a part of the study by Drijvers and Özyürek (2017). Specifically, we used the incorrect answers on these pre‐tests as input for the phonological and semantic distractors. The order of the stimuli was pseudo‐randomized for all participants. In total, the experiment lasted 20 min. After the main experiment, the participant had to fill out the second LexTALE task.
Figure 2.
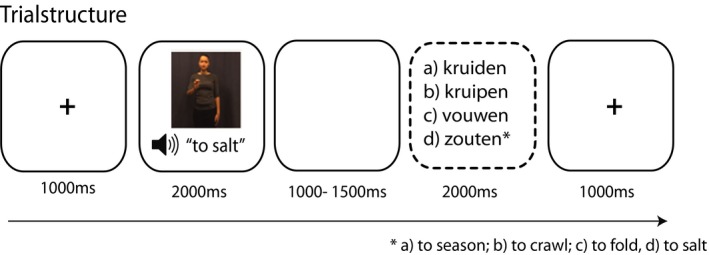
Trial overview. Participants encountered a fixation cross (1,000 ms), listened, and watched the video (2,000 ms), followed by a short delay (1,000 ms) and the cued–recall task (5,000 ms max., screen disappeared after answering).
2.5. Eye‐tracking analysis
We segmented the data in epochs of 2 s, corresponding to the length of the video. All trials that had a trackloss of 25% and higher were removed. All data points were automatically coded as fixations, saccades, or blinks using the Eyelink algorithm and were loaded and processed in MATLAB, partly using the FieldTrip Toolbox (Oostenveld, Fries, Maris, & Schoffelen, 2011). The timing of fixations was always relative to the onset of the video.
We defined three areas of interest: face, mouth, and gesture/torso. Initially, we only included “face” and “gesture/torso” in our analyses, but we specified a subregion in the “face” area of interest to investigate whether specific effects were attributable to the mouth region (see Fig. 3). The area of interest that comprised the “gesture/torso” was made on the basis of the x–y coordinates that corresponded to the furthest points in which a gesture was seen to occur in a video, and thus comprised the whole gesture space. Note that defining these areas of interest does not imply that when listeners look at one of the areas, they do not process visual information that occurs in the other areas of interest. Previous research has demonstrated that, for example, gestural information is often processed peripherally (Gullberg & Holmqvist, 1999, 2002, 2006; Gullberg & Kita, 2009). However, we predict that listeners might more often overtly allocate visual attention to certain areas of interest under adverse listening conditions, when peripheral processing is not sufficient to aid comprehension. Therefore, we were interested in the proportions of fixations at each area of interest. Fixations that fell outside of these areas of interest were not analyzed further (= 8.05% of all fixations). We then created timelines of whether a participant was fixating on an area of interest (face/mouth/torso), per condition, per participant. The proportions of fixations displayed by these timelines formed the dependent variable in the subsequent analyses.
Figure 3.
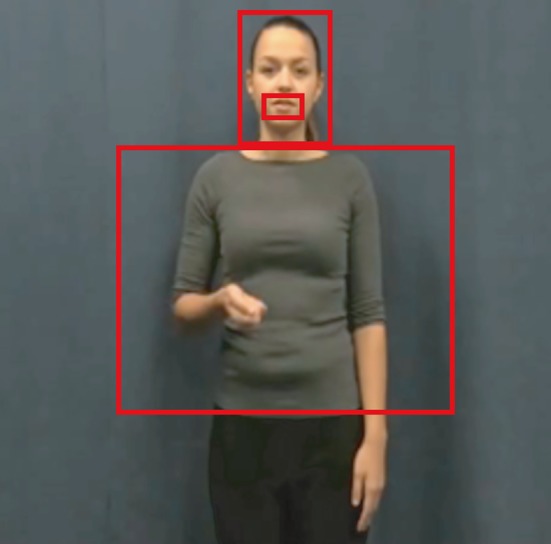
Areas of interest: mouth, face, and gesture/torso.
2.6. Cluster‐based permutation tests
In our eye‐tracking analyses, we used non‐parametric cluster‐based permutation tests to test for differences between conditions and groups and to control for multiple comparisons (Maris & Oostenveld, 2007). Our time window of interest was the entire epoch, from video onset (0 ms) to video offset (2,000 ms), and clustering was done along the temporal dimension. We computed the difference between two paired conditions or unpaired groups and created a distribution of these difference values. The observed values were thresholded with the 95th percentile of this distribution, and these clusters formed the cluster candidates. These values were then randomly reassigned over the conditions (1,000 permutations) to form the permutation distribution. Every permutation the cluster candidate with the highest sum of the difference was added to the permutation distribution. The observed values were then compared to the permutation distribution. Clusters that fell in the highest or lowest 2.5 percentile of the distribution were considered significant. The calculation of interaction effects followed a similar procedure, but compared two differences to each other, or the difference of these differences per group.
2.7. Correlational analyses
One of our main interests is to investigate whether looking at a gesture when speech is degraded can predict comprehension during the cued–recall task. We therefore extracted the mean fixation proportion of each participant in the time window where the meaningful part of the gesture is unfolding (from stroke onset, 550 ms, to retraction onset, 1,380 ms) in the DG condition, and correlated this with the gestural enhancement effect in the behavioral task ((DG–CG) − (DO–CO)) per participant, using Spearman correlations.
3. Results
3.1. Behavioral results—LexTALE
We used the LexTALE test to assess the Dutch proficiency level of all participants. Native listeners scored significantly better on the first LexTALE test than non‐native listeners (t(38) = 5.587, p < .001, Native listeners: MeanScore = 91.9, SD = 6.1, Non‐native listeners: MeanScore = 78.1, SD = 9.2), as well as on the second‐adapted LexTALE test (t(22.6) = 8.561, p < .001, Native listeners: MeanScore = 96.3, SD = 2.7, Non‐native listeners: MeanScore = 78.6, SD = 8.8).
3.2. Behavioral results—Cued–recall task (accuracy and reaction times)
We then tested for differences in accuracy and reaction times by conducting two mixed repeated measures ANOVA's with the ListenerGroup (native/non‐native) as a between‐subjects factor, and Noise‐Vocoding (clear/degraded) and Gesture (present/not present) as within‐subjects factors. All results and individual data points are displayed in Fig. 4 (accuracy) and Fig. 5 (reaction times), and raincloud plots were created by using the code by Allen, Poggiali, Whitaker, Marshall, and Kievit (2018).
Figure 4.
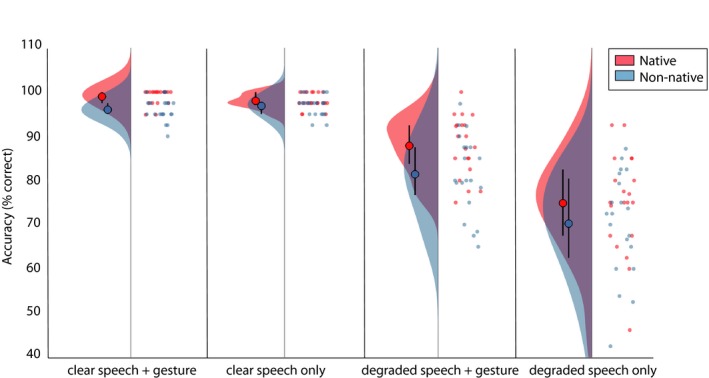
Raincloud plots of accuracy scores in the cued–recall task per condition. Native listeners are displayed in red, non‐native listeners in blue. Per condition (x‐axis), two distributions are displayed. Left: Width of the distributions represents the density in order of 10‐3. Large dot represents mean, lines represent quantiles of boxplot. Right: Individual dots on the right halves of each plot per condition represent individual data points.
Figure 5.
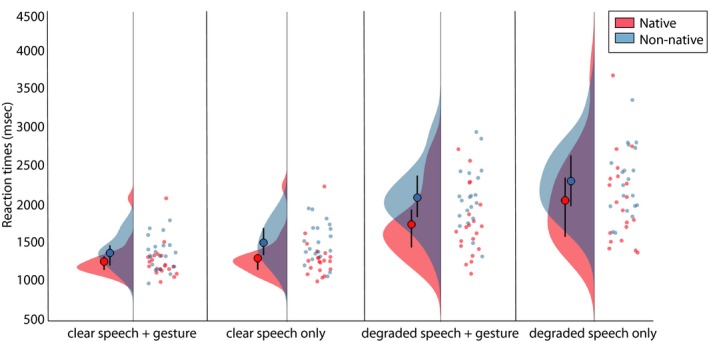
Raincloud plots of reaction times in the cued–recall task per condition. Native listeners are displayed in red, non‐native listeners in blue. Per condition (x‐axis), two distributions are displayed. Left: Width of the distributions represents the density in order of 10‐3. Large dot represents mean, lines represent quantiles of boxplot. Right: Individual dots on the right halves of each plot per condition represent individual data points.
As can be observed from Fig. 4, both native and non‐native listeners answered more accurately when speech was clear than when speech was degraded (F(1, 38) = 193.90, p < .001, partial η2 = .836) and when a gesture was present as opposed to not present (F(1, 38) = 63.91, p < .001, partial η2 = .627). These effects did not differ per listener group, as was demonstrated by a lack of an interaction effect between ListenerGroup and Noise‐Vocoding (F(1, 38) = 1.65, p = .20, partial η2 = .042) and a lack of an interaction effect between ListenerGroup and Gesture (F(1, 38) = 1.47, p = .233, partial η2 = .037). We observed an interaction between Noise‐Vocoding and Gesture (F(1, 38) = 70.815, p < .001, partial η2 = .651), indicating that both groups experienced a larger gain in accuracy caused by gesture in degraded than in clear speech. Contrary to our hypotheses, this gestural enhancement (Native(DGDO vs. CGCO) vs. Non‐native(DGDO vs. CGCO)) effect did not differ between the native and non‐native listener groups (F(1, 38) = <.001, p < .987, partial η2 = <.001), indicating that the gestural enhancement effect was not larger for natives than non‐natives. However, native listeners were in general more accurate than non‐native listeners (F(1, 38) = 6.42, p = .016, partial η2 = .145), even though the magnitude of the gestural enhancement effect was similar for native and non‐native listeners.
In Fig. 5, the reaction times on the cued–recall task are displayed for native and non‐native listeners. Both native and non‐native listeners were quicker in answering on the cued–recall task when speech in a video was clear than when it was degraded (F(1, 38) = 213.83, p < .001, partial η2 = .849), and when a gesture was present as compared to not present (F(1, 38) = 62.723, p < .001, partial η2 = .623). Both of these effects did not differ per listener group, as demonstrated by the lack of an interaction between ListenerGroup and Noise‐Vocoding (F(1, 38) = 2.323, p = .136, partial η2 = .058) and the lack of an interaction between ListenerGroup and Gesture (F(1, 38) = 0.006, p = .94, partial η2 = <.001). Native and non‐native listeners both experienced the largest reduction in reaction time cost by gestures in degraded speech compared to clear speech, as indicated by an interaction effect between Noise‐Vocoding and Gesture (F(1, 38) = 24.731, p < .001, partial η2 = .394). In contrast to the results in accuracy, and in line with our predictions, we observed a three‐way interaction between Noise‐Vocoding, Gesture, and ListenerGroup (F(1, 38) = 6.965, p < .012, partial η2 = .155), indicating that the speed up in reaction times caused by the gestural enhancement effect was larger for native listeners than non‐native listeners. Finally, overall, native listeners were quicker to answer than non‐native listeners (F(1, 38) = 4.798, p < .035, partial η2 = .112).
In sum, these results thus demonstrate a larger reduction time cost by gestures in degraded compared to clear speech that was larger for native as compared to non‐native listeners. We found a similar larger increase in accuracy by gestures in degraded as compared to clear speech in native and non‐native listeners.
3.3. Eye‐tracking results—Face and mouth
3.3.1. Native listeners (within‐group)
We first analyzed the eye‐tracking results of both groups separately to uncover specific gaze allocation patterns per listener group, per area of interest, before comparing both groups to test for between‐group differences. To facilitate the ease of interpretation of the results of our cluster‐based permutation tests, we have included the results of our main effects and interaction effects in Table 1. We first tested for a main effect of gesture and noise by combining the gesture conditions (DG & CG), the no gesture conditions (DO & CO), the clear speech conditions (CG & CO), and the degraded speech conditions (DG & DO), and comparing those to each other. We then tested for interaction effects (Gesture × Noise‐Vocoding) by comparing (DG‐CG) to (DO‐CO). Single comparisons per condition can be found in the Supplementary Materials, with the most important comparisons (DO vs. CO, DG. vs CG) visualized in Figs. 6 and 7.
Table 1.
Table containing all p‐values for all main effects within groups, interaction effects within and between groups per region of interest (“Face”/“Mouth”/“Gesture/Torso”)
| p‐value | Time Window | |
|---|---|---|
| Face | ||
| Gesture (native) | <.001 | 609–1,542 |
| Gesture (non‐native) | <.001 | 233–2,000 |
| Noise‐Vocoding (native) | <.001 | 936–2,000 |
| Noise‐Vocoding (non‐native) | <.001 | 1,280–2,000 |
| Gesture × Noise (native) | .002 | 1,600–2,000 |
| Gesture × Noise (non‐native) | .002 | 1,464–2,000 |
| ListenerGroup × Noise | n.s. | n/a |
| ListenerGroup × Gesture | n.s. | n/a |
| ListenerGroup × Noise × Gesture | n.s. | n/a |
| Mouth | ||
| Gesture (native) | .003 | 1,060–1,541 |
| Gesture (non‐native) | <.001 | 211–1,358 |
| Noise‐Vocoding (native) | <.001 | 735–1,993 |
| Noise‐Vocoding (non‐native) | <.001 | 1,368–1,898 |
| Gesture × Noise NL | .002 | 649–760 |
| Gesture × Noise DE | .002 | 1,611–2,000 |
| ListenerGroup × Noise | .039 | 504–923 |
| ListenerGroup × Gesture | .07 | n/a |
| ListenerGroup × Noise × Gesture | .023 | 1,464–1,533 |
| Gesture/Torso | ||
| Gesture (native) | <.001 | 590–1,542 |
| Gesture (non‐native) | <.001 | 538–1,845 |
| Noise‐Vocoding (native) | <.001 | 1,404–1,790 |
| Noise‐Vocoding (non‐native) | .02 | 1,463–1,520 |
| Gesture × Noise NL | .002 | 1,648–2,000 |
| Gesture × Noise DE | <.001 | 1,640–2,000 |
| ListenerGroup × Noise | n.s. | n/a |
| ListenerGroup × Gesture | .025 | 707–1,230 |
| ListenerGroup × Noise × Gesture | n.s. | n/a |
Times in time window column are in milliseconds.
Figure 6.
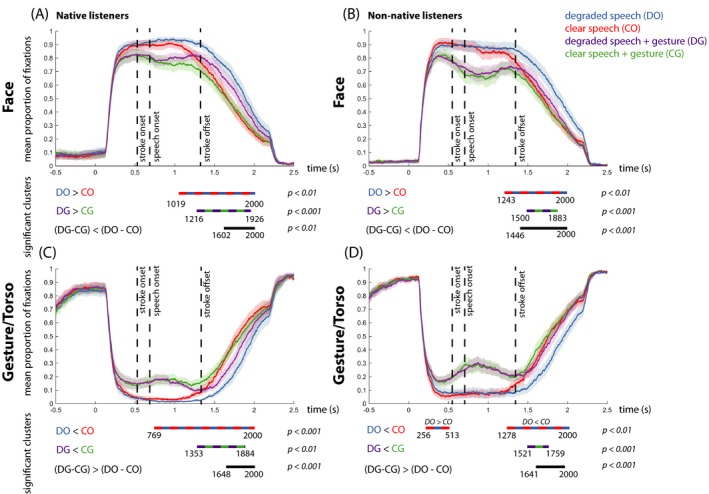
Mean proportion of fixation over time on the face for native listeners (A) and non‐native listeners (B). Mean proportion of fixations over time on the body (“Gesture/Torso”) for native (C) and non‐native listeners (D). In all graphs, each color represents a condition (DO = blue, CO = red, DG = purple, CG = green), and shaded color bars around the mean proportion lines represent standard error. Below each graph, the difference between the conditions and the direction of the effects is specified per comparison. The colored dashed lines represent the differences between the conditions in the significant time‐intervals. “n.s.” denotes “not significant.”
Figure 7.
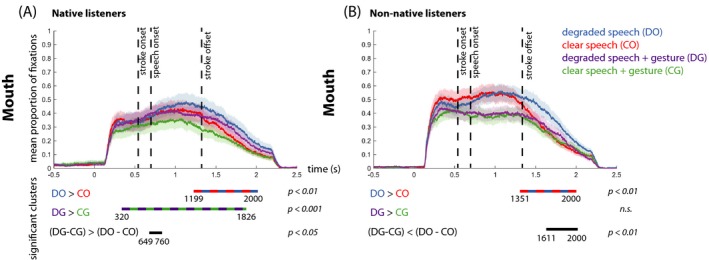
Mean proportion of fixation over time on the mouth for native listeners (A) and non‐native listeners (B). In all graphs, each color represents a condition (DO = blue, CO = red, DG = purple, CG = green), and shaded color bars around the mean proportion lines represent standard error. Below each graph, the difference between the conditions and the direction of the effects is specified per comparison. The colored dashed lines represent the differences between the conditions in the significant time‐intervals. “n.s.” denotes “not significant.”
A main effect of Gesture revealed that native listeners look more at the face when a gesture is not present as compared to present (p < .001, 609–1,542 ms). A main effect of Noise revealed that native listeners look more at the face in degraded speech than in clear speech (p < .001, 936–2,000 ms). An interaction effect between Gesture and Noise‐Vocoding revealed that for native listeners the increase of fixations to the face during degraded compared to clear speech was the strongest when no gesture was present as compared to present (p < .002, 1,600–2,000 ms). Please see the Supplementary Materials and Fig. 6A for simple effects between conditions.
To specify whether gaze was allocated to visible speech or other parts of the face, we then created an extra area of interest that covered the area of the mouth. Here, a main effect of Gesture revealed that native listeners gazed more at the mouth when a gesture was not present as compared to present (p = .003, 1,060–1,542 ms), and a main effect of Noise‐Vocoding revealed that native listeners gaze more to the mouth when speech was degraded as compared to clear (p < .001, 735–1,993 ms). An interaction effect between Gesture and Noise‐Vocoding revealed that listeners look most at the mouth when speech was degraded and a gesture was not present (p < .002, 649–760 ms). Please see the Supplementary Materials and Fig. 7 for simple effects between conditions.
3.3.2. Non‐native listeners (within‐group)
We then analyzed gaze allocation to the face and mouth within the non‐native listener group. A main effect of Gesture revealed that non‐native listeners look more at the face when a gesture is not present as compared to present (p < .001, 233–2,000 ms). A main effect of Noise‐Vocoding revealed that non‐native listeners look more at the face in degraded speech than in clear speech (p < .001, 1,280–2,000 ms). An interaction effect between Gesture and Noise‐Vocoding revealed that the increase of fixations to the face during degraded speech is the strongest when no gesture is present as compared to present (p = .002, 1,464–2,000 ms). Please see the Supplementary Materials and Fig. 6B for simple effects between conditions.
We zoomed into these effects by distilling how often non‐native listeners fixated on the mouth of the actress (see Fig. 7D). Here, a main effect of Gesture revealed that non‐native listeners gazed more at the mouth when a gesture was not present as compared to present (p = .001, 211–1,358 ms), and a main effect of Noise‐Vocoding revealed that non‐native listeners gaze more to the mouth when speech was degraded as compared to clear (p < .001, 1,368–1,898 ms). An interaction effect between Gesture and Noise‐Vocoding revealed that non‐native listeners look most at the mouth when speech was degraded and a gesture was not present (p < .002, 1,611–2,000 ms). Please see the Supplementary Materials and Fig. 7B for simple effects between conditions.
3.3.3. Native versus non‐native listeners (between‐group)
We observed no two‐way interactions between ListenerGroup and Noise‐Vocoding or ListenerGroup and Gesture for the Face region of interest (no clusters observed), indicating that the differences between fixations to the mouth when comparing conditions containing gestures or not and when comparing conditions containing clear or degraded speech were similar when comparing native and non‐native listeners. We observed no three‐way interaction between ListenerGroup, Noise‐Vocoding, and Gesture (no clusters observed).
For the Mouth region of interest, we observed a two‐way interaction between ListenerGroup and Noise, indicating that for native listeners the difference between fixations to the mouth in degraded compared to clear conditions was larger than for non‐native listeners (p = .039, 504–923 ms, see Fig. S1). This reveals that the increase in fixations to the mouth elicited by the degraded speech signal is stronger for native compared to non‐native listeners. We did not observe a two‐way interaction for ListenerGroup × Gesture (p = 0.07). A three‐way interaction between ListenerGroup × Gesture × Noise‐vocoding demonstrated that the increase in fixations to the mouth elicited by the degraded speech signal and the absence of gestures is stronger for native compared to non‐native listeners (p = .023, 1,464–1,533 ms, see Fig. S1). Please see Supplementary materials for comparisons between single conditions or differences between single conditions.
3.4. Eye‐tracking results—Gesture
3.4.1. Native listeners (within‐group)
Our second visual articulator of interest was gesture. A main effect of Gesture revealed that native listeners look more at the torso when a gesture is present as compared to not present (p < .001, 590–1,542 ms). A main effect of Noise‐Vocoding revealed that native listeners look more at the torso when speech is clear as compared to degraded (p < .001, 1,404–1,790 ms). An interaction effect between Gesture and Noise‐Vocoding revealed that listeners look most at the torso when speech was clear and a gesture was present (p = .002, 1,648–2,000 ms). This means that the increase in fixation to the gesture elicited by the presence of a gesture is most pronounced in clear versus degraded speech. Please see the Supplementary Materials and for simple effects between conditions.
3.4.2. Non‐native listeners (within‐group)
Similarly to native listeners, we then investigated gaze allocation to gestures within the non‐native listener group. A main effect of Gesture revealed that non‐native listeners look more at the torso when a gesture is present as compared to not present (p < .001, 538–1,845 ms). A main effect of Noise‐Vocoding revealed that non‐native listeners look more at the torso when speech is clear as compared to degraded (p < .001, 1,463–1,520 ms). An interaction effect between Gesture and Noise‐Vocoding revealed that listeners look most at the torso when speech was clear and a gesture was present (p < .001, 1,640–2,000 ms). Please see the Supplementary Materials for simple effects between conditions.
3.4.3. Native versus non‐native listeners (between‐group)
We observed no two‐way interaction between ListenerGroup and Noise, indicating that the increase in fixations to the torso in clear versus degraded speech is similar for native compared to non‐native listeners (p = .21). We observed a two‐way interaction between ListenerGroup and Gesture, indicating that the increase in fixations to the torso elicited by the gesture conditions compared to no gesture conditions is larger for non‐native listeners than for native listeners (p = .025, 707–1,230 ms, see Fig. S1). We did not observe a three‐way interaction between ListenerGroup × Gesture × Noise‐vocoding, indicating that the increase in fixations to the torso in the gesture conditions compared to the no gesture conditions is not larger in clear or degraded speech when comparing native and non‐native listeners (no clusters observed).
3.4.4. Correlational analyses
Native listeners who look more at a gesture when speech is degraded experience a larger gestural benefit during degraded speech comprehension on accuracy (r = .521, p = .019), but this was not reflected in a speeding up of their reaction times (r = −.136, p = .567). Non‐native listeners who look more at a gesture when speech is degraded, do not experience a larger benefit during degraded speech comprehension on accuracy (r = .056, p = .813) nor on reaction times (r = −.065, p = .787).
4. Discussion
We investigated whether and how native and non‐native listeners allocate overt visual attention to visible speech and gestures during clear and degraded speech comprehension, and whether overt gaze allocation to these visual articulators could predict the gestural benefit listeners experience during degraded speech comprehension. We reasoned that under adverse listening conditions, listeners might more overtly allocate visual attention to visual articulators to aid comprehension. This would mean that listeners look more to the face/torso when speech is degraded than compared to when speech is clear.
On the cued–recall task, both native and non‐native listeners demonstrated a clear gestural enhancement effect during degraded speech comprehension. We observed a larger reduction of reaction time cost by gestures in degraded than in clear speech. This effect was larger for native as compared to non‐native listeners. However, a similar difference in gestural enhancement effect was not reflected in their accuracy scores.
Our eye‐tracking results revealed that overall, both native and non‐native listeners gaze more at the face than gestures, especially when speech is degraded. Native listeners demonstrated a larger increase of fixations toward the mouth when speech was degraded and a gesture was absent than non‐native listeners. Native listeners thus might be more able to benefit from gestures in the periphery of their vision, and thus benefit from gestures and visible speech information in a joint context. In line with this, we demonstrated that non‐native listeners gazed more at gestural information than native listeners, irrespective of whether speech was clear or degraded. However, overt gaze allocation to gesture during degraded speech comprehension only predicted how much a listener benefits from gestural information in native, but not non‐native listeners. Below, we interpret these results in more detail.
4.1. Gestural enhancement of degraded speech comprehension is larger for native than non‐native listeners
In line with our hypotheses, both native and non‐native listeners demonstrated a clear gestural enhancement effect on the cued–recall task (following Drijvers & Özyürek, 2017, 2019; Drijvers et al., 2018, 2019). This gestural enhancement effect was the largest when speech was degraded in both native and non‐native listeners. The gestural enhancement effect was similar for native and non‐native when comparing the gestural benefit on their accuracy scores, but differed between the groups when comparing the reduction of reaction time cost. This means that gestural–semantic information causes a reduction in reaction time cost when speech is degraded for native listeners, but less for non‐native listeners.
We believe this discrepancy between reaction times and accuracy is caused by the nature of our cued–recall task. It is imaginable that a listener might have not understood the verb while they were watching the video, but did recognize the verb when they were prompted with the four answering options. This would result in an accurate answer, even though the listener might not have understood the verb. Reaction times, however, are not affected by this: If a listener did not understand the verb while watching the video, but recognizes the correct answer when prompted by the answers, this will result in a longer reaction time than when the verb was already understood while they were watching the video. To circumvent this issue, future studies could consider asking participants to speak out which verb they heard in the videos, instead of providing them with predefined answers.
In line with previous work (e.g., Drijvers & Özyürek, 2018, 2019), these behavioral results indicate that during degraded speech comprehension, non‐native listeners might require more auditory cues to benefit from the semantic information that is conveyed by the gesture. This is also in line with previous work on unimodal non‐native degraded speech comprehension, which has demonstrated that non‐native listeners are only able to use semantic contextual information to resolve information loss at the phoneme level when signal quality is sufficient (e.g., Bradlow & Alexander, 2007).
4.2. Native and non‐native listeners look more to the face and mouth when speech is degraded than when speech is clear
In general, and in line with previous literature, the face formed the locus of attention during comprehension for both native and non‐native listeners (Baron‐Cohen, Wheelwright, Hill, Raste, & Plumb, 2001; Rogers, Speelman, Guidetti, & Longmuir, 2018). Note that overt gaze allocation to either the face or torso does not imply that a listener cannot extract information from another visual articulator. For example, previous work has demonstrated that listeners often process gestural information from the periphery while they gaze at the face gestures (Gullberg & Holmqvist, 1999, 2002, 2006; Gullberg & Kita, 2009). However, we reasoned that listeners may more overtly allocate their visual attention to a certain visual articulator under adverse listening conditions, especially when peripheral processing is not sufficient for comprehension. In line with this reasoning and our hypotheses, native and non‐native listeners significantly looked more often to the face when speech was degraded than when speech was clear, irrespective of whether a gesture was present or not. Moreover, the results from Fig. 6A,B suggest that when speech is degraded, listeners demonstrate sustained visual attention to the face, possibly to extract more information to aid comprehension when speech is degraded (Ross et al., 2006; Vatikiotis‐Bateson, Eigsti, Yano, & Munhall, 1998), and the lack of phonological information might delay or hinder comprehension. The lack of a two‐ and three‐way interactions suggested that this effect was similar for native and non‐native listeners.
Similar results were observed when comparing fixations towards the mouth, but here we did observe a three‐way interaction between native listener status, the occurrence of gesture, and the occurrence of noise. This effect suggested that an increase of fixations to the mouth, elicited by the degraded speech signal and the absence of gestures, was stronger for native compared to non‐native listeners. This effect also seems in line with previous results, suggesting that non‐native listeners might require more phonological knowledge to couple the information from visible speech to the degraded auditory cues (see Bradlow & Alexander, 2007; Drijvers & Özyürek, 2018, 2019). Non‐native listeners thus might focus more on other visual articulators to aid comprehension.
The timing of the interaction effect of Gesture and Noise‐Vocoding for native listeners (649–760 ms) gives an additional insight into how these processes might differ for native as compared to non‐native listeners. We speculate that when speech starts, native listeners might try to immediately incorporate the phonological information that is conveyed by the mouth, especially when a gesture is present and speech is degraded. For native listeners, this could imply that peripheral processing of a gesture during degraded speech might be sufficient for comprehension. This, in turn, results in more fixations on the mouth, and suggests that native listeners can optimally benefit from both visual articulators in a joint context (similar to what was suggested in Drijvers & Özyürek, 2017), whereas this might be too taxing for non‐native listeners.
4.3. Non‐native listeners allocate more visual attention to gestures than native listeners in both clear and degraded speech
We predicted that listeners would gaze more at gestures when speech was degraded than when speech was clear. However, both native and non‐native listeners looked more at the torso when speech was clear as compared to degraded. A two‐way interaction between ListenerGroup and Gesture revealed that in general, non‐native listeners gazed more at gestures than native listeners. This was irrespective of the noise‐vocoding level.
When comparing the single conditions containing a gesture in clear and degraded speech between native and non‐native listeners, we observed a larger proportion of fixations allocated to the gesture in both clear and degraded speech for non‐native listeners as compared to native listeners. This effect occurred earlier in clear speech than in degraded speech (clear speech: 856–933 ms; degraded speech: 981–1,151 ms). This confirms our hypothesis that the degraded speech signal might delay the use of semantic information, especially for non‐native listeners. Non‐native listeners might find it more difficult to resolve the phonological cues in the speech signal and couple them to the phonological information conveyed by visible speech than native listeners, and may therefore try to focus more on the semantic information that is conveyed by the gesture than native listeners. Native listeners however might be able to benefit from both visual articulators in a joint context quicker than non‐native listeners due to their native listener status (in line with Drijvers & Özyürek, 2018; Drijvers et al., 2019).
Note that our results suggest a possible reciprocal relationship between fixations to the face/mouth and the torso. However, 8% of the fixations fell outside of our areas of interest, and the results of our cluster‐based permutation tests for effects in the face, mouth, and gesture areas do not exactly mirror each other in timing or occurrence (see Table 1). We therefore do not believe that the effects completely mirror each other and can solely be explained by the inverse relationship between fixations to the face and torso.
4.4. Gaze allocation to gestures predicts gestural enhancement during degraded speech for native but not non‐native listeners
We hypothesized that in both groups, gaze allocation to gestures could predict the gestural enhancement a listener experiences during degraded speech comprehension. Whereas this was not the case for non‐native listeners, we demonstrated that a native listener's gaze to gestures during degraded speech could predict the increase in accuracy a native listener experiences during gestural enhancement of degraded speech comprehension. This finding again suggests that native listeners can jointly benefit from both visual articulators during comprehension, but non‐natives might be more hindered in this process. Although non‐native listeners allocate more gaze to gestures, they cannot resolve enough cues in the degraded speech signal so that the gesture can predict comprehension. Possibly, non‐native listeners need more phonological cues, partly conveyed by visible speech, to aid comprehension.
5. Conclusion
We demonstrated that both native and non‐native listeners look more at the face and mouth when speech is degraded than when speech is clear. Native and non‐native listeners both looked more at gestures when speech was clear than when speech was degraded. This is possibly due to the fact that native and non‐native listeners both demonstrated sustained visual attention to the face and mouth when phonological cues in speech were hard to disambiguate. Non‐native listeners allocated more gaze to gestures than native listeners, but as disambiguating the degraded auditory cues was more challenging, the use of semantic information might be more delayed and hindered than for native listeners. As native listeners are more able to utilize and resolve degraded auditory cues than non‐natives, native listeners can map more visual information to the speech signal, resulting in better speech comprehension, especially when speech is degraded. The degree of language experience a listener has thus modulates visual attention to visual articulators when processing clear and degraded speech, as well as the benefit a listener experiences from these visual articulators during comprehension.
Supporting information
Appendix S1. Additional analyses.
Acknowledgments
This research was supported by Gravitation Grant 024.001.006 of the Language in Interaction Consortium from Netherlands Organization for Scientific Research. We are very grateful to Nick Wood for helping us in editing the video stimuli, and to Gina Ginos for being the actress in the videos.
References
- Agrafiotis, D. , Canagarajah, N. , Bull, D. R. , & Dye, M. (2003). Perceptually optimized sign language video coding based on eye tracking analysis. Electronics Letters, 39(24), 1703–1705. 10.1049/el [DOI] [Google Scholar]
- Allen, M. , Poggiali, D. , Whitaker, K. , Marshall, T. R. , & Kievit, R. (2018). Raincloud plots: A multi‐platform tool for robust data visualization. PeerJ Preprints, 6, e27137v1. [DOI] [PMC free article] [PubMed] [Google Scholar]
- Argyle, M. , & Cook, M. (1976). Gaze and mutual gaze. Oxford, UK: Cambridge University Press. [Google Scholar]
- Argyle, M. , & Graham, J. A. (1976). The central Europe experiment: Looking at persons and looking at objects. Environmental Psychology and Nonverbal Behavior, 1(1), 6–16. 10.1007/BF01115461 [DOI] [Google Scholar]
- Baron-Cohen, S. , Wheelwright, S. , Hill, J. , Raste, Y. , & Plumb, I. (2001). The “Reading the Mind in the Eyes” Test revised version: A study with normal adults, and adults with Asperger syndrome or highfunctioning autism. The Journal of Child Psychology and Psychiatry and Allied Disciplines, 42(2), 241–251. [PubMed] [Google Scholar]
- Boersma, P. , & Weenink, D. (2019). Praat: Doing phonetics by computer [Computer program]. Version 6.1.03. Available at: http://www.praat.org/. Accessed September 1, 2019. [Google Scholar]
- Bradlow, A. R. , & Alexander, J. A. (2007). Semantic and phonetic enhancements for speech‐in‐noise recognition by native and non‐native listeners. The Journal of the Acoustical Society of America, 121(4), 2339–2349. 10.1121/1.2642103 [DOI] [PubMed] [Google Scholar]
- Brouwer, S. , & Bradlow, A. R. (2016). The temporal dynamics of spoken word recognition in adverse listening conditions. Journal of Psycholinguistic Research, 45(5), 1151–1160. 10.1007/s10936-015-9396-9 [DOI] [PMC free article] [PubMed] [Google Scholar]
- Brouwer, S. , Van Engen, K. J. , Calandruccio, L. , & Bradlow, A. R. (2012). Linguistic contributions to speech‐on‐speech masking for native and non‐native listeners: Language familiarity and semantic content. The Journal of the Acoustical Society of America, 131(2), 1449–1464. 10.1121/1.3675943 [DOI] [PMC free article] [PubMed] [Google Scholar]
- Buchan, J. N. , Paré, M. , & Munhall, K. G. (2007). Spatial statistics of gaze fixations during dynamic face processing. Social Neuroscience, 2(1), 1–13. 10.1080/17470910601043644 [DOI] [PubMed] [Google Scholar]
- Cutler, A. , Garcia Lecumberri, M. L. , & Cooke, M. (2008). Consonant identification in noise by native and non‐native listeners: Effects of local context. The Journal of the Acoustical Society of America, 124(2), 1264–1268. 10.1121/1.2946707 [DOI] [PubMed] [Google Scholar]
- Cutler, A. , Weber, A. , Smits, R. , & Cooper, N. (2004). Patterns of English phoneme confusions by native and non‐native listeners. The Journal of the Acoustical Society of America, 116(6), 3668–3678. 10.1121/1.1810292 [DOI] [PubMed] [Google Scholar]
- Dahl, T. I. , & Ludvigsen, S. (2014). How I see what you're saying: The role of gestures in native and foreign language listening comprehension. The Modern Language Journal, 98(3), 813–833. [Google Scholar]
- Drijvers, L. , & Özyürek, A. (2017). Visual context enhanced: The joint contribution of iconic gestures and visible speech to degraded speech comprehension. Journal of Speech, Language, and Hearing Research, 60(1), 212–222. 10.1044/2016_JSLHR-H-16-0101 [DOI] [PubMed] [Google Scholar]
- Drijvers, L. , & Özyürek, A. (2018). Native language status of the listener modulates the neural integration of speech and iconic gestures in clear and adverse listening conditions. Brain and Language, 177–178, 7–17. 10.1016/j.bandl.2018.01.003 [DOI] [PubMed] [Google Scholar]
- Drijvers, L. , & Özyürek, A. (2019). Non‐native listeners benefit less from gestures and visible speech than native listeners during degraded speech comprehension. Language and Speech, 002383091983131, 10.1177/0023830919831311 [DOI] [PMC free article] [PubMed] [Google Scholar]
- Drijvers, L. , Özyürek, A. , & Jensen, O. (2018). Hearing and seeing meaning in noise: Alpha, beta, and gamma oscillations predict gestural enhancement of degraded speech comprehension. Human Brain Mapping, 39(5), 2075–2087. 10.1002/hbm.23987 [DOI] [PMC free article] [PubMed] [Google Scholar]
- Drijvers, L. , van der Plas, M. , Özyürek, A. , & Jensen, O. (2019). Native and non‐native listeners show similar yet distinct oscillatory dynamics when using gestures to access speech in noise. NeuroImage, 194, 55–67. 10.1016/j.neuroimage.2019.03.032 [DOI] [PubMed] [Google Scholar]
- Emmorey, K. , Thompson, R. , & Colvin, R. (2009). Eye gaze during comprehension of American sign language by native and beginning signers. Journal of Deaf Studies and Deaf Education, 14(2), 237–243. 10.1093/deafed/enn037 [DOI] [PubMed] [Google Scholar]
- Erber, N. P. (1975). Auditory‐visual perception of speech. Journal of Speech and Hearing Disorders, 40(4), 481–492. [DOI] [PubMed] [Google Scholar]
- Flege, J. E. (1992). The intelligibility of English vowels spoken by British and Dutch talkers. Intelligibility in Speech Disorders: Theory, Measurement, and Management, 157–232. Retrieved from http://jimflege.com/files/Flege_in_Kent_1992.pdf [Google Scholar]
- Gullberg, M. , & Holmqvist, K. (1999). Keeping an eye on gestures: Visual perception of gestures in face‐to‐face communication. Pragmatics & Cognition, 7(1), 35–63. 10.1075/pc.7.1.04gul [DOI] [Google Scholar]
- Gullberg, M. , & Holmqvist, K. (2002). Visual attention towards gestures in face‐to‐face interaction vs. on screen. International Gesture Workshop, 206–214. [Google Scholar]
- Gullberg, M. , & Holmqvist, K. (2006). What speakers do and what addressees look at: Visual attention to gestures in human interaction live and on video. Pragmatics & Cognition, 14(1), 53–82. 10.1075/pc.14.1.05gul [DOI] [Google Scholar]
- Gullberg, M. , & Kita, S. (2009). Attention to speech‐accompanying gestures: Eye movements and information uptake. Journal of Nonverbal Behavior, 33(4), 251–277. 10.1007/s10919-009-0073-2 [DOI] [PMC free article] [PubMed] [Google Scholar]
- Habets, B. , Kita, S. , Shao, Z. , Özyürek, A. , & Hagoort, P. (2011). The role of synchrony and ambiguity in speech‐gesture integration during comprehension. Journal of Cognitive Neuroscience, 23(8), 1845–1854. 10.1162/jocn.2010.21462 [DOI] [PubMed] [Google Scholar]
- Hannah, B. , Wang, Y. , Jongman, A. , Sereno, J. A. , Cao, J. , & Nie, Y. (2017). Cross‐modal association between auditory and visuospatial information in Mandarin tone perception in noise by native and non‐native perceivers. Frontiers in Psychology, 8, 1–15. 10.3389/fpsyg.2017.02051 [DOI] [PMC free article] [PubMed] [Google Scholar]
- Hazan, V. , Sennema, A. , Faulkner, A. , Ortega‐Llebaria, M. , Iba, M. , & Chung, H. (2006). The use of visual cues in the perception of non‐native consonant contrasts. The Journal of the Acoustical Society of America, 119(3), 1740–1751. 10.1121/1.2166611 [DOI] [PubMed] [Google Scholar]
- Holle, H. , Obleser, J. , Rueschemeyer, S.‐A. , & Gunter, T. C. (2010). Integration of iconic gestures and speech in left superior temporal areas boosts speech comprehension under adverse listening conditions. NeuroImage, 49(1), 875–884. 10.1016/j.neuroimage.2009.08.058 [DOI] [PubMed] [Google Scholar]
- Iverson, P. , Kuhl, P. K. , Akahane‐Yamada, R. , Diesch, E. , Tohkura, Y. , Kettermann, A. , & Siebert, C. (2003). A perceptual interference account of acquisition difficulties for non‐native phonemes. Cognition, 87(1), B47–B57. 10.1016/S0010-0277(02)00198-1 [DOI] [PubMed] [Google Scholar]
- Jongman, A. , Wang, Y. , & Kim, B. H. (2003). Contributions of semantic and facial information to perception of nonsibilant fricatives. Journal of Speech Language and Hearing Research, 46(6), 1367 10.1044/1092-4388(2003/106) [DOI] [PubMed] [Google Scholar]
- Kawase, S. , Hannah, B. , & Wang, Y. (2014). The influence of visual speech information on the intelligibility of English consonants produced by non‐native speakers. The Journal of the Acoustical Society of America, 136(3), 1352–1362. 10.1121/1.4892770 [DOI] [PubMed] [Google Scholar]
- Kelly, S. D. , Creigh, P. , & Bartolotti, J. (2010). Integrating speech and iconic gestures in a Stroop‐like task: evidence for automatic processing. Journal of Cognitive Neuroscience, 22(4), 683–694. 10.1162/jocn.2009.21254 [DOI] [PubMed] [Google Scholar]
- Kilman, L. , Zekveld, A. , Hällgren, M. , & Rönnberg, J. (2014). The influence of non‐native language proficiency on speech perception performance. Frontiers in Psychology, 5, 1–9. 10.3389/fpsyg.2014.00651 [DOI] [PMC free article] [PubMed] [Google Scholar]
- Kim, J. , Sonic, A. , & Davis, C. (2011). Hearing speech in noise: Seeing a loud talker is better. Perception, 40(7), 853–862. 10.1068/p6941 [DOI] [PubMed] [Google Scholar]
- Krauss, R. M. , Morrel‐Samuels, P. , & Colasante, C. (1991). Do conversational hand gestures communicate? Journal of Personality and Social Psychology, 61(5), 743–754. 10.1037/0022-3514.61.5.743 [DOI] [PubMed] [Google Scholar]
- Krizman, J. , Bradlow, A. R. , Lam, S. S.‐Y. , & Kraus, N. (2016). How bilinguals listen in noise: Linguistic and non‐linguistic factors. Bilingualism: Language and Cognition, 20(4), 834–843. 10.1017/S1366728916000444 [DOI] [Google Scholar]
- Król, M. E. (2018). Auditory noise increases the allocation of attention to the mouth, and the eyes pay the price: An eye‐tracking study. PLoS ONE, 13(3), e0194491 10.1371/journal.pone.0194491 [DOI] [PMC free article] [PubMed] [Google Scholar]
- Kutas, M. , & Federmeier, K. D. (2014). Thirty years and counting: Finding meaning in the N400 component of the event related brain potential (ERP). Annual Review of Psychology, 62, 621–647. 10.1146/annurev.psych.093008.131123.Thirty [DOI] [PMC free article] [PubMed] [Google Scholar]
- Lecumberri, M. L. G. , Cooke, M. , & Cutler, A. (2010). Non‐native speech perception in adverse conditions: A review. Speech Communication, 52(11–12), 864–886. 10.1016/j.specom.2010.08.014 [DOI] [Google Scholar]
- Lemhöfer, K. , & Broersma, M. (2012). Introducing LexTALE: A quick and valid Lexical Test for Advanced Learners of English. Behavior Research Methods, 44(2), 325–343. 10.3758/s13428-011-0146-0 [DOI] [PMC free article] [PubMed] [Google Scholar]
- Maris, E. , & Oostenveld, R. (2007). Nonparametric statistical testing of EEG‐ and MEG‐data. Journal of Neuroscience Methods, 164(1), 177–190. 10.1016/j.jneumeth.2007.03.024 [DOI] [PubMed] [Google Scholar]
- Mayo, L. H. , Florentine, M. , & Buus, S. (1997). Age of second‐language acquisition and perception of speech in noise. Journal of Speech, Language, and Hearing Research: JSLHR, 40(3), 686–693. 10.1044/jslhr.4003.686 [DOI] [PubMed] [Google Scholar]
- McNeill, D. (1992). Hand and mind: What gestures reveal about thought. Chicago, IL: Chicago University Press. [Google Scholar]
- McQueen, J. M. , & Huettig, F. (2012). Changing only the probability that spoken words will be distorted changes how they are recognized. The Journal of the Acoustical Society of America, 131(1), 509–517. 10.1121/1.3664087 [DOI] [PubMed] [Google Scholar]
- Muir, L. J. , & Richardson, I. E. G. (2005). Perception of sign language and its application to visual communications for deaf people. Journal of Deaf Studies and Deaf Education, 10(4), 390–401. 10.1093/deafed/eni037 [DOI] [PubMed] [Google Scholar]
- Munhall, K. G. (1998). Eye movement of perceivers during audiovisual speech perception. Perception & Psychophysics, 60(6), 926–940. 10.3758/BF03211929 [DOI] [PubMed] [Google Scholar]
- Navarra, J. , & Soto‐Faraco, S. (2007). Hearing lips in a second language: Visual articulatory information enables the perception of second language sounds. Psychological Research Psychologische Forschung, 71(1), 4–12. 10.1007/s00426-005-0031-5 [DOI] [PubMed] [Google Scholar]
- Oostenveld, R. , Fries, P. , Maris, E. , & Schoffelen, J.‐M. (2011). FieldTrip: Open source software for advanced analysis of MEG, EEG, and invasive electrophysiological data. Computational Intelligence and Neuroscience, 2011, 156869 10.1155/2011/156869 [DOI] [PMC free article] [PubMed] [Google Scholar]
- Peelle, J. E. (2018). Listening effort. Ear and Hearing, 39(2), 204–214. 10.1097/AUD.0000000000000494 [DOI] [PMC free article] [PubMed] [Google Scholar]
- Posner, M. I. (2016). Orienting of attention: Then and now. Quarterly Journal of Experimental Psychology, 69(10), 1864–1875. 10.1080/17470218.2014.937446 [DOI] [PMC free article] [PubMed] [Google Scholar]
- Rennig, J. , Wegner‐Clemens, K. , & Beauchamp, M. S. (2018). Face viewing behavior predicts multisensory gain during speech perception. BioRxiv, 1–18, 10.1101/331306 [DOI] [PMC free article] [PubMed] [Google Scholar]
- Rogers, S. L. , Speelman, C. P. , Guidetti, O. , & Longmuir, M. (2018). Using dual eye tracking to uncover personal gaze patterns during social interaction. Scientific Reports, 8(1), 4271. [DOI] [PMC free article] [PubMed] [Google Scholar]
- Ross, L. A. , Saint‐Amour, D. , Leavitt, V. M. , Javitt, D. C. , & Foxe, J. J. (2006). Do you see what i am saying? Exploring visual enhancement of speech comprehension in noisy environments. Cerebral Cortex (New York, N.Y.: 1991), 17(5), 1147–1153. 10.1093/cercor/bhl024 [DOI] [PubMed] [Google Scholar]
- Scharenborg, O. , Coumans, J. M. J. , & van Hout, R. (2018). The effect of background noise on the word activation process in nonnative spoken‐word recognition. Journal of Experimental Psychology: Learning Memory and Cognition, 44(2), 233–249. 10.1037/xlm0000441 [DOI] [PubMed] [Google Scholar]
- Scharenborg, O. , & van Os, M. (2019). Why listening in background noise is harder in a non‐native language than in a native language: A review. Speech Communication, 108, 53–64. 10.1016/j.specom.2019.03.001 [DOI] [Google Scholar]
- Shannon, R. , Zeng, F.‐G. , Kamath, V. , Wygonski, J. , & Ekelid, M. (1995). Speech recognition with primarily temporal cues. Science, 270(5234), 303–304. [DOI] [PubMed] [Google Scholar]
- Sueyoshi, A. , & Hardison, D. M. (2005). The role of gestures and facial cues in second language listening comprehension. Language Learning, 55(4), 661–699. [Google Scholar]
- Sumby, W. H. , & Pollock, I. (1954). Visual contribution to speech intelligibility in noise. The Journal of the Acoustical Society of America, 26(2), 212–215. 10.1121/1.1907309 [DOI] [Google Scholar]
- Van Engen, K. J. , & McLaughlin, D. J. (2018). Eyes and ears: Using eye tracking and pupillometry to understand challenges to speech recognition. Hearing Research, 369, 56–66. 10.1016/j.heares.2018.04.013 [DOI] [PMC free article] [PubMed] [Google Scholar]
- Vatikiotis-Bateson, E. , Eigsti, I. M. , Yano, S. , & Munhall, K. G. (1998). Eye movement of perceivers during audiovisualspeech perception. Perception & Psychophysics, 60(6), 926–940. [DOI] [PubMed] [Google Scholar]
- Wang, Y. , Behne, D. M. , & Jiang, H. (2008). Linguistic experience and audio‐visual perception of non‐native fricatives. The Journal of the Acoustical Society of America, 124(3), 1716–1726. 10.1121/1.2956483 [DOI] [PubMed] [Google Scholar]
Associated Data
This section collects any data citations, data availability statements, or supplementary materials included in this article.
Supplementary Materials
Appendix S1. Additional analyses.