Abstract
Tropical mosquito-borne viruses have been expanding into more temperate regions in recent decades. This is partly due to the coupled effects of temperature on mosquito life history traits and viral infection dynamics and warming surface temperatures, resulting in more suitable conditions for vectors and virus transmission. In this study, we use a deterministic ordinary differential equations model to investigate how seasonal and diurnal temperature fluctuations affect the potential for dengue transmission in six U.S. cities. We specifically consider temperature-dependent mosquito larval development, adult mosquito mortality, and the extrinsic incubation period of the virus. We show that the ability of introductions to lead to outbreaks depends upon the relationship between a city’s temperature profile and the time of year at which the initial case is introduced. We also in-vestigate how the potential for outbreaks changes with predicted future increases in mean temperatures due to climate change. We find that climate change will likely lead to increases in suitability for dengue transmission and will increase the periods of the year in which introductions may lead to outbreaks, particularly in cities that typically have mild winters and warm summers, such as New Orleans, Louisiana, and El Paso, Texas. We discuss our results in the context of temperature heterogeneity within and across cities and how these differences may impact the potential for dengue emergence given present day and predicted future temperatures.
Keywords: Dengue, Temperature, Aedes aegypti, Arbovirus, United States, Emergence, Puerto Rico, Climate change
1. Introduction
In recent years, mosquito-borne viruses have spread globally and emerged in populations where the viruses had rarely or never before been present. This emergence has been driven by urbanization, in-creased global travel, and climate change (Gubler, 2002, 1998, 2009; Tatem et al., 2012; Reisen, 2013; Weaver and Reisen, 2010). While transmission of arboviruses in new populations necessitates numerous factors working in conjunction, understanding the relative contribution of individual factors remains critical to understanding where and when emergence will occur (Liang et al., 2015; Gubler, 2002; Wearing et al., 2016; Weaver and Reisen, 2010; Carbajo et al., 2012). In particular, as global surface temperatures rise and distributions of vector species expand, it is becoming increasingly important to understand the relationship between temperature and arboviral diseases (Lafferty and Mordecai, 2016; Reisen, 2013; Johnson and Ritchie, 2015).
Dengue fever, endemic in tropical and subtropical regions of the world, has been reported in areas with more temperate climates in recent years (Gjenero-Margan et al., 2011; Marchand et al., 2013; Rezza, 2014; Rey, 2014; Estallo et al., 2014). In many places, this has followed expansion or reestablishment of populations of the vectors that transmit the virus, Aedes aegypti and Aedes albopictus (Rezza, 2014; Mackenzie et al., 2004; Nasci, 2014; Hennessey et al., 2016; Vezzani and Carbajo, 2008). While dengue transmission in previously naïve areas is due, in part, to a higher frequency of importation rates of the virus from endemic regions, transmission would not occur without favorable environmental conditions, so it is highly likely that environmental conditions have become more suitable for dengue in these regions (Hales et al., 2002). Many components of the dengue transmission cycle and the vector life cycle are temperature-dependent (Couret and Benedict, 2014; Brady et al., 2013; Chan and Johansson, 2012). Several life history characteristics of the primary vector Ae. aegypti are temperature-dependent, including egg viability, development of larvae, and adult lifespan (Couret and Benedict, 2014; Brady et al., 2013; Rueda et al., 1990; Yang et al., 2009; Marinho et al., 2015; Byttebier et al., 2014; Christofferson, 2016; Beserra et al., 2009). In general, studies suggest that larval development is faster at warmer temperatures within a viable range for larval survival and that there exists an intermediate optimal temperature for adult lifespan (Brady et al., 2013; Rueda et al., 1990; Yang et al., 2009; Christofferson, 2016). Viral dynamics within the mosquito also depend upon temperature (Lafferty and Mordecai, 2016; Chan and Johansson, 2012; Watts et al., 1987). In particular, the extrinsic incubation period (EIP) – the time between exposure of the mosquito to the virus and the time at which the mosquito can transmit the virus – is a thermodynamic process. The EIP, a measure of viral dynamics within the mosquito, decreases with increasing temperature (Chan and Johansson, 2012; Watts et al., 1987; Carrington et al., 2013).
Recent empirical and modeling studies have begun to investigate the relationships between temperature and dengue transmission, in part to understand the potential influence of climate change on dengue transmission. A number of analyses have linked temperature to vector distributions and defined regions of the world at risk for dengue transmission (Campbell et al., 2015; Brady et al., 2014; Messina et al., 2015; Kraemer et al., 2015). Other studies have built upon this work to include the interactions of temperature with vector mortality, oviposition, egg hatching, and development, as well as contact and transmission rates (Mordecai et al., 2017; Butterworth et al., 2017; Siraj et al., 2017; Esteva and Yang, 2015; Huber et al., 2018; Johnson and Ritchie, 2015). These studies follow similar work aimed at studying the impacts of temperature on malaria and its vectors over the last decade (Beck-Johnson et al., 2013; Blanford et al., 2013; Mordecai et al., 2013; Paaijmans et al., 2010; Gething et al., 2011). Based on these studies, a rise in global surface temperatures is generally expected to modify the distribution of some disease-vectoring mosquito populations and could lead to expansion of the distribution of mosquito-borne viruses and increases in the magnitude of outbreaks of some mosquito-borne diseases (Mordecai et al., 2017; Butterworth et al., 2017; Siraj et al., 2017; Huber et al., 2018).
Although dengue is not currently endemic to the United States, there are historical reports of dengue in various parts of the country prior to the 1950s, including outbreaks in the Southeast and Texas during the early part of the 1900s (Rey, 2014; Dick et al., 2012). Since then, small outbreaks have been reported in Texas and Florida, and in 2015–2016, the Big island of Hawaii experienced a large outbreak (Rey, 2014; Radke et al., 2012; Adalja et al., 2012; Johnston et al., 2016). In 2016, Miami, Florida experienced a relatively large Zika virus outbreak, which indicates suitable environmental conditions for urban Aedes-arbovirus transmission (Florida, 2018). Outside of the fifty U.S. states, dengue has been endemic to Puerto Rico since the 1970s, and presently all four serotypes of the virus are regularly detected in Puerto Rico (Rigau-Pérez et al., 2002; Messina et al., 2014). Given the recent increase in frequency of dengue outbreaks in the United States, it is becoming more important to understand in what regions the environment is favorable for dengue transmission and how that favorability could change as global surface temperatures rise so that precautionary measures such as enhanced vector and virus surveillance can be employed.
As efforts to characterize the relationship between temperature and dengue continue, there remain significant gaps in understanding the role of heterogeneity in that relationship. Previous studies have made substantial progress in investigating the relationship between temperature and dengue transmission by focusing primarily on the contributions of temperature to mosquito and virus traits and how they influence the likelihood of outbreaks and the basic reproductive number, R0 (Butterworth et al., 2017; Mordecai et al., 2017). With a few exceptions (Lambrechts et al., 2011; Carrington et al., 2013), many of these studies do not, however, consider the impact of temperature on dengue dynamics or consider day-to-day or diurnal fluctuations in temperature and how this potentially impacts transmission. In the present study, we focus on the impacts of seasonal and diurnal fluctuations of temperature on mosquito and virus traits and how these fluctuations contribute to dengue transmission and the potential for emergence. We employ a deterministic mathematical model to investigate the influence of temperature-dependent dynamics of Ae. aegypti and interactions with temperature-dependent viral dynamics within the mosquito on the potential for dengue transmission in naïve populations in six cities in the United States or U.S. territories that currently have or potentially could support populations of Ae. aegypti: San Juan, Puerto Rico; Miami, Florida; New Orleans, Louisiana; Atlanta, Georgia; El Paso, Texas; and Los Angeles, California. We illustrate how seasonal and diurnal fluctuations of temperatures across the year could impact the potential for outbreaks at current observed temperatures in each of the cities in an effort to inform future risk of autochthonous dengue transmission. Finally, we investigate the implications of warmer average temperatures predicted due to climate change.
2. Materials and methods
We constructed an ordinary differential equations model that considers the human and mosquito vector populations subdivided into compartments based upon infection status. In our model, larval mosquito development time, adult mosquito mortality, and the EIP are dependent upon temperature and thus vary with time. We first describe our mathematical model before describing how temperature-dependent relationships are parameterized and incorporated into the model.
2.1. Temperature driven dynamic transmission model
Throughout the following description of the model, the human population is represented with the subscript h and the vector population with the subscript v. Susceptible, Exposed, Infectious, and Recovered humans are then denoted by Sh, Eh, Ih, and Rh, respectively. The total number of humans in the population is Nh = Sh + Eh + Ih + Rh. We allow the vector population to be divided into five juvenile classes representing four larval instars and one pupal stage, Ji (i = 1, 2, 3, 4, P), and an adult female class Nv. The adult female class is further divided into Susceptible, Exposed, and Infectious vectors, denoted by Sv, Ev, and Iv, respectively, and the total number of adult female vectors is Nv = Sv + Ev + Iv. The exposed adult female vector class is further divided into θ subclasses so that . The number of subclasses and thus the value of θ is dependent upon the parameterization of the relationship between EIP and temperature, as we later describe in more detail.
In the human population, we assume that the human population size, Nh, is constant since we are only considering relatively short time scales in this study. We assume all humans begin in the susceptible class. Upon being bitten by an infectious vector, susceptible humans become infected at a per capita rate , where βvh is the transmission rate of dengue from vectors to humans, which takes into account both the biting rate of mosquitoes and the probability of dengue transmission from vector to human. Once exposed, humans become infectious at a per capita rate σh, where is the average intrinsic incubation period. Infectious humans recover at a per capita rate γh, where is the average duration of infectiousness. In this study, we are interested in outbreaks of a single serotype of dengue over a relatively short time scale (one year), so we only consider a single serotype of dengue, and we assume that once humans have recovered, they cannot be infected again. This assumption is reasonable for the scenarios considered within this work given evidence of temporary cross-immunity among dengue serotypes and long-term immunity within a single serotype (Guzmán and Kourí, 2002).
We let λv be the per capita recruitment rate of juveniles. Note that because the first juvenile class is taken to be first instar larvae, λv is the per capita rate at which adult females give birth to first instar larvae. Egg laying and survival to the larval stage is implicitly accounted for in this value. Juveniles die at a per capita rate (aJL)b−1 + μJ, where the first term represents density-dependent mortality and the latter term represents density-independent mortality. In the density-dependent mortality term, a and b determine the strength of density-dependent mortality and, along with other parameters, determine the equilibrium population size, and JL=J1+J2+J3+J4. We discuss these parameters further in the Model Calibration section below. Although density dependence may have impacts on other life history characteristics and the adult population, we assume here that larval density only directly impacts larval survival (Walsh et al., 2012; Couret et al., 2014; Dye, 1984). Juveniles progress through each of the five juvenile stages at a temperature-dependent per capita rate νi(T) (i = 1, 2, 3, 4, P). Adult vectors emerge from the pupal stage at a temperature-dependent per capita rate 0.5νP(T), where the multiplier 0.5 accounts for the assumption that there is a 1:1 sex ratio in the vector population. Note that we only explicitly model adult female mosquitoes because males are not involved in the disease transmission cycle. Adult vectors die at a temperature-dependent per capita rate μv (T). This mortality rate is independent of infection status.
Susceptible adult vectors become infected at a per capita rate , where βhv is the transmission rate from humans to vectors, which, like βvh, takes into account the biting rate of mosquitoes and the probability of dengue transmission from humans to vectors. Once infected, vectors enter the first of the exposed classes as they begin the extrinsic incubation period (EIP). Because we assume that the EIP is gamma-distributed but we are modeling the EIP with exponential rates utilizing the “linear chain trick” ((Fargue, 1973; MacDonald, 1978)), we set the total number of exposed classes to θ which is the integer-valued shape parameter obtained from fitting a gamma distribution to data as described below. Adult vectors progress through each of the exposed subclasses at a rate . once adult vectors are infectious, we assume that they do not recover from infection before death.
Taken together, the system of differential equations that we obtain for our model is:
A description of all parameter values that we assume to be temperature-independent, together with default values, is presented in Table 1. Parameterizations of functions that determine temperature-dependent parameters are presented in Table 2.
Table 1.
Temperature-independent parameters utilized in this study. Time units for all parameters are days.
| Parameter | Description | Default value | Reference |
|---|---|---|---|
| μJ | Mortality rate of juvenile mosquitoes | 0.03 | (Rueda et al., 1990) |
| λv | Rate of production of first instar larvae (per female) | 8 | (Harrington et al., 2001; Styer et al., 2007) |
| a | Density-dependent survival parameter | 5 × 10⁻⁵ | Appendix |
| b | Density-dependent survival parameter | 3.4 | |
| r | Fraction of cases that are reported | 0.05 | (Messenger et al., 2014; Adalja et al., 2012) |
| βhv | Transmission rate from humans to mosquitoes | 0.18 | |
| βvh | Transmission rate from mosquitoes to humans | 0.18 | |
| σh | Rate at which humans become infectious after being exposed | 0.2 | (Rudolph et al., 2014) |
| γh | Rate at which humans recover from being infectious | 0.1667 | (Gubler et al., 1981; Vaughn et al., 2000) |
Table 2.
Parameters estimated for temperature-dependent functions in this study (given in Eqs. (1)–(4)). Goodness of fit measures obtained when fitting these equations are given in Table 4 of the Appendix.
| Temperature (Eq. (1)) | ||||||||
|---|---|---|---|---|---|---|---|---|
| Seasonal fluctuations only | Seasonal and diurnal fluctuations | |||||||
| City | A1 | τ1 | M1 | A2 | A1 | τ1 | M1 | A2 |
| Los Angeles | 3.7440 | 326.9474 | 17.0129 | 0 | 3.7349 | 327.5966 | 16.9841 | 3.5445 |
| Miami | 4.4346 | 338.4344 | 25.1030 | 0 | 4.4374 | 338.9933 | 25.0708 | 3.9660 |
| New Orleans | 8.5458 | 347.1740 | 21.4594 | 0 | 8.5475 | 347.6673 | 21.4192 | 4.9387 |
| San Juan | 1.7548 | 332.0313 | 27.2461 | 0 | 1.7560 | 332.5386 | 27.2208 | 3.1185 |
| Atlanta | 10.5176 | 348.5816 | 16.5292 | 0 | 10.5222 | 349.0583 | 16.4832 | 5.6628 |
| El Paso | 10.9104 | 352.2591 | 18.1170 | 0 | 10.9170 | 352.7437 | 18.0588 | 7.1621 |
| Adult Mortality (Eq. (2)) | Larval Development (Eq. (3)) | |||||||
| c2 | c1 | c0 | Stage | di, 1 | di,2 | |||
| −0.0449 | 2.1474 | −0.9722 | First Instar (i = 1) | 55.996 | 0.135 | |||
| Extrinsic Incubation Period (Eq. (4)) | Second Instar (i = 2) | 528.462 | 0.273 | |||||
| α1 | α2 | Third Instar (i = 3) | 5197.070 | 0.390 | ||||
| 5290.381 | 0.1999 | Fourth Instar (i = 4) | 305.302 | 0.201 | ||||
| Pupae (i = 5) | 50.270 | 0.122 | ||||||
2.2. Model calibration
The cities we chose for his study are locations within the distribution of Ae. aegypti or, as in the case of Atlanta, areas that would be suitable for Ae. aegypti (Hahn et al., 2016). Currently, the only cities of these six where autochthonous dengue transmission has been reported in the past decade are Miami and San Juan; however, transmission of viruses such as dengue, Zika, and chikungunya would be possible in each of these cities if the virus is imported because of the presence of Ae. aegypti and/or the presence of Ae. albopictus. Because San Juan, Puerto Rico has year-round autochthonous transmission of dengue, we include San Juan as a reference point against which we can compare the results from other cities. To do so, we utilize dengue case data collected from San Juan to calibrate the model (NOAA, 2015). The details of this process are explained in Appendix A. In short, we estimated a parameter that represents the strength of density dependence (a) in the larval mosquito population and plays a role in determining adult vector population size by fitting the model to dengue case data from San Juan and estimating a along with the initial population of susceptible humans. For this, and all model fitting conducted for this study, we utilized a nonlinear least squares method (via the function lsqnonlin in MATLAB (MathWorks, 2018)). We choose to estimate the value of a from San Juan dengue case data and utilize this value of a across populations in each of the six cities in order to maintain some consistency across the cities so that we can investigate the impacts of temperature in the absence of other influential variables such as exposure to vectors that would occur from different living conditions or human activity. We note that the density-dependent parameters a and b are closely related and estimating both parameters simultaneously from dengue case data is intractable due to structural non-identifiability (Kao and Eisenberg, 2018; Roosa and Chowell, 2019; Tuncer et al., 2016).
2.3. Temperature data
We obtained temperature data from the National Oceanic and Atmospheric Administration (NOAA) - National Centers for Environmental Information (NOAA, 2018). We calculated the longitudinal average of the mean daily temperature (across thirty years of data, 1981–2010) as well as the mean diurnal temperature range. In our dynamic model, we characterize the temperature, T, each day of the year, t, using the function
| (1) |
where M1 is the mean yearly temperature, A1 is the seasonal temperature range, τ1 is a phase-shifting parameter to capture timing of seasonality, and A2 is the diurnal temperature range. We estimated the parameter values for each city by fitting Equation (1) to the mean daily temperature profile of each city. First, we estimated these parameters in the absence of diurnal fluctuations (A2 = 0) by fitting Eq. (1) to the mean daily temperature. Then, we estimated the parameters in the presence of diurnal fluctuations by also estimating A2 and fitting Eq. (1) to the mean diurnal temperature range. The parameter values we obtained from both fitting procedures are given in Table 2. Figs. B.12 andB.13 in the Appendix show the model fits to the data.
San Juan and Miami have relatively warm temperatures year-round with mild seasonal fluctuations, although Miami has larger seasonal fluctuations than San Juan. New Orleans, El Paso, and Atlanta experience large seasonal fluctuations in temperature. Of the three, Atlanta has the coolest temperatures year round. New Orleans has the warmest temperatures (in June and July) of any of the cities we consider in this study, and El Paso experiences the greatest fluctuation from warm temperatures (July) to cool temperatures (January). Los Angeles has mild seasonal fluctuations and relatively cool temperatures year-round.
Diurnal fluctuations vary widely across all cities as well. San Juan has a relatively low diurnal temperature range (DTR) of about 6°C throughout the year. Miami and Los Angeles have a DTR of about 9 °C in the warmer months, but the DTR in Los Angeles decreases to about 5 °C in cooler months, and in Miami, the DTR decreases to about 7 °C. In New Orleans, the DTR is around 10 °C throughout the year. El Paso and Atlanta experience the greatest differences in DTR throughout the year. Atlanta has a DTR of about 10 °C in July and January-December when temperatures are warmest and coolest, respectively, but a higher DTR of around 14 °C at other times of the year. El Paso has an average DTR of around 15–16 °C between December and May (winter and spring months), but this decreases to about 13–14 °C between June and November (summer and autumn months).
2.4. Adult mortality
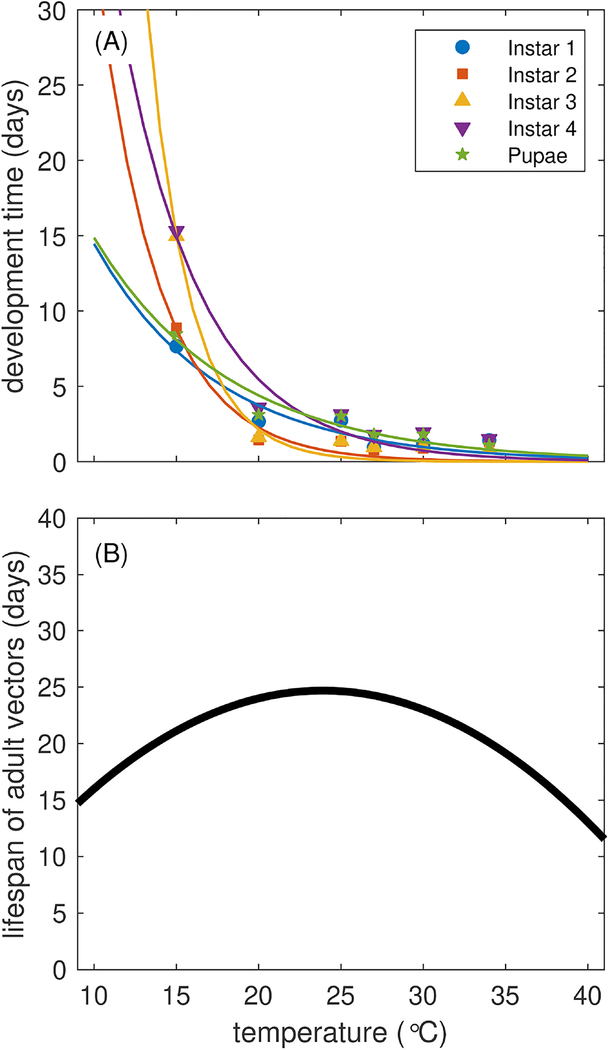
To describe daily mortality of female adult mosquitoes as a function of temperature in our model, we utilize the temperature-dependent adult mortality curve in (Brady et al., 2014), a meta-analysis of studies that observed adult Ae. aegypti mortality at different temperatures in the field and lab. We fit a quadratic function to the 50% field survival curves shown in (Brady et al., 2014), which describes the median lifespan of mosquitoes at different temperatures . Taking these values as the median and assuming an exponential distribution, we obtained the average lifespan of mosquitoes at temperatures T between 0–45 °C at intervals of 0.25 °C. Finally, we fit a quadratic function (Eq. (2)) to the average lifespan Lv(T) at each temperature T to obtain the average mortality rates , where is the estimated average lifespan at temperature T (Fig. 1B). We note that we chose quadratic equations here because the data presented in (Brady et al., 2014) appeared to be symmetric about an optimal temperature for vector lifespan. We explore the sensitivity of the parameterization of the adult vector lifespan in the appendix (Fig.C.20).
Fig. 1.
Temperature-dependent life history traits of Ae. aegypti. (A) Average larval development time as obtained from (Rueda et al., 1990). (B) Average adult vector lifespan obtained from (Brady et al., 2014).
| (2) |
2.5. Larval development time
To characterize larval development time, we fit exponential equations to data presented in (Rueda et al., 1990), in which the authors conducted a detailed study of larval development (by instar) across 6 temperatures from 15 to 34 °C. These data are presented in Fig. 1A. For each juvenile stage i, we set the rate of development to be where Di(T) is the development time of the juvenile stage at temperature T described by
| (3) |
The estimates for di,1 and di,2 are given in Table 2, and Fig. 1A shows the curves associated with each set of data.
2.6. Extrinsic incubation period
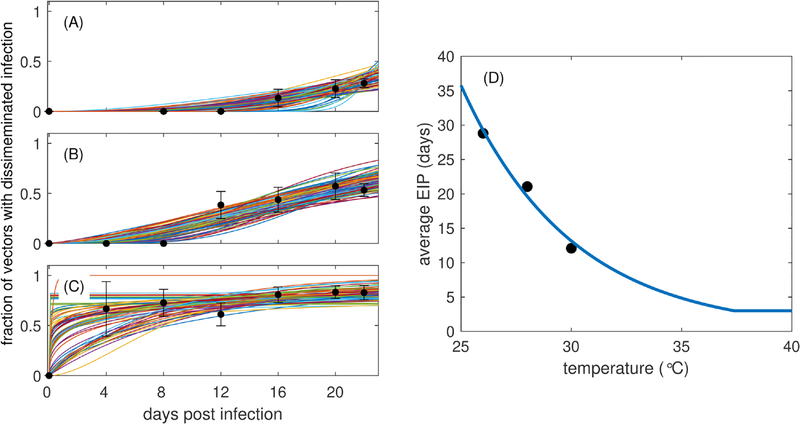
To characterize temperature-dependent EIP, we utilize data previously published in (Christofferson et al., 2016) that demonstrates the impact of dengue infection and temperature on the mortality of adult female Ae. aegypti. In that study, vectors were exposed to temperatures of 26°C, 28°C, or 30°C and tested for disseminated infection upon death. In the current study, we censored the data published in (Christofferson et al., 2016) every four days (days 4, 8, 12, 16, 20, and 22, the final time point of experiments) and counted the total number of mosquitoes that had died within the previous 4 days. We then calculated the proportion of those mosquitoes with disseminated infection to obtain an estimate of the fraction of mosquitoes with disseminated infection at each time point (see Fig. 2). At each of the three temperatures, we utilized these proportions to generate 100 binomial samples at each time point and constructed 1000 sample trajectories for the fraction of mosquitoes with disseminated infection at 4, 8, 12, 16, 20, and 22 days post infection. We assumed that these trajectories were generated from a gamma cumulative distribution function (cdf) and estimated the scale (ρ) and shape (θ) parameters for the gamma distribution for each trajectory. We calculated the mean EIP for each trajectory as ρθ and the standard deviation as . Some of the sample trajectories generated were outside of the margin of error of much of the data (see Fig. 2), so we removed outliers of the mean EIPs by only considering values that fell within the inter-quartile range (1.5(p75 − p25), where pi represents the ith percentile). We obtained the median shape parameter across temperatures (θ = 3), rounded to the nearest integer value (which is necessary for our model structure as described earlier), and recalculated the scale parameter that corresponds to that shape parameter and results in the same mean EIP for each temperature. We fit an exponential function to the mean EIP (ρθ) at each temperature T and assumed that the minimum possible EIP is 3 days (Watts et al., 1987). This resulted in the following relationship (Fig. 2D) between the temperature-dependent mean EIP, ω(T), and temperature
| (4) |
Fig. 2.
Dengue infection dissemination and average EIP at different temperatures. The fraction of total mosquitoes censored at each time point that have disseminated infection (black circles and error bars that represent mean and standard error) for three different temperatures (A) 26°C, (B) 28°C, and (C) 30°C. In each panel (A)-(C), colored lines represent 100 trajectories generated by bootstrap sampling of the means. (D) The average EIP as a function of temperature. Circles represent the means obtained from each fit of the gamma distribution to the data, and the blue curve is Eq. (4) fit to the average EIP data points.
Parameter value estimates for α1 and α2 are shown in Table 2. We note that although both the scale and shape parameters change with temperature, we chose to fix the shape parameter. Because in the full model we utilize exponential rates (that sum to a gamma-distributed rate) in our differential equations, the shape parameter determines the number of equations, which is held constant in our model formulation.
2.7. Probability of surviving the EIP
In order for a vector to successfully transmit dengue to humans, the vector must first survive the EIP. The probability that the vector survives the EIP will depend upon the adult lifespan of the vector as well as the duration of the EIP. To summarize this relationship and its impact on the potential for vectors to successfully transmit virus to humans, we approximate the probability that adult vectors survive the EIP at time t, which will be dependent on the temperature at time t, T(t), as
| (5) |
This represents the instantaneous probability of surviving the average EIP, assuming that adult mortality rates and average EIP are fixed at their values at time t. It does not take into account past and future fluctuations in either lifespan or EIP. However, given that the day-to-day changes in mean daily temperature in the model are relatively minor, this is a reasonable approximation of the probability of surviving the EIP at time t and it is sufficient to help explain the results in our study. The seasonally-varying probability of surviving the EIP helps us to understand the time of the year when we would expect to see the most transmission occurring because Ae. aegypti are living long enough to survive the EIP and transmit dengue to humans. In the appendix, we show how the probability of surviving the EIP varies with temperature (Fig. B.14), and we show comparisons of the instantaneous probability of surviving the EIP across a year when only seasonal or both seasonal and diurnal fluctuations are considered in the model (Fig.B.16).
2.8. Vector-host ratio
Another useful metric for aiding in the understanding of mosquito-borne disease dynamics is the vector-host ratio, VHR, a measure of the size of the vector population relative to that of the human of the population. VHR helps to estimate the amount of contact between mosquitoes and humans, with higher values of VHR typically being associated with higher rates of disease transmission and vice-versa. In models in which the vector and human populations do not vary, the value is calculated as
where Nv and Nh are the sizes of the total adult vector and human populations, respectively. In our model, the vector population will vary depending on larval emergence rates and adult vector mortality rates, thus the vector population size changes with time, and we calculate VHR as
2.9. Simulations
We consider a well-mixed sub-population within each of the six cities that contains 25000 people that are equally at risk of contracting dengue. By keeping population sizes equal across cities, we isolate the impacts that temperature has on dengue dynamics without the influences of potentially confounding factors such as population size and heterogeneity of exposure to vectors. We vary the day of introduction across the year to capture the role that timing of introduced cases plays in subsequent dynamics. We assume throughout that there is a 5% reporting rate of cases in each location (Shankar et al., 2018), and we present the cumulative number of reported cases that occur within a year of the initial introduction.
3. Results
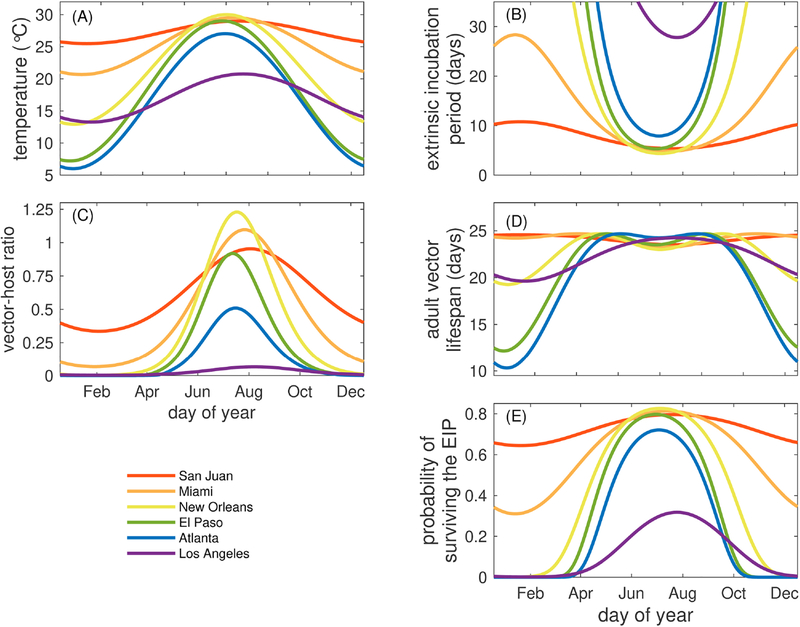
We applied city-specific seasonal temperature profiles to the temperature-dependent parameters of the transmission model and compared the differences between cities. First, we observed differences in average adult mosquito lifespan (i.e., the adult lifespan of a mosquito averaged over a cohort of mosquitoes) between the sub-tropical and tropical cities of Miami and San Juan versus the more temperate cities. In Miami and San Juan, the average adult vector lifespan remained relatively stable, varying between 23.3 and 24.7 days (Fig. 3D). More notable were the differences observed between those cities and New Orleans (19.3–24.7 days), Los Angeles (19.6–24.2 days), El Paso (12.2–24.7 days), and Atlanta (10.3–24.7 days). The times at which the minimum and maximum average adult mosquito lifespans occurred were different across all cities (Table 3). All cities except San Juan and Los Angeles had two annual peaks in adult mosquito lifespan driven by temperatures that were near the optimum temperature for the average adult lifespan (Fig. 1B).
Fig. 3.
The impacts of seasonal fluctuations of temperature on demographic, viral, and epidemiological measures. Fluctuations in the average daily temperature (T(t)) (A), average EIP (ω(T)) (B), vector-host ratio (Eq. 2.8) (C), average adult vector lifespan (Lv (T)) (D), and the instantaneous probability of surviving the EIP (Eq.(5)) (E). All parameters are the default values given in Tables 1–2.
Table 3.
List of maximum and minimum average adult vector lifespans and minimum average EIPs and the dates at which these extreme values occur.
| City | Minimum lifespan (date) | Maximum lifespan (date) | Minimum EIP (date) |
|---|---|---|---|
| Miami | 23.26 days (Jul 28) | 24.67 (Apr 11 &Nov 12) | 4.81 (Jul 28) |
| Los Angeles | 19.62 (Feb 7) | 24.25 (Aug 8) | 27.79 (Aug 8) |
| San Juan | 23.52 (Aug 3) | 24.57 (Feb 2) | 5.36 (Aug 3) |
| Atlanta | 10.31 (Jan 16) | 24.69 (Jun 1 &Sep 2) | 7.92 (Jul 17) |
| New Orleans | 19.27 (Jan 17) | 24.69 (May 5 &Oct 1) | 4.38 (Jul 19) |
| El Paso | 12.17 (Jan 12) | 24.69 (May 16 &Sep 11) | 5.33 (Jul 14) |
The vector-host ratio, an important component of the basic reproductive number of mosquito-borne diseases, varied throughout the year and was driven by the variation in mosquito development and survival. The vector-host ratio was highest in late July and early August for all cities with the exception of San Juan and Los Angeles, where the peaks were in mid-August (Fig. 3C). In general, these peaks in vector-host ratio did not correspond directly to peaks in adult mosquito lifespan (Fig. 3D) in part because the mosquito population size, and thus the vector-host ratio, is driven not only by adult mosquito survival but also by the rate of larval emergence, which is generally much faster at warmer temperatures (Fig. 1A), so the vector-host ratio is highest at times of the year when the temperature is the warmest (Fig. 3A).
The seasonal patterns of dengue EIP were also driven by the temperature profiles of each city (Fig. 3B, Table 3). The average EIP was shortest for all cities in July and August when temperatures were highest. The longest EIP for San Juan was in early February and late January for Miami. The differences in EIP across the year in the other cities are far more stark. For example, the shortest average EIP in Atlanta (7.9 days) occurs in late July while the longest average EIP is over 30 days in January. For El Paso and New Orleans, the shortest average EIP is 5.3 and 4.4 days, respectively, in July, and the longest for both cities was also over 30 days in January. In contrast, in Los Angeles, the shortest average EIP was no less than 27 days in July and August and over 30 days the rest of the year.
Finally, we investigated the seasonal probability of mosquitoes surviving the average EIP (Eq. (5), Fig. 3E). For all cities, the probability of surviving the average EIP was highest in July and August and lowest in January and February. The seasonally-varying probability of surviving the average EIP indicates that environmental temperatures render San Juan permissible for DENV transmission via Ae. aegypti all year, consistent with epidemiological data (NOAA, 2018). Further, it illustrates that dengue transmission is highly unlikely between November and March in all of the other U.S. cities considered here, excepting only Miami.
3.1. Seasonal variation of dengue dynamics
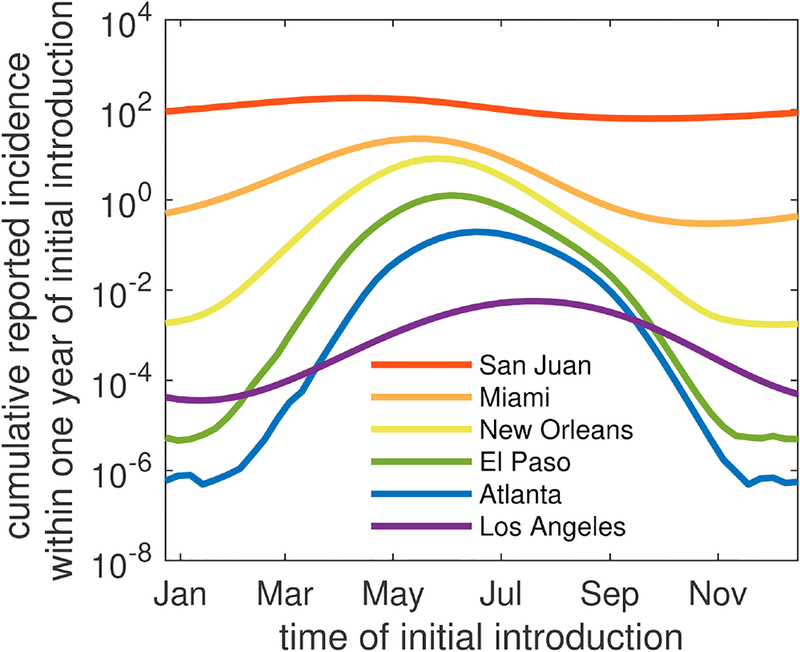
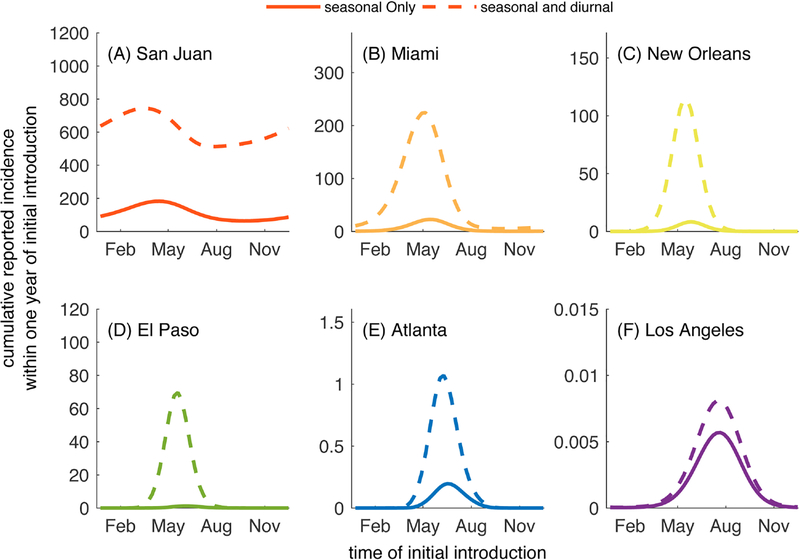
Accounting for this temperature dependence, we demonstrate how dengue dynamics vary seasonally among these 6 U.S. cities in Fig. 4 and Figure B.15. Regardless of the timing of introduction of an index case, Los Angeles and Atlanta were not predicted to have any reported cases. Alternatively, El Paso was predicted to support local transmission enough to produce 1–2 reported cases when the index case was introduced in May or July. In New Orleans, relatively small outbreaks of fewer than 10 reported cases occurred following initial introduction in months between April and August, with introductions in early June leading to the largest number of locally-acquired cases. In Miami, introductions year round led to at least one reported locally-acquired case, and out-breaks of 10–25 reported cases occurred when the index case arrived between April and mid-July. Index case introductions in May resulted in the largest outbreaks. Again, consistent with year-round transmission in San Juan, our model predicted the largest number of cases given virus introductions in early May and the fewest number of reported cases following introductions in early October.
Fig. 4.
Cumulative number of cases reported within one year following an initial introduction on the day listed on the horizontal axis. A log10 scale is used to emphasize comparisons among cities. Note that the curves in this figure are shown in a linear scale below as part of Fig. 5. All parameters are the default values given in Tables 1–2.
3.2. Inclusion of diurnal temperature fluctuations
When we added the increased granularity of diurnal temperature fluctuations, the variation in daily temperature interacts with the temperature-dependent parameters and, overall, results in longer vector lifespans and shorter EIPs than would be observed under assumptions of fixed daily temperatures in part because diurnal fluctuations lead to portions of each day to be at higher temperatures than the daily average. In general, the inclusion of diurnal fluctuations in temperature leads to longer chains of transmission or larger outbreaks than when temperature varied only seasonally (Fig. 5).
Fig. 5.
Cumulative number of cases reported following a single introduction on the day given on the horizontal axis in the presence of seasonal temperature fluctuations (solid line) and seasonal and diurnal fluctuations (dashed line). All parameters are the default values listed in Tables 1. Parameter values for the different temperature characterizations are given in Table 2.
In Miami and San Juan, diurnal fluctuations led to a higher total number of reported cases regardless of the time of year of the initial introduction (Fig. 5A,B). The magnitude of the increase in reported cases was similar year round in San Juan, but the timing of introduction that led to the greatest number of cases shifted from mid May (seasonal fluctuations only) to late April (inclusion of diurnal fluctuations). In Miami, there was a difference in both the magnitude of the increase in cases (largest for introductions in May) and the timing of introduction corresponding to the largest outbreaks, which moved from late May (seasonal) to mid May (seasonal + diurnal).
The impacts of diurnal fluctuations could be particularly important in cities such as El Paso and New Orleans where outbreaks of at most 70 and 115 reported cases are predicted, respectively, when diurnal fluctuations are accounted for, whereas fewer than 10 cases (1 and 8 cases, respectively) are predicted when only seasonal variation is considered (Fig. 5C–D). Los Angeles was not predicted to support transmission under either set of conditions, and Atlanta experienced small chains of transmission when diurnal fluctuations were included at times when there were no cases expected when only seasonal fluctuations were considered (Fig. 5E–F).
3.3. Climate change and dengue dynamics
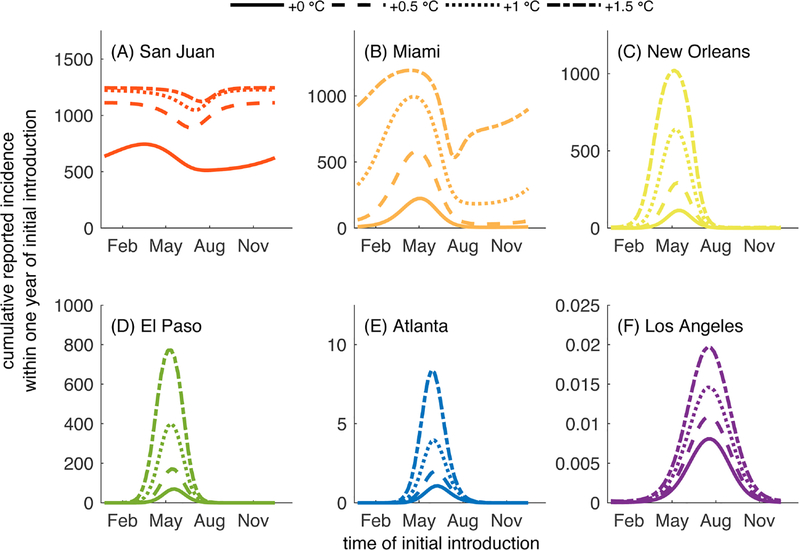
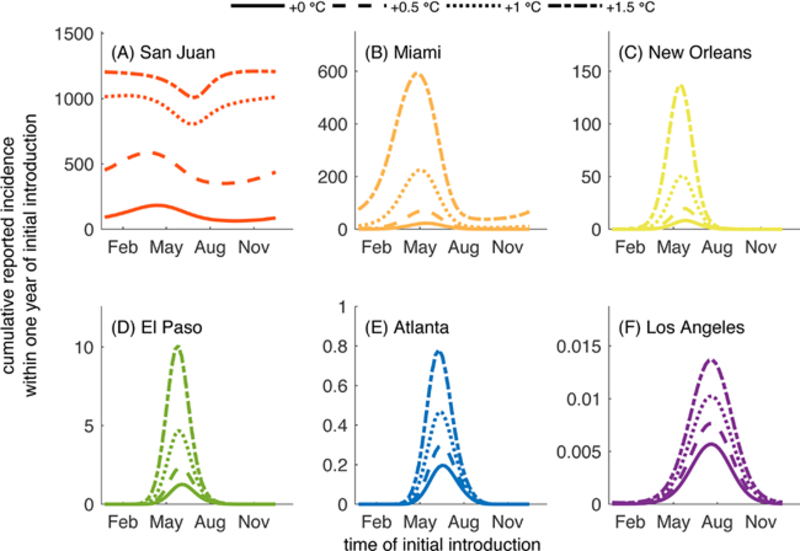
Having demonstrated the importance of including seasonal and diurnal temperature fluctuations for the predicted dynamics of DENV transmission in Ae. aegypti, we investigated the potential impacts of rising temperatures on these dynamics. Specifically, we simulated scenarios in which the average yearly temperature of each city (M1 in Eq.(1)) increased by 0.5°C - 1.5°C with diurnal fluctuations included (Fig. 6). The choice of this range of increases in temperatures is motivated by predictions published in the 2013 climate change report of the Intergovernmental Panel on Climate Change (IPCC) (IPCC, 2013). The IPCC report predicts that global surface temperatures could increase by 0.49 − 2.37°C above the 1986–2005 average in the next thirty years depending on the rate of emission of greenhouse gases (IPCC, 2013). The IPCC report considers four scenarios considered to be from best to worst case defined by representative concentration pathways (RCP) that characterize rates and peaks of greenhouse gas emissions through the year 2100 (IPCC, 2013; Meinshausen et al., 2011). These scenarios are (with 5th-95th percentiles): RCP2.6 (0.49 − 1.65°C increase), RCP4.5 (0.84 − 1.97°C), RCP6.0 (0.69 − 1.81°C), and RCP8.5(1.20 − 2.37°C) (IPCC, 2013; Meinshausen et al., 2011). Each of the values we consider within this analysis fall within the range of these four scenarios, with an increase of 0.5°C being representative of a best case scenario, and an increase of 1.5°C being representative of a worse case scenario. In the Appendix, we show results of additional investigations of the impacts of increases in variability in temperature as well as increased average temperatures in the absence of diurnal fluctuations. Those results are presented in Figs. B.1–B.18.
Fig. 6.
Cumulative number of cases reported following a single introduction on the day given on the horizontal axis under current average yearly temperatures (solid line) and when average yearly temperatures are increased by 0.5 °C (dashed line), 1 °C (dotted line), or 1.5 °C (dash-dotted line). All parameters are the default values listed in Tables 1–2. Average yearly temperatures (M1 in the top half of Table 2) are increased by the values given in the legend of this figure.
Increases in average temperature had a significant impact on the number of reported cases in most of the six cities we considered. The only exception is Los Angeles, where increases of up to 1.5° C only led to slight increases in the cumulative number of reported cases. In Miami, the total number of reported cases following introductions in May more than doubled when average temperatures were increased by 0.5° C and were increased by an order of magnitude when average temperatures were increased by 1.5° C. Regardless of the time of the initial introduction in Miami, initial cases led to outbreaks when average temperatures were increased by 1° C or more, even when no trans-mission or only small chains of transmission occurred under current average temperatures (such as in the months after August). In San Juan, increases in average temperatures of 0.5° C led to about 1.5–2 times more reported cases following introductions throughout the year, with the largest differences being observed following introductions in late August and early September. An increase of 1.5° C led to an outbreak that included almost the entirety of the population regardless of the timing of the introduction of the index case.
In New Orleans and El Paso, increases in average temperatures had profound effects on the number of cases reported following an initial case, particularly during the time between mid-April and early August. An increase in average temperature of 0.5° C led to more than double the number of cases occurring following introductions in May for both cities, and increases of up to 1.5° C led to about ten times as many cases occurring in New Orleans and eight times as many cases occurring in El Paso during May (all compared to the approximately 100 cases expected in both cities following introductions in May under current average temperatures). In Atlanta, the impact of temperature increases was minimal, with only slightly larger chains of transmission occurring following introductions from May to Early August when warmer average temperatures were increased.
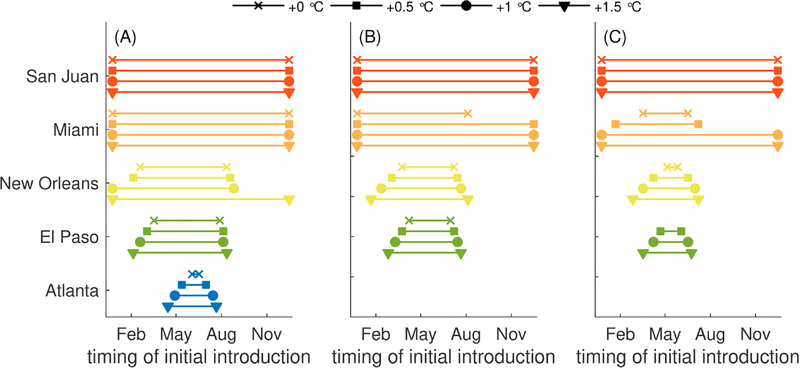
Increases in temperature could have important impacts not only on the number of dengue cases that occur, but also on the period of the year during which introductions lead to local transmission and potentially large outbreaks is also significantly impacted (Fig. 7). We define a “window of risk” for the occurrence of 1, 10, or 100 reported cases following an introduction of an index case as the duration of the year at which an introduction leads to a single, 10, or 100 reported cases. The window of risk when temperatures are increased is noticeably larger in Miami, particularly for larger outbreaks (of 100 or more cases), where under current temperatures the window of risk of outbreaks over 100 people would be between April and June but with an increase of 1 or 1.5 °C, the window of risk expands to the entire year. In New Orleans and El Paso, the windows of risk for local transmission and outbreaks expanded symmetrically beyond the current windows of risk, gaining just less than a month with each increase of 0.5 °C in average temperature. One exception is the window of risk for local transmission in New Orleans, which expanded substantially to the entire year when average temperature was increased from 1 °C warmer to 0.5 °C warmer. In Atlanta, the window of risk for local transmission increased slightly with each 0.5 °C increase in average temperature, but the window of risk did not change for larger chains of transmission or outbreaks.
Fig. 7.
Timing of the initial introduction that leads to reported outbreak sizes of greater than (A) 1, (B) 10, or (C) 100 total cases under three different average temperature assumptions: current temperatures, and when average yearly temperatures are increased by 0.5 °C, 1 °C, or1.5 °C. All parameters are the default values listed in Tables 1–2. Average yearly temperatures (M1 in the top half of Table 2) are increased by the values given in the legend of this figure. Note that Los Angeles was excluded from this analysis since none of these scenarios led to more than one case.
4. Discussion
This study provides important insights into the role of temperature in driving the emergence and spread of dengue in U.S. cities, and highlights the impact of incorporating temperature-driven heterogeneity into Ae. aegypti dynamics. While many studies have demonstrated the importance of temperature in dengue transmission (Brady et al., 2014; Messina et al., 2015; Kraemer et al., 2015; Campbell et al., 2015; Mordecai et al., 2017; Butterworth et al., 2017; Siraj et al., 2017; Esteva and Yang, 2015; Huber et al., 2018), our study combines several temperature dependencies into a single model of emergence potential into areas where dengue transmission has not yet become endemic. Furthermore, it investigates temporally integrated impacts of temperature on mosquito life history and virus traits.
A key finding of our model is that seasonal temperature variation alone may not be sufficient to capture the nuances of dengue emergence. Uniformly, our model suggests that when diurnal fluctuations are not taken into account, the predictions of the number of cases were less than those when diurnal fluctuations are included. The difference in results between these scenarios underscores both the importance of considering the temporally integrated impacts of traits as well as the potential importance of localized transmission patterns, the latter of which could provide more specific risk assessments. Indeed, Ae. aegypti habitats are variable throughout urban areas and while some habitats may be subject to more extreme environmental fluctuations, habitats that are more sheltered, such as indoor spaces, may experience muted fluctuations. Thus, it is possible that our results, both those including fluctuations that are seasonal and diurnal as well as seasonal-only, are conservative for areas where the majority of habitats are shielded from more extreme fluctuations and therefore mosquitoes are less likely to experience the detrimental effects of extreme temperatures.
Studies explicitly investigating the impacts of seasonal and diurnal variation in temperature are relatively rare in an expanding field of work focusing on the relationship between temperature and mosquito-borne diseases. Our work follows several recent empirical and modeling studies that have investigated the impacts of temperature fluctuations on mosquito populations and mosquito-borne diseases (Beck-Johnson et al., 2017; Alto et al., 2018; Murdock et al., 2017; Carrington et al., 2013; Lambrechts et al., 2011). These studies have shown that temperature fluctuations can have a profound impact on disease trans-mission, mosquito lifespan, and vectorial capacity (Carrington et al., 2013; Lambrechts et al., 2011; Alto et al., 2018). Modeling studies have shown that excluding diurnal temperature variation and only including mean temperatures can lead to underestimating mosquito population size, the number of mosquitoes capable of transmitting pathogens, and ultimately the frequency of dengue transmission that occurs (Beck-Johnson et al., 2017; Carrington et al., 2013; Lambrechts et al., 2011). Our investigation of the impacts of diurnal and seasonal fluctuations in temperature is in agreement with much of this work and shows that even a simple treatment of the impacts of temperature on mosquito life history and dengue transmission can emphasize the importance of temperature variation on dengue transmission and spread.
When we accounted for both seasonal and diurnal variability in temperature profiles, our results showed that these temperature profiles drive the differences in the potential for dengue emergence across the year. In the sub-tropical city of Miami, the potential for emergence of dengue is likely for a large period of the year, as its temperature is relatively stable annually. Whereas, for cities with high variation between summer and winter temperatures (such as New Orleans and El Paso), there is likely to be suitability for dengue transmission for only a few months each year at current temperatures. However, as climate change and rising surface temperatures become an increasing problem, so does the risk of dengue emergence. In all cities studied, increases in 0.5 °C–1.5 °C led to an increased number of cumulative cases, suggesting longer chains of transmission relative to current conditions. This is better summarized in our description of the windows of risk, which define those times of year when introductions of dengue via index case would lead to at least 1, 10, or 100 cases (Fig. 7). In Miami, increases in 1–1.5 °C lead to more sustained transmission in the months between October-January, leading to larger numbers of cases. In New Orleans and El Paso, increases of 1–1.5 °C led to large outbreaks where only small chains of transmission might be expected under current average temperatures, and in New Orleans, the window of risk for local transmission increased dramatically when average temperature was increased by 1.5 °C.
Our study takes into account a number of simplifying assumptions that allow us to focus our investigation on the impact of temperature variability and its relationship to mosquito life history characteristics and viral incubation period on the potential for dengue emergence. We note that a number of other factors could influence the results presented within this paper, all of which provide interesting routes of further investigation. For instance, studies have shown that a number of traits, such as mosquito fecundity and egg survival, larval survival, mosquito-human contact, and dengue transmission rates are influenced by temperature. We have chosen to focus on larval development, adult longevity, and EIP in this study; however a more complex version of our model could include temperature dependence in these other traits. Another potential limitation of our study is that we have based many dynamic processes on data that are collected in static scenarios. That is, the studies investigating the role of temperature in the various parts of the dengue transmission cycle were studying the impacts of a constant temperature on mosquito life history or viral traits, and we have developed a model that takes into account the impacts of variation in temperature on these traits and dengue transmission by extrapolating from these various studies. Unfortunately, empirically investigating the impacts of temperature variation on traits is difficult and few studies of this nature exist (Lambrechts et al., 2011; Carrington et al., 2013; Alto et al., 2018; Murdock et al., 2017), so the assumption that these observations under static conditions can be extrapolated to investigate dynamic scenarios was necessary. Even though investigating the impacts of dynamic temperatures on dengue virus and mosquito life history traits is challenging, it is important to do so in order to fully understand the relationship between temperature and dengue transmission.
Our study underscores the importance of temperature in current and future patterns of dengue transmission and emergence; however temperature is just one of many climatological factors that have been shown to have an influence on mosquito life history characteristics and dengue transmission. For instance, humidity and precipitation are known to have impacts on the dengue transmission cycle (Thu et al., 1998; Wu et al., 2007; Stewart Ibarra et al., 2013; Campbell et al., 2013), and it is expected that climate change will not only lead to increases in temperature, but also changes in humidity, precipitation patterns, and fluctuations of temperature, all of which are likely to play a role in the dengue transmission cycle (Easterling et al., 2000; Hales et al., 2002; Rahmstorf and Coumou, 2011; Rummukainen, 2012). However, temperature is inherently tied to these other variables, and the focus of much of the work investigating potential impacts of climate change on infectious diseases has been on temperature because influences of temperature on the mosquito-borne disease cycle are among the most thoroughly studied (Mordecai et al., 2017; Johnson and Ritchie, 2015; Siraj and Perkins, 2017).
Studies such as the present one are important to understand the impacts on dengue transmission of individual factors, in this case temperature, when considered in isolation from the myriad of other potential influences. The results of our study highlight the importance of accounting for both seasonal and diurnal temperature-dependence in the life traits and infection kinetics of Ae. aegypti. Importantly, our results can be used to inform risk assessment and proactive planning in cities where the risk of dengue importation is high. Our description of the windows of emergence risk have operational relevance as it can be used to inform resource allocation planning of vector control and public health intervention programs.
Supplementary Material
Acknowledgments
The authors would like to thank Christopher Mores for input on an early version of this project. We would also like to thank four anonymous reviewers whose constructive input improved this manuscript. This work was supported by National Institutes of Health/National Institute of General Medical Sciences R01GM122077 and NIH/NIGMSU01GM097661.
Appendix A.
Parameter selection
Model predictions throughout this work are based upon parameters that we obtained largely from published literature (refer to citations in the main text). However, we condition much of this work based upon observations in San Juan, Puerto Rico, where dengue has been endemic for a number of decades (NOAA, 2018; Rigau-Pérez et al., 2002). We utilized dengue case data from 1999–2008 to estimate the value of the density-dependent parameter a, which, together with other demographic parameters, determines the size of the vector population. By approximating a for San Juan and utilizing this value of a for the other five cities, we are able to maintain consistency in a baseline vector population size across all cities. The term “baseline” here indicates that if all explicit temperature-dependence was removed from the model, the vector population size would be the same in each city. Because our aim here is to look at the influence of temperature in the absence of other potentially confounding variables, it is important to have this consistency in vector population demographics.
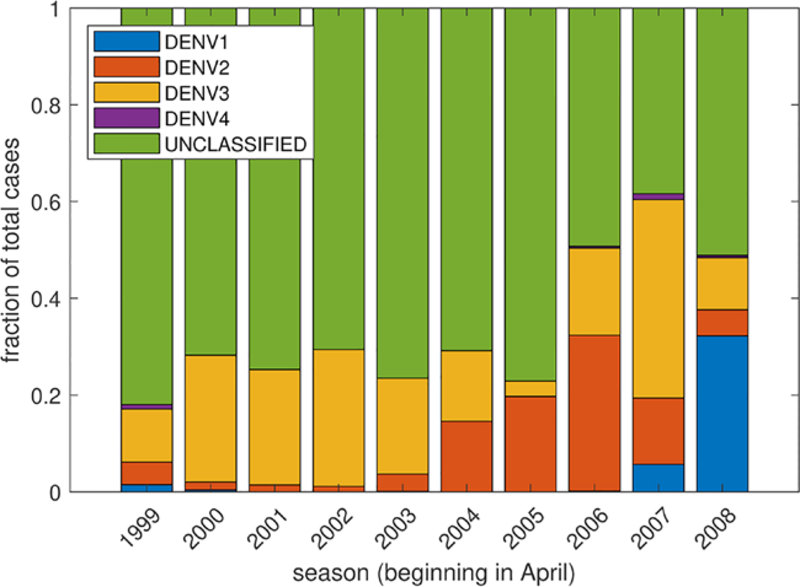
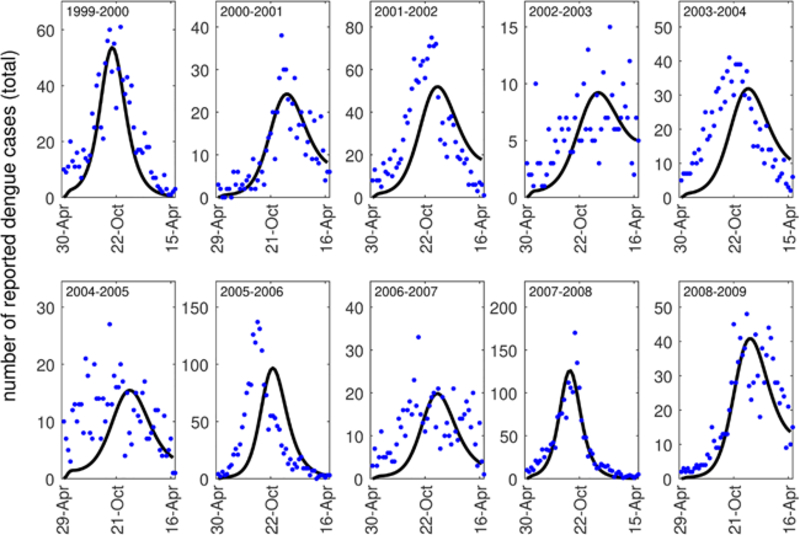
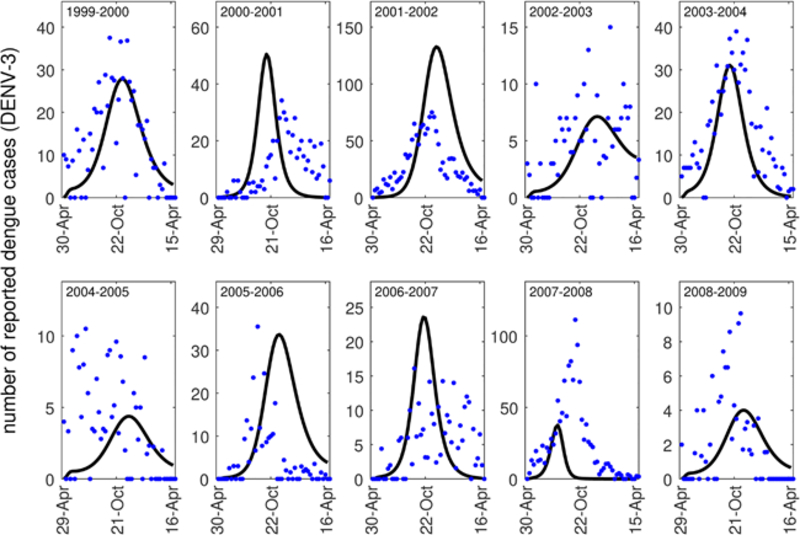
The San Juan dengue case data that we utilize contains the number of reported dengue cases from the 1999–2000 dengue season through the 2008–2009 dengue season (NOAA, 2018). The dengue season as defined by the data begins at the end of April each year. This data contains the number of dengue cases reported each week, and some, but not the majority, of the cases are classified by serotype (DENV1, DENV2, DENV3, DENV4) (see Fig. A.8). When the cases were classified by serotype, the predominant serotype in most years was DENV3. For this reason, we chose to fit our model to the total number of reported dengue cases or the total number of DENV3 cases, but otherwise did not consider stratification by serotype. We note that when many of the cases in a season were stratified by type, each of the outbreaks was typically dominated by a single serotype (Fig. A.8). When we considered stratification by serotype in these years, our results did not differ substantially.
Fig. A.8.
The fraction of each serotype of cases among all cases reported in (NOAA, 2018) between 1999–2008.
To estimate the value of a, we fit weekly counts of reported cases from our model parameterized for average daily temperatures in San Juan, Puerto Rico to weekly case report data from San Juan (NOAA, 2018). As with other model fitting in this work, we utilized a nonlinear least squares approach (lsqnonlin() in MATLAB (MathWorks, 2018)). We estimate the values of both a and SH(0). We did this in order to account for variability in population susceptibility across seasons. All other parameters are those default values in Tables 1 and 2 in the main text. We show all model fits to data in Figs. A.9–A.10. For all model fitting, the initial day of introduction was taken to be near the beginning of the dengue season in San Juan (approximately day 120 or April 30 of each year), and the initial number of cases were taken to be those reported at the beginning of the season.
Fig. A.9.
Model fits (black curves) to reported dengue case data (all serotypes) each week of the dengue season in San Juan (blue dots).
We estimated these parameter values for each of the 10 seasons of the data set. We fit our model to weekly case counts of both DENV3 and the sum of all dengue cases each season as well. Ultimately, we estimated 20 sets of parameters. We note that we chose to estimate parameters from all of the serotypes together in part because the majority of cases each year were not serotyped (see Fig. A.8). For each season, we input daily average temperature values as observed during that season.
The value of a influences the total number of adult mosquitoes in a population and thus the vector-host ratio of the model. The vector-host ratio in the model will then be dependent on both a and the population of humans in addition to other demographic parameters, and the total number of cases that occur during an outbreak will also be dependent on a and the initial susceptible population of humans. In the model we present in the main text, the susceptible human population is set to 25000 people in order to maintain consistency across the six different cities we consider. To choose
Fig. A.10.
Model fits (black curves) to reported dengue case data (DENV-3) each week of the dengue season in San Juan (blue dots).
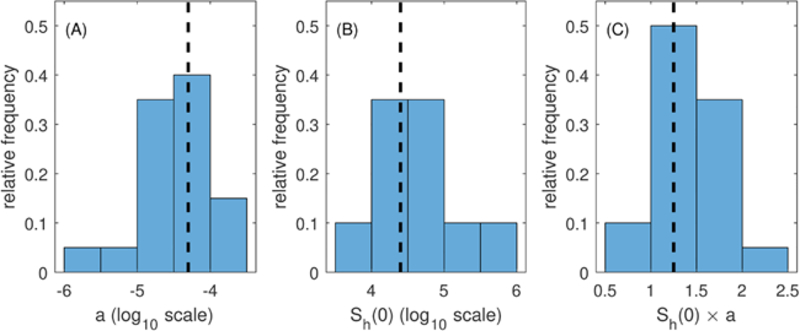
our value of a for model simulations, we have to translate the estimates of a as it relates to the initial susceptible population estimated by the model fitting process to a value of a that is appropriate for our initial susceptible human population size of 25000. We do this by first considering the range of the product of a and SH(0) estimated from model fits (Fig. A.11C). We then choose an a value for which (1) the product 25000 × a falls within the range of values estimated from the model, and (2) the total number of cases predicted by the model with that value of a fall within the range of cases that were reported in the data from San Juan. This method of estimating a follows the method of choosing plausible parameter sets described in (Drake et al., 2015) and utilized in (Robert et al., 2016). We note that many parameters such as transmission rates (βHV, βVH) are practically non-identifiable due to their relationship with other parameters (Kao and Eisenberg, 2018; Roosa and Chowell, 2019; Tuncer et al., 2016). For example, two different combinations of transmission rates and vector-host ratios could produce the same model results (Robert et al., 2016) (Table 4).
Fig. A.11.
Histograms of parameters from the parameter selection process. (A) The density dependent parameter a, (B) The initial Susceptible population, Sh(0), and (C) The product of a and Sh(0). The vertical dashed black line in each figure indicates the values used throughout this modeling study.
Table 4.
Errors obtained when fitting the equation listed in Table 2. All errors are calculated as the sum of squared residuals.
| City | Seasonal fluctuations | Seasonal and diurnal fluctuations |
|---|---|---|
| Temperature (Eq. (1)) | ||
| Los Angeles | 102.3523 | 628.9062 |
| Miami | 63.9022 | 227.3313 |
| New Orleans | 134.5618 | 213.1793 |
| San Juan | 16.0728 | 43.4333 |
| Atlanta | 123.6223 | 504.2515 |
| El Paso | 228.5677 | 592.4595 |
| Adult Mortality (Eq. (2)) | 265.6559 | |
| Larval Development (Eq. (3)) | ||
| First Instar (i = 1) | 2.9675 | |
| Second Instar (i = 2) | 3.6089 | |
| Third Instar (i = 3) | 3.6392 | |
| Fourth Instar (i = 4) | 7.9856 | |
| Pupae (i = 5) | 2.5900 | |
| Extrinsic Incubation Period (Eq. (4)) | 0.5723 |
Appendix B.
Climate change
Here we investigate the impacts of climate change in the absence of diurnal fluctuations on temperature, and we note some differences in these results from those in the main text in which diurnal fluctuations in temperature were included in our analysis of potential impacts of climate change on dengue dynamics (see Fig. 6). In general, the impacts of warmer average temperatures led to fewer reported cases overall when diurnal fluctuations in temperature were not considered (Fig. B.17). This is due, in part, to the same mechanisms underlying increases in cases when diurnal fluctuations were considered in the absence of increased temperature due to climate change (see Fig. 5). In the absence of diurnal fluctuations, the total number of reported cases that occurred in Miami after the initial introduction was much lower than that of the case with diurnal fluctuations when an increase in average temperature of 0.5–1.5 °C were considered (Fig. B.17B). In San Juan, the total number of cases expected did not differ substantially between the scenarios with and without diurnal fluctuations when average temperatures were increased by 1.5 °C; however, the total number of cases expected was much lower when diurnal fluctuations were not included for increases in average temperature of 0.5 °C and 1 °C (Fig.B.17A).
Fig. B.17.
Cumulative number of cases reported following a single introduction on the day given on the horizontal axis under current average yearly temperatures (solid line) and when average yearly temperatures are increased by 0.5 °C (dashed line), 0.5 °C (dotted line), or 1.5 °C (dash-dotted line). All parameters are the default values listed in Tables 1–2. Average yearly temperatures (M1 in the top half of Table 2) are increased by the values given in the legend of this figure.
B.1. Climate change: increases in variation
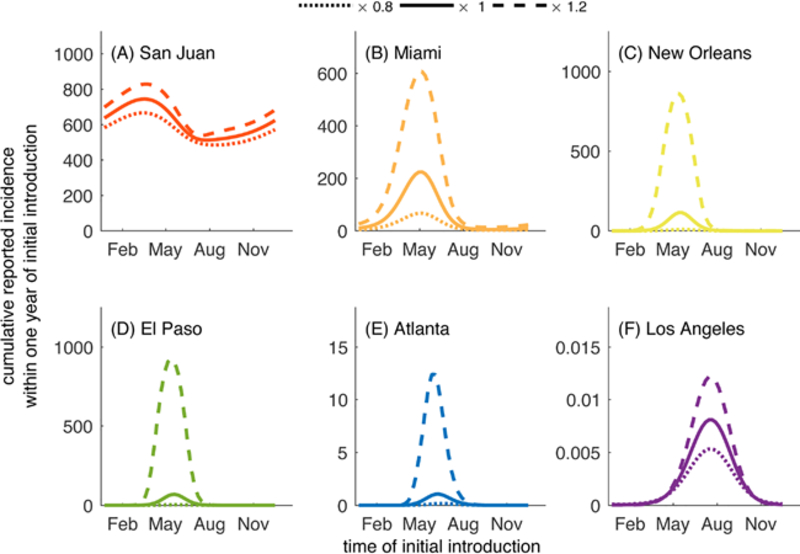
In the main text, we investigated the impacts of increases in temperature on dengue dynamics; however, increases in temperature variation may also be a result of global climate change, and could have an impact on dengue transmission (Rummukainen, 2012; Hales et al., 2002). Here we investigate the impacts of increased variation in temperature on dengue emergence and spread by modifying the parameter A1 in Eq. (1). For this section, we have included variation in diurnal fluctuations so that these results are most readily comparable to those presented in Fig. 6. Here we multiply A1 by 0.8 and 1.2 and compare the cumulative number of reported cases that occur following introductions throughout the year. We note that these values correspond to a 20% decrease and 20% increase in variation, respectively. We compare these particular scenarios in order to investigate the general trend in cases as variation increases. When variation was increased, (1.2A1), substantially larger outbreaks were observed in Miami, New Orleans, El Paso, and Atlanta compared to current variation in temperatures, although for the values of increased variation we considered here, the period of time in which importations of dengue led to local transmission and outbreaks did not change substantially in most of the cities. The predictions for our model when a 20% increase was considered were similar to those of the scenarios in which average temperatures were increased by 0.5 °C.
Fig. B.18.
Cumulative number of cases reported following a single introduction on the day given on the horizontal axis under current average yearly temperatures (solid line) and when variation in seasonal temperatures is changed by a factor of 0.8 (dotted line) and 1.2 (dashed line). These values correspond to a 20% decrease and 20% increase in variation, respectively. All parameters are the default values listed in Tables 1–2. Variation in seasonal temperatures (A1 in Table 2, Eq. (1)) are changed by multiplying A1 by the values given in the legend of this figure.
Appendix C.
Adult vector survival parameterization
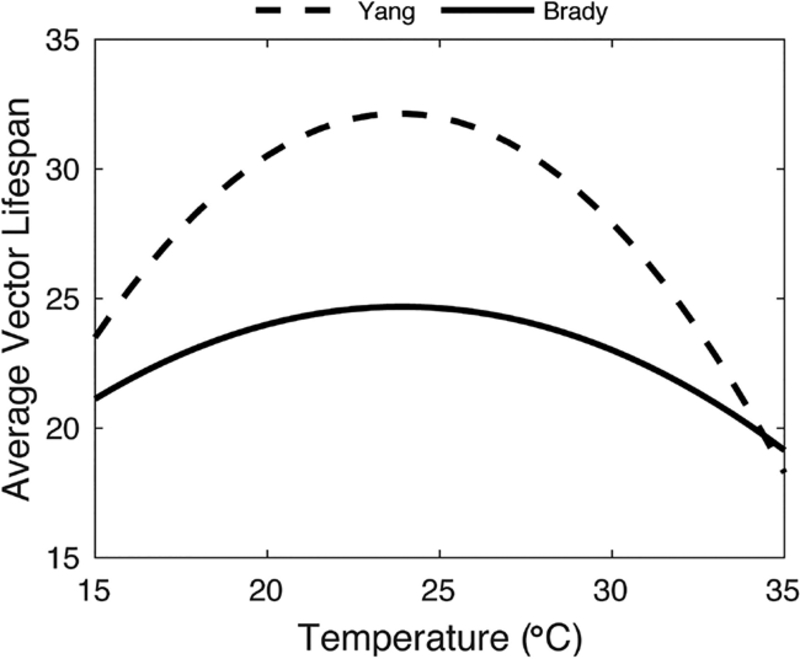
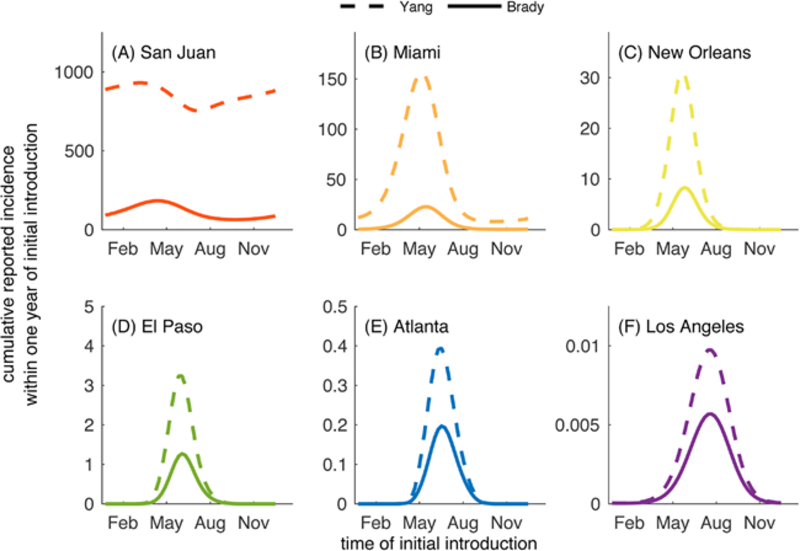
Here we briefly show how the general results of this study differ if we utilize a different characterization of average adult vector lifespan as it relates to temperature. We compared the cumulative reported incidence within a year of initial introduction of dengue when adult vector survival was described by the curves given in Fig. C.19. One curve was taken from a meta-analysis of temperature-dependent survival for Ae. aegypti in the field (Brady et al., 2014), and the other was taken from a study of temperature-dependent survival in a lab setting (Yang et al., 2009). In general, the number of cases expected following an initial introduction was much greater when survival was characterized from the laboratory data than those expected when survival was characterized from the field data (Fig. C.20). In some cases the difference was relatively minor (El Paso, Atlanta, and Los Angeles), but the difference in survival characterizations led to around five times as many cases in San Juan when survival was characterized from the laboratory data versus the field data and in some cases almost six times as many cases in Miami. This emphasizes that the results we obtained using the adult vector lifespan estimated from (Brady et al., 2014) are relatively conservative when compared to those that could be obtained by using the adult vector lifespan estimated from (Yang et al., 2009).
Fig. C.19.
Two potential characterizations of average adult vector lifespan as they relate to temperature. The solid curve is obtained from (Brady et al., 2014) and is used throughout this work. The dashed curve is obtained from (Yang et al., 2009).
Fig. C.20.
Cumulative number of cases reported following a single introduction on the day given on the horizontal axis when adult vector survival was desribed by (Brady et al., 2014) (solid line) or (Yang et al., 2009) (dashed line). All parameters are the default values listed in Tables 1–2. For these simulations, temperature varies seasonally only.
Appendix D.
Supplementary Data
Supplementary data associated with this article can be found, in the online version, at https://doi.org/10.1016/j.epidem.2019.05.003.
References
- Adalja AA, Sell TK, Bouri N, Franco C, 2012. Lessons Learned during Dengue Outbreaks in the United States 18, 608–614. [DOI] [PMC free article] [PubMed] [Google Scholar]
- Alto BW, Wiggins K, Eastmond B, Ortiz S, Zirbel K, Lounibos LP, 2018. Diurnal temperature range and chikungunya virus infection in invasive mosquito species. J. Med. Entomol 55, 217–224. [DOI] [PubMed] [Google Scholar]
- Beck-Johnson LM, Nelson WA, Paaijmans KP, Read AF, Thomas MB, Bjørnstad ON, The effect of temperature on Anopheles mosquito population dynamics and the potential for malaria transmission, PLoS ONE 8 (2013). [DOI] [PMC free article] [PubMed] [Google Scholar]
- Beck-Johnson Lindsay M., Nelson William A., Paaijmans Krijn P., Read Andrew F., Thomas Matthew B., Bjornstad ON, 2017. The importance of temperature fluctuations in understanding mosquito population dynamics and malaria risk. Royal Society Open Science 4, 160969. [DOI] [PMC free article] [PubMed] [Google Scholar]
- Beserra EB, Fernandes CRM, Silva S.A.d.O., da Silva LA, dos Santos JW, 2009. Efeitos da temperatura no ciclo de vida, exigências térmicas e estimativas do número de geraç oes anuais de Aedes aegypti (Diptera, Culicidae). Iheringia. Série Zoologia 99, 142–148. [Google Scholar]
- Blanford JI, Blanford S, Crane RG, Mann ME, Paaijmans KP, Schreiber KV, Thomas MB, 2013. Implications of temperature variation for malaria parasite development across Africa. Sci. Rep 3, 1–11. [DOI] [PMC free article] [PubMed] [Google Scholar]
- Brady OJ, Johansson MA, Guerra CA, Bhatt S, Golding N, Pigott DM, Delatte H, Grech MG, Leisnham PT, Maciel-de Freitas R, Styer LM, Smith DL, Scott TW, Gething PW, Hay SI, 2013. Modelling adult Aedes aegypti and Aedes albopictus survival at different temperatures in laboratory and field settings. Parasites Vectors 6, 351. [DOI] [PMC free article] [PubMed] [Google Scholar]
- Brady OJ, Golding N, Pigott DM, Kraemer MU, Messina JP, Reiner RC, Scott TW, Smith DL, Gething PW, Hay SI, 2014. Global temperature constraints on Aedes aegypti and Ae. albopictus persistence and competence for dengue virus transmission. Parasites Vectors 7, 338. [DOI] [PMC free article] [PubMed] [Google Scholar]
- Butterworth MK, Morin CW, Comrie AC, 2017. An analysis of the potential impact of climate change on dengue transmission in the southeastern United States. Environ. Health Perspect 125, 579–585. [DOI] [PMC free article] [PubMed] [Google Scholar]
- Byttebier B, Majo MSDE, Fischer S, Hatching Response of Aedes aegypti (Diptera: Culicidae), Eggs at Low Temperatures: Effects of Hatching Media and Storage Conditions (2014) 97–103. [DOI] [PubMed] [Google Scholar]
- Campbell KM, Lin CD, Iamsirithaworn S, Scott TW, 2013. The Complex Relationship between Weather and Dengue Virus Transmission in Thailand. Am. J. Trop. Med. Hygiene 89, 1066–1080. [DOI] [PMC free article] [PubMed] [Google Scholar]
- Campbell LP, Luther C, Moo-llanes D, Ramsey JM, Danis-lozano R, Peterson AT, 2015. Climate change influences on global distributions of dengue and chikungunya virus vectors [DOI] [PMC free article] [PubMed]
- Carbajo AE, Cardo MV, Vezzani D, 2012. Is temperature the main cause of dengue rise in non-endemic countries? The case of Argentina. Int. J. Health Geogr 11, 1–11. [DOI] [PMC free article] [PubMed] [Google Scholar]
- Carrington LB, Armijos MV, Lambrechts L, Barker CM, Scott TW, Effects of Fluctuating Daily Temperatures at Critical Thermal Extremes on Aedes aegypti Life-History Traits 8 (2013). [DOI] [PMC free article] [PubMed] [Google Scholar]
- Chan M, Johansson MA, 2012. The incubation periods of Dengue viruses. PLoS One 7, e50972. [DOI] [PMC free article] [PubMed] [Google Scholar]
- Christofferson RC, Mores CN, Wearing HJ, 2016. Bridging the gap between experimental data and model parameterization for chikungunya virus transmission predictions. J. Infect. Dis 214, S466–S470. [DOI] [PMC free article] [PubMed] [Google Scholar]
- Christofferson RC, 2016. Zika virus emergence and expansion: Lessons learned from dengue and chikungunya may not provide all the answers. Am. J. Trop. Med. Hygiene 95, 15–18. [DOI] [PMC free article] [PubMed] [Google Scholar]
- Couret J, Benedict MQ, 2014. A meta-analysis of the factors influencing development rate variation in Aedes aegypti (Diptera: Culicidae). BMC Ecol 14, 3. [DOI] [PMC free article] [PubMed] [Google Scholar]
- Couret J, Dotson E, Benedict MQ, 2014. Temperature, Larval Diet, and Density Effects on Development Rate and Survival of Aedes aegypti (Diptera: Culicidae). PLoS ONE 9, e87468. [DOI] [PMC free article] [PubMed] [Google Scholar]
- Dick OB, San Martín JL, Montoya RH, Del Diego J, Zambrano B, Dayan GH, 2012. The history of dengue outbreaks in the Americas. Am. J. Trop. Med. Hygiene 87, 584–593. [DOI] [PMC free article] [PubMed] [Google Scholar]
- Drake JM, Kaul RRB, Alexander LW, O’Regan SM, Kramer AM, Pulliam JT, Ferrari MJ, Park AW, 2015. Ebola Cases and Health System Demand in Liberia. PLoS Biol 13, 1–20. [DOI] [PMC free article] [PubMed] [Google Scholar]
- Dye C, 1984. Models for the Population Dynamics of the Yellow Fever Mosquito, Aedes aegypti. J. Anim. Ecol 53, 247. [Google Scholar]
- Easterling DR, Meehl GA, Parmesan C, Changnon SA, Karl TR, Mearns LO, 2000. Climate Extremes: Observations. Modeling, and Impacts 289, 2068–2075. [DOI] [PubMed] [Google Scholar]
- Estallo EL, Carbajo AE, Grech MG, Frías-Céspedes M, López L, Lanfri MA, Ludue na-Almeida FF, Almirón WR, 2014. Spatio-temporal dynamics of dengue 2009 outbreak in Córdoba City, Argentina. Acta Tropica 136, 129–136. [DOI] [PubMed] [Google Scholar]
- Esteva L, Yang HM, 2015. Assessing the effects of temperature and dengue virus load on dengue transmission. J. Biol. Syst 23, 1550027. [Google Scholar]
- Fargue D, Reducibilite des systemes hereditaires a des systemes dynamiques, Comptes Rendus de l’Academie des Sciences - Series I - Mathematics B277 (1973) 471–473. [Google Scholar]
- Florida Department of Health, Mosquito-borne Disease Surveillance, http://www.floridahealth.gov/diseases-and-conditions/mosquito-borne-diseases/surveillance.html, Accessed: 2018-10-01 2018.
- Gething PW, Boeckel TPV, Smith DL, Guerra CA, Patil AP, Snow RW, Hay SI, 2011. Modelling the global constraints of temperature on transmission of Plasmodium falciparum and P. vivax. Parasites Vectors 4, 1–11. [DOI] [PMC free article] [PubMed] [Google Scholar]
- Gjenero-Margan I, Aleraj B, Krajcar D, Lesnikar V, Klobučar A, Pem-Novosel I, Kurečić-Filipović S, Komparak S, Martić R, Duričić S, Betica-Radić L, Okmadžić J, Vilibić-Čavlek T, Babić-Erceg A, Turković B, Avšić-Županc T, Radić I, Ljubić M, Šarac K, Benić N, Mlinarić-Galinović G, 2011. Autochthonous dengue fever in Croatia, August-September 2010. Eurosurveillance 16, 1–4. [PubMed] [Google Scholar]
- Gubler DJ, Suharyono W, Tan R, Abidin M, Sie A, 1981. Viraemia in patients with naturally acquired dengue infection. Bull. World Health Org 59, 623–630. [PMC free article] [PubMed] [Google Scholar]
- Gubler DJ, 1998. Resurgent vector-borne diseases as a global health problem. Emerging Infect. Dis 4, 442–450. [DOI] [PMC free article] [PubMed] [Google Scholar]
- Gubler DJ, 2002. Epidemic dengue/dengue hemorrhagic fever as a public health, social and economic problem in the 21st century. Trends Microbiol 10, 100–103. [DOI] [PubMed] [Google Scholar]
- Gubler DJ, 2009. Vector-borne diseases. Revue scientifique et technique (International Office of Epizootics) 28, 583–588. [DOI] [PubMed] [Google Scholar]
- Guzmán MG, Kourí G, 2002. Dengue: An update. Lancet Infect. Dis 2, 33–42. [DOI] [PubMed] [Google Scholar]
- Hahn MB, Eisen RJ, Eisen L, Boegler KA, Moore CG, Mcallister J, Savage HM, Mutebi J-P, Rapid Communication Reported Distribution of Aedes (Stegomyia) aegypti and Aedes (Stegomyia) albopictus in the United States, 1995–2016 (Diptera: Culicidae) (2016) 1–7. [DOI] [PMC free article] [PubMed] [Google Scholar]
- Hales S, de Wet N, Maindonald J, Woodward A, 2002. Potential effect of population and climate changes on global distribution of dengue fever: an empirical model. Lancet 360, 830–834. [DOI] [PubMed] [Google Scholar]
- Harrington LC, Edman JD, Scott TW, 2001. Why do female Aedes aegypti (Diptera: Culicidae) feed preferentially and frequently on human blood? J. Med. Entomol 38, 411–422. [DOI] [PubMed] [Google Scholar]
- Hennessey M, Fischer M, Staples JE, 2016. Zika Virus Spreads to New Areas - Region of the Americas, May 2015-January 2016. Am. J. Transplant 16, 1031–1034. [DOI] [PubMed] [Google Scholar]
- Huber JH, Childs ML, Caldwell JM, Mordecai EA, 2018. Seasonal temperature variation influences climate suitability for dengue, chikungunya, and Zika transmission. PLoS Neglected Trop. Dis 12, 1–20. [DOI] [PMC free article] [PubMed] [Google Scholar]
- IPCC, Annex II: Climate System Scenario Tables Contribution of Working Group I to the Fifth Assessment Report of the Intergovernmental Panel on Climate Change, Climate Change (2013) 1395–1446. [Google Scholar]
- Johnson BJ, Ritchie SA, 2015. The Siren’s Song: Exploitation of Female Flight Tones to Passively Capture Male Aedes aegypti (Diptera: Culicidae) 53, 245–248. [DOI] [PubMed] [Google Scholar]
- Johnston D, Viray M, Ushiroda J, Whelen AC, Sciulli R, Gose R, Lee R, Honda E, Park SY, 2016. Notes from the Field. Morbidity and Mortality Weekly Report 65, 34–35. [DOI] [PubMed] [Google Scholar]
- Kao Y. h., Eisenberg MC, 2018. Practical unidentifiability of a simple vector-borne disease model: Implications for parameter estimation and intervention assessment. Epidemics 25, 89–100. [DOI] [PMC free article] [PubMed] [Google Scholar]
- Kraemer MUG, Sinka ME, Duda KA, Mylne AWN, Shearer FM, Barker CM, Moore CG, Carvalho RG, Coelho GE, Van Bortel W, Hendrickx G, Schaffner F, Elyazar IRF, Teng H-J, Brady OJ, Messina JP, Pigott DM, Scott TW, Smith DL, Wint GRW, Golding N, Hay SI, 2015. The global distribution of the arbovirus vectors Aedes aegypti and Ae. albopictus. eLife 4, 1–18. [DOI] [PMC free article] [PubMed] [Google Scholar]
- Lafferty KD, Mordecai EA, 2016. The rise and fall of infectious disease in a warmer world 5, 1–8. [DOI] [PMC free article] [PubMed] [Google Scholar]
- Lambrechts L, Paaijmans KP, Fansiri T, Carrington LB, Kramer LD, Thomas MB, Scott TW, 2011. Impact of daily temperature fluctuations on dengue virus transmission by Aedes aegypti. Proc. Natl. Acad. Sci. U. S. A 108, 1–6. [DOI] [PMC free article] [PubMed] [Google Scholar]
- Liang G, Gao X, Gould EA, Factors responsible for the emergence of arboviruses; strategies, challenges and limitations for their control, Emerging Microbes & Infections 4 (2015) e18. [DOI] [PMC free article] [PubMed] [Google Scholar]
- MacDonald N, 1978. Time Lags in Biological Models, volume 27 Springer-Verlag, Heidelberg. [Google Scholar]
- Mackenzie JS, Gubler DJ, Petersen LR, 2004. Emerging flaviviruses: the spread and resurgence of Japanese encephalitis, West Nile and dengue viruses. Nat. Med 10, S98–109. [DOI] [PubMed] [Google Scholar]
- Marchand E, Prat C, Jeannin C, Lafont E, Bergmann T, Flusin O, Rizzi J, Roux N, Busso V, Deniau J, Noel H, Vaillant V, Leparc-Goffart I, Six C, Paty MC, 2013. Autochthonous case of dengue in France, October 2013. Eurosurveillance 18, 1–6. [DOI] [PubMed] [Google Scholar]
- Marinho RA, Beserra EB, Bezerra-gusm ao MA, Porto VDS, Olinda RA, Santos CAC, 2015. Effects of temperature on the life cycle, expansion, and dispersion of Aedes aegypti (Diptera: Culicidae) in three cities in Paraiba. Brazil 41, 1–11. [DOI] [PubMed] [Google Scholar]
- MathWorks MATLAB lsqnonlin, 2018. [Google Scholar]
- Meinshausen M, Smith SJ, Calvin K, Daniel JS, Kainuma ML, Lamarque J,Matsumoto K, Montzka SA, Raper SC, Riahi K, Thomson A, Velders GJ, van Vuuren DP, 2011. The RCP greenhouse gas concentrations and their extensions from 1765 to 2300. Climatic Change 109, 213–241. [Google Scholar]
- Messenger AM, Barr KL, Weppelmann TA, Barnes AN, Anderson BD, Okech BA, Focks DA, 2014. Serological evidence of ongoing transmission of dengue virus in permanent residents of key west, Florida. Vector Borne Zoonotic Dis. (Larchmont, N.Y) 14, 783–787. [DOI] [PubMed] [Google Scholar]
- Messina JP, Brady OJ, Pigott DM, Brownstein JS, Hoen AG, Hay SI, 2014. A global compendium of human dengue virus occurrence. Sci. Data 1, 1–6. [DOI] [PMC free article] [PubMed] [Google Scholar]
- Messina JP, Brady OJ, Pigott DM, Golding N, Kraemer MUG, Scott TW, Wint GRW, Smith DL, Hay SI, 2015. The many projected futures of dengue. Nat. Rev. Microbiol 13, 230–239. [DOI] [PubMed] [Google Scholar]
- Mordecai EA, Paaijmans KP, Johnson LR, Balzer C, Ben-Horin T, Moor E, McNally A, Pawar S, Ryan SJ, Smith TC, Lafferty KD, 2013. Optimal temperature for malaria transmission is dramatically lower than previously predicted. Ecol. Lett 16, 22–30. [DOI] [PubMed] [Google Scholar]
- Mordecai EA, Cohen JM, Evans MV, Gudapati P, Johnson R, Lippi CA, Miazgowicz K, Murdock CC, Rohr R, Ryan SJ, Savage V, Shocket MS, Ibarra AS,Thomas MB, Weikel DP, Detecting the impact of temperature on transmission of Zika, dengue, and chikungunya using mechanistic models (2017) 1–18. [DOI] [PMC free article] [PubMed] [Google Scholar]
- Murdock CC, Evans MV, Mcclanahan TD, Miazgowicz L, Tesla B, Fine-scale variation in microclimate across an urban landscape shapes variation in mosquito population dynamics and the potential of Aedes albopictus to transmit arboviral disease (2017) 1–23. [DOI] [PMC free article] [PubMed] [Google Scholar]
- Nasci RS, 2014. Movement of chikungunya virus into the Western hemisphere. Emerging Infect. Dis 20, 1394–1395. [DOI] [PMC free article] [PubMed] [Google Scholar]
- U. N. O. (NOAA), A. Adminsitration, Dengue forecasting project website, 2015. https://dengueforecasting.noaa.gov/, Accessed 2018-06-01.
- NOAA, NOAA Land-Based Station Data, 2018. https://www.ncdc.noaa.gov/data-access/land-based-station-data, Accessed 2018-04-01.
- Paaijmans KP, Blanford S, Bell AS, Blanford JI, Read AF, 2010. Influence of climate on malaria transmission depends on daily temperature variation. Proc. Natl. Acad. Sci. U. S. A 107, 15135–15139. [DOI] [PMC free article] [PubMed] [Google Scholar]
- Radke EG, Gregory CJ, Kintziger KW, Sauber-Schatz EK, Hunsperger EA, Gallagher GR, Barber JM, Biggerstaff BJ, Stanek DR, Tomashek KM, Blackmore CGM, 2012. Dengue outbreak in Key West, Florida, USA, 2009. Emerging Infect. Dis 18, 135–137. [DOI] [PMC free article] [PubMed] [Google Scholar]
- Rahmstorf S, Coumou D, 2011. Increase of extreme events in a warming world. Proc. Natl. Acad. Sci 108, 17905–17909. [DOI] [PMC free article] [PubMed] [Google Scholar]
- Reisen WK, 2013. Medical entomology - Back to the future? Infect. Genet. Evol 28, 573–582. [DOI] [PubMed] [Google Scholar]
- Rey J, 2014. Dengue in Florida (USA). Insects 5, 991–1000. [DOI] [PMC free article] [PubMed] [Google Scholar]
- Rezza G, 2014. Dengue and chikungunya: long-distance spread and outbreaks in naïve areas. Pathogens Global Health 108, 349–355. [DOI] [PMC free article] [PubMed] [Google Scholar]
- Rigau-Pérez JG, Ayala-López A, García-Rivera EJ, Hudson SM, Vorndam V, Reiter P, Cano MP, Clark GG, 2002. The reappearance of dengue-3 and a sub-sequent dengue-4 and dengue-1 epidemic in Puerto Rico in 1998. Am. J. Trop. Med. Hygiene 67, 355–362. [DOI] [PubMed] [Google Scholar]
- Robert MA, Christofferson RC, Silva NJB, Vasquez C, Mores CN, Wearing HJ, Modeling Mosquito-Borne Disease Spread in U. S. Urbanized Areas: The Case of Dengue in Miami (2016) 1–28. [DOI] [PMC free article] [PubMed] [Google Scholar]
- Roosa K, Chowell G, 2019. Assessing parameter identifiability in compartmental dynamic models using a computational approach: application to infectious disease transmission models 6, 1–15. [DOI] [PMC free article] [PubMed] [Google Scholar]
- Rudolph KE, Lessler J, Moloney RM, Kmush B, Cummings DAT, 2014. Incubation periods of mosquito-borne viral infections: a systematic review. Am. J. Trop. Med. Hygiene 90, 882–891. [DOI] [PMC free article] [PubMed] [Google Scholar]
- Rueda LM, Patel KJ, Axtell RC, Stinner RE, 1990. Temperature-dependent development and survival rates of Culex quinquefasciatus and Aedes aegypti (Diptera: Culicidae). J. Med. Entomol 27, 892–898. [DOI] [PubMed] [Google Scholar]
- Rummukainen M, 2012. Changes in climate and weather extremes in the 21st century 3 [Google Scholar]
- Shankar MB, Rodríguez-Acosta RL, Sharp TM, Tomashek KM, Margolis HS, Meltzer MI, 2018. Estimating dengue under-reporting in Puerto Rico using a multiplier model. PLOS Neglected Trop. Dis 12, e0006650. [DOI] [PMC free article] [PubMed] [Google Scholar]
- Siraj AS, Perkins TA, Assessing the population at risk of Zika virus in Asia is the emergency really over?, 2017. 6–8. [DOI] [PMC free article] [PubMed] [Google Scholar]
- Siraj AS, Oidtman RJ, Huber JH, Kraemer MUG, Brady J, Johansson MA, Perkins TA, Temperature modulates dengue virus epidemic growth rates through its effects on reproduction numbers and generation intervals (2017) 1–19. [DOI] [PMC free article] [PubMed] [Google Scholar]
- Stewart Ibarra AM, Ryan SJ, Beltrán E, Mejía R, Silva M, Mu noz Á, 2013Dengue Vector Dynamics (Aedes aegypti) Influenced by Climate and Social Factors in Ecuador: Implications for Targeted Control. PLoS ONE 8, e78263. [DOI] [PMC free article] [PubMed] [Google Scholar]
- Styer LM, Minnick SL, Sun AK, Scott TW, 2007. Mortality and reproductive dynamics of Aedes aegypti (Diptera: Culicidae) fed human blood Vector Borne Zoonotic Dis (Larchmont, N.Y.) 7, 86–98. [DOI] [PubMed] [Google Scholar]
- Tatem AJ, Huang Z, Das A, Qi Q, Roth J, Qiu Y, 2012. Air travel and vector-borne disease movement. Parasitology 139, 1816–1830. [DOI] [PubMed] [Google Scholar]
- Thu HM, Aye MK, Thein S, 1998. The effect of temperature and humidity on dengue virus propogation in Aedes aegypti mosquitoes. Southeast Asian J. Trop. Med. Public Health 29, 280–284. [PubMed] [Google Scholar]
- Tuncer N, Gulbudak H, Cannataro VL, Martcheva M, 2016. Structural and Practical Identifiability Issues of Immuno-Epidemiological Vector Host Models with Application to Rift Valley Fever. Bull. Math. Biol 78, 1796–1827. [DOI] [PubMed] [Google Scholar]
- Vaughn DW, Green S, Kalayanarooj S, Innis BL, Nimmannitya S, Suntayakorn S, Endy TP, Raengsakulrach B, Rothman AL, Ennis FA, Nisalak A, 2000. Dengue viremia titer, antibody response pattern, and virus serotype correlate with disease severity. J. Infect. Dis 181, 2–9. [DOI] [PubMed] [Google Scholar]
- Vezzani D, Carbajo AE, 2008. Aedes aegypti, Aedes albopictus, and dengue in Argentina: current knowledge and future directions 103, 66–74. [DOI] [PubMed] [Google Scholar]
- Walsh RK, Bradley C, Apperson CS, Gould F, 2012. An Experimental Field Study of Delayed Density Dependence in Natural Populations of Aedes albopictus 7, 3–8. [DOI] [PMC free article] [PubMed] [Google Scholar]
- Watts DM, Burke DS, Harrison BA, 1987. Effect of temperature on the vector efficiency of Aedes aegypti for dengue 2 virus. Am. J. Trop. Med. Hygiene 36, 143–152. [DOI] [PubMed] [Google Scholar]
- Wearing HJ, Robert MA, Christofferson RC, 2016. Dengue and chikungunya: modelling the expansion of mosquito-borne viruses into naïve populations. Parasitology 143, 860–873. [DOI] [PubMed] [Google Scholar]
- Weaver SC, Reisen WK, 2010. Present and future arboviral threats. Antiviral Res 85, 328–345. [DOI] [PMC free article] [PubMed] [Google Scholar]
- Wu PC, Guo HR, Lung SC, Lin CY, Su HJ, 2007. Weather as an effective predictor for occurrence of dengue fever in Taiwan. Acta Tropica 103, 50–57. [DOI] [PubMed] [Google Scholar]
- Yang HM, Macoris MLG, Galvani KC, Andrighetti MTM, Wanderley DMV, 2009. Assessing the effects of temperature on the population of Aedes aegypti, the vector of dengue. Epidemiol. Infect 137, 1188–1202. [DOI] [PubMed] [Google Scholar]
Associated Data
This section collects any data citations, data availability statements, or supplementary materials included in this article.


