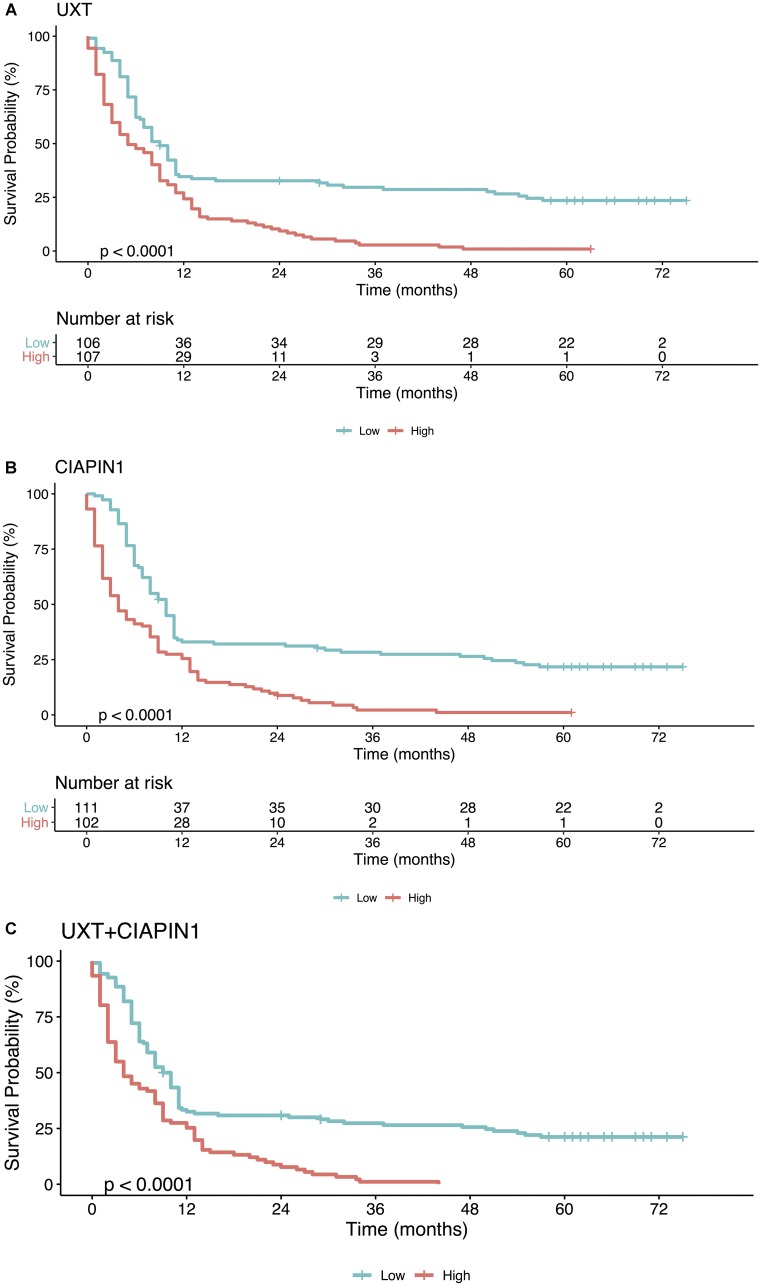
Figure 6.
Kaplan–Meier analysis of the overall survival (in months) of patients with gastric cancer as a function of (A) UXT, (B) CIAPIN1, and (C) gene UXT + CIAPIN1 expression. High expression (gene expression ≥1.5 for UXT and ≥1.7 for CIAPIN1; red line), as opposed to low expression (gene expression <1.5 for UXT and <1.7 for CIAPIN1; blue line), is strongly associated with a lower probability of survival (**** P < 0.0001).

