

Abstract
In contrast to other cancers, the presence of tumor-infiltrating lymphocytes (TILs) in uveal melanoma is associated with a poor prognosis. However, how TILs may promote disease progression and what regulates their infiltration has not yet been established. To address these clinically relevant outstanding questions, T cell, immune regulatory, and chemokine gene expression profiles of 57 enucleated uveal melanoma tumors were compared, encompassing 27 with TILs and 30 without,. Tumors with infiltrating lymphocytes expressed more CD8A mRNA, as well as IFNG, TGFB1, and FOXP3 transcripts. Other T helper associated cytokines and T helper transcription factors were not differentially expressed, nor were mediators of lymphocyte cytotoxicity. The immune inhibitors INDO, PDCA1, CTLA4, and LAG3, and the non-classical MHC Class I target of CD8+ T regulatory cells, HLA‑E, were significantly higher in tumors with TILs. FAS was also significantly higher. The C-C chemokine ligands CCL4, CCL5, and CCL20 were higher in tumors with TILs. Levels of CCL5 were most strongly correlated with levels of CD8A. Chemokine receptors were not differentially expressed. Molecular profiling of uveal melanoma tumors with TILs supports the existence of an immunosuppressive tumor microenvironment and suggests roles for CD8+ regulatory T cells, as well as specific chemokines, in fostering uveal melanoma disease progression.
Keywords: chemokines, cytokines, immune suppression, major histocompatibility complex, regulatory T cells, T helper cells
Abbreviations
- CCL20
macrophage inflammatory protein-3a/liver and activation-regulated chemokine
- CCL4
macrophage inflammatory protein-1β
- CCL5
RANTES
- CCR, CC
receptor
- CD3D
CD3Δ, molecule, delta
- CD3E
CD3ɛ molecule, epsilon
- CD3G
CD3γ molecule, gamma
- CD3Z
T cell receptor zeta chain
- CTLA4
cytotoxic T-lymphocyte antigen 4
- CXCR
(C-X-C) motif chemokine receptor
- FASLG
fas ligand
- GATA3
GATA Binding Protein 3
- GZMB
granzyme
- IFNG
interferon γ
- INDO
indolamine dehydrogenase
- LAG3
lymphocyte-activation gene 3
- MHC
major histocompatibility
- NK
natural killer
- PD-L1
programmed cell death-1 ligand
- PDCD1
programmed cell death-1
- PRF1
perforin
- PTCRA
pre T-cell antigen receptor α
- RORC
RAR-Related Orphan Receptor C
- TBX21
T-Box 21
- TCR
T cell receptor
- TGF
transforming growth factor
- TILs
tumor-infiltrating lymphocytes
- Treg
regulatory T cell
Introduction
Melanoma of the eye's uveal tract is fatal in almost half of all patients afflicted with this malignancy due to the development of metastatic disease. Unique immunological mechanisms have been implicated in regulating the clinical course of uveal melanoma. In many solid tumors, including cutaneous melanoma, the presence of tumor-infiltrating lymphocytes (TILs) is associated with a better prognosis.1-3 However, in uveal melanoma TILs correlate with the development of metastatic disease and consequently, a worse prognosis.4 Elevated tumor major histocompatibility (MHC) Class I antigen expression, which is necessary for T-cell recognition but which renders cancer cells resistant to natural killer (NK) cells, is also associated with the development of metastases in uveal melanoma.5,6 This too contrasts with cutaneous melanoma in which low expression of MHC Class I is associated with increased tumor thickness and a poorer prognosis.7
How TILs promote uveal melanoma progression has not yet been established. The eye is considered to be an “immune-privileged” site where both innate and adaptive immunity are suppressed by anatomical, physiological, and immunoregulatory mechanisms. TILs in uveal melanoma have been shown to be predominantly CD8+ T cells; the frequency of CD4+ T cells is low, and B cells and natural killer (NK) cells are only rarely identified.8-12 Uveal melanoma cells have been shown to produce several immunosuppressive factors, including indolamine 2,3-dioxygenase 1 (IDO1, better known as INDO) and transforming growth factor β (TGFβ).13,14 Reduced expression of the T cell receptor (TCR) zeta chain (CD247/CD3Z), an indicator of T-cell suppression, has also been reported among uveal melanoma TILs.9 On the contrary, CD4+FoxP3+ regulatory T (Treg) cells that suppress antitumor immune responses by a variety of mechanisms are infrequent and do not appear to have independent prognostic significance.15,16
How lymphocyte infiltration into uveal melanoma lesions is regulated has also not been established. Melanoma cells have been reported to produce both C-C and C-X-C motif chemokines, central regulators of lymphocyte trafficking.17 In cutaneous melanoma, CCL2, CCL3, CCL4, CCL5, CXCL9, and CXCL10 have been found to be preferentially expressed in tumors that contained T cells.18 A variety of chemokine receptors are also purportedly expressed by melanoma cells. In cutaneous melanoma the C-X-C chemokine receptor 3 (CXCR3) has been associated with an absence of TILs and a poorer prognosis.19 Uveal melanoma cells have been shown to express CCL2, CXCL1, CXCL8, and the chemokine receptors CCR7, CXCR1, CXCR2, and CXCR4.12,20-22 There is, however, little definitively known regarding the relationship between TILs and chemokines and their receptors in uveal melanoma tumors.
Molecular profiling techniques have been previously applied to examine intratumoral immune responses in cutaneous melanoma, lymphoma, and several carcinomas, including breast, colorectal and hepatocellular.23 Here, we apply gene expression profiling to comparatively examine uveal melanoma tumors with, and without, TILs, focusing on T-cell, immune regulatory, and chemokine-associated transcripts.
Results
Uveal melanomas from 57 enucleations, 27 (47%) with TILs as defined as >100 lymphocytes in 20 high power fields, and 30 (53%) without, were analyzed for the levels of immune associated transcripts.24 As would be expected and as shown in Figure 1, tumors with TILs expressed significantly higher levels of transcripts encoding T cell receptor (TCR) components, including pre TCR (PTCRA), CD3Δ (CD3D), CD3ε (CD3E), and CD3ZB. CD3γ (CD3G) expression was low. Tumors with TILs also expressed significantly more CD8A than CD4. In one of the 27 tumors with TILs, only CD8 transcripts were detectable and in 17 others, intensity of CD8A over CD4 was >2 fold. CD4 expression intensity was greater than CD8 in 9 tumors with TILs, >2 fold in 3. That the TILs were predominantly CD8+ and not CD4+ was confirmed by IHC (Fig. 2A). The expression of cytokines and transcription factors associated with T helper (Th) subsets is displayed in Figure 3. Significant increases in the transcript levels of the Th1-associated interferon γ (IFNG) and the immunosuppressive Treg product TGFB1 characterized tumors with infiltrating lymphocytes. The Treg-associated IL10 was very highly but not differentially expressed. Expression of the Th2-associated IL4 and IL13 and Th17-associated cytokines was low. Significant increases in the transcript levels of the Treg-associated transcription factor, FOXP3, were also observed. That tumors harboring infiltrating lymphocytes expressed FOXP3 was confirmed by IHC (Fig. 2B). The Th1-associated transcription factor TBX21 was not differentially expressed, nor were the Th2-associated GATA3 or the Th17-associated RORC. Transcripts for mediators of lymphocyte cytotoxicity, including granzyme (GZMB), perforin (PRF1), and Fas ligand (FASLG), tended to be higher in tumors with TILs, but differences did not reach statistical significance (Fig. 4). Transcript of T cell intracellular antigen 1 (TIA1), an antigen associated with cytoplasmic cytotoxic granules of T cells, also was not differentially expressed. The death receptor FAS, an indicator of cell death, including lymphocyte death was more highly expressed with TILs than without.
Figure 1.
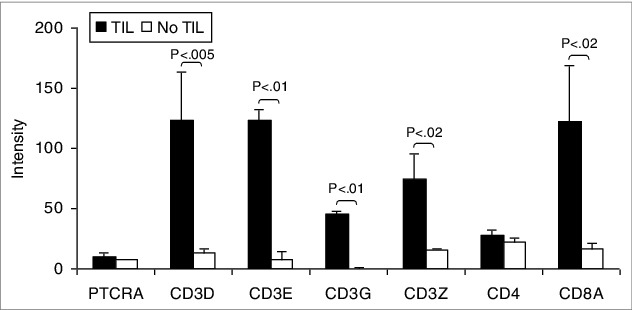
Patient uveal melanomas are heterogeneous in TCR expression correlating with lymphocytic infiltration. T-cell receptor (TCR) associated transcript expression intensity of uveal melanoma patient samples with tumor-infiltrating lymphocytes (TILs; n = 27) compared to tumors without (n = 30). RNA was extracted from tumor specimens and gene expression profiling performed using Illumina Sentrix 8 BeadChip arrays. Bars represent the mean ± SEM. Statistical analysis was performed using a 2-sided Student's t tests after log transformation and the P-values were adjusted for multiple testing according to the methods of Benjamini and Hochberg. Brackets indicate statistically significant differences between the groups with the P-value indicated above.
Figure 2.
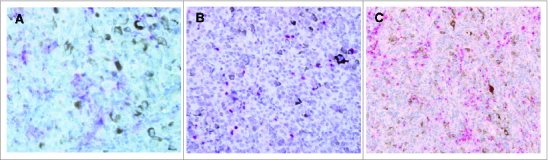
Lymphocytes infiltrating uveal melanomas express CD8, FOXP3 and CCL5. (A–C.) Immunohistochemical (IHC) analysis of formalin-fixed paraffin embedded uveal melanoma patient samples for the expression of the indicated marker. Antibody staining was detected using ChromoMap Fast Red chromogenic substrate. Representative results are shown. (A) Example of IHC staining using anti-CD8 antibody at 40 magnification and exhibiting membranous staining. (B) Example of IHC staining using anti-FOXP3 antibody at 40× magnification and exhibiting nuclear staining. (C) Example of IHC using anti-CCL5 antibody at 20 magnification. The red chromogen highlights the cytoplasm of CCL5-positive lymphocytes, which are seen infiltrating the CCL5-negative melanoma cells.
Figure 3.
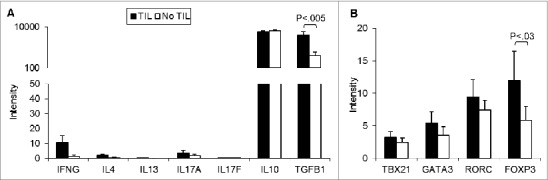
Patient uveal melanomas with and without tumor-infiltrating lymphocytes express similar T helper cell gene expression profiles. (A) T helper (Th) cytokine (A) and Th transcription factor (B) transcript expression intensity of uveal melanomas with tumor-infiltrating lymphocytes (TILs; n = 27) compared to tumors without (n = 30). RNA was extracted from tumor specimens and gene expression profiling performed using Illumina Sentrix 8 BeadChip arrays. Bars represent the mean ± SEM. Statistical analysis was performed using a 2-sided Student's t tests after log transformation and the P-values were adjusted for multiple testing according to the methods of Benjamini and Hochberg. Brackets indicate statistically significant differences between the groups with the P-value indicated above.
Figure 4.
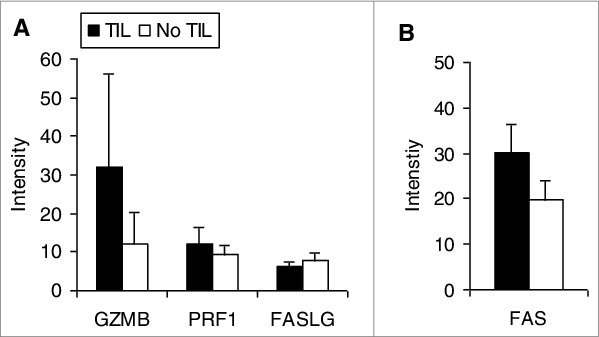
Transcriptional analysis of mediators of lymphocyte cytotoxicity in uveal melanoma patient samples. Expression intensity of the transcripts of mediators of lymphocyte cytotoxicity of uveal melanomas with tumor-infiltrating lymphocytes (TILs; n = 27) compared to tumors without (n = 30). RNA was extracted from tumor specimens and gene expression profiling performed using Illumina Sentrix 8 BeadChip arrays. Bars represent the mean ± SEM. Statistical analysis was performed using a 2-sided Student's t tests after log transformation and the P-values were adjusted for multiple testing according to the methods of Benjamini and Hochberg; P-values were >0 .05 for all comparisons.
Several negative immune regulators were more highly expressed in tumors with TILs (Fig. 5A) relative to TIL-negative patient samples. These included INDO as well as PDCA1 (programmed death-1; PD-1), CTLA4 (cytotoxic T-lymphocyte antigen 4), and LAG3 (lymphocyte-activation gene 3). The CTLA4 ligand CD86 was also higher in tumors with TILs whereas the PD-1 ligand PD-1L and the CTLA4 ligand CD80 were not. Given that TIL-positive tumors were characterized by increases in CD8 and FOXP3 expression, as well as higher transcript levels for IFNG, INDO and LAG3, the possibility that CD8+ Treg cells were involved was examined by assessing non-classical MHC molecules recognized by CD8+ Treg cells (Fig. 4B). The expression of HLA-E, but not HLA-F and HLA-G, was higher in tumors with lymphocytic infiltration versus those without (Fig. 5B).
Figure 5.
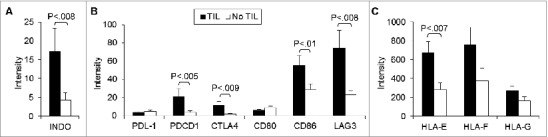
T cell immune checkpoint molecules and negative regulators are differentially expressed in uveal melanoma tumor specimens. Expression intensity of the transcripts of (A) negative immune regulators, (B) their ligands, and (C) non-classical MHC Class I targets of tumors with tumor-infiltrating lymphocytes (TILs; n = 27) compared to tumors without (n = 30). RNA was extracted from tumor specimens and gene expression profiling performed using Illumina Sentrix 8 BeadChip arrays. Bars represent the mean ± SEM. Statistical analysis was performed using a 2-sided Student's t tests after log transformation and the P-values were adjusted for multiple testing according to the methods of Benjamini and Hochberg; brackets indicate statistically significant differences between the groups with the P-value indicated above.
The expression of various chemokines and chemokine receptors with and without TILs is summarized in Table 1. Most C-C and C-X-C motif chemokine transcripts assessed were present in all tumors with TILs. These included CCL2, CCL3, CCL4, CCL5, CXCL9, and CXCL10. Only CCL4 (macrophage inflammatory protein-1β) and CCL5 (RANTES), however, were higher in tumors with TILs compared to tumors without TILs. That TILs expressed CCL5 was confirmed by IHC (Fig. 2C). Although expression was lacking in approximately 20% of tumors with TILs, higher levels of CCL20 (macrophage inflammatory protein-3a/liver and activation-regulated chemokine) were also observed. Correlations between CD8 and all chemokines tested were evaluated. CCL5 expression was the most strongly correlated (Fig. 6). Transcripts of C-C motif and C-X-C motif chemokine receptors were not detected in most tumors, and differential expression was not apparent.
Table 1.
Chemokine and chemokine receptor expression of tumors with and without TILs
| No TILs (n = 30) |
TILs (n = 27) |
||||
|---|---|---|---|---|---|
| SYMBOL | n* (%) | Median | n* (%) | Median | P** |
| CCL1 | 4 (13) | 0 | 5 (19) | 0 | 0.8 |
| CCL2 | 28 93) | 16.9 | 26 (96) | 24.4 | 0.2 |
| CCL3 | 26 87) | 7.5 | 27 (100) | 8.4 | 0.5 |
| CCL4 | 28 (93) | 10.9 | 27 (100) | 18.4 | 0.01 |
| CCL5 | 30 (100) | 59.5 | 27 (100) | 201.5 | 0.009 |
| CCL7 | 6 (20) | 0 | 4 (15) | 0 | 0.2 |
| CCL8 | 30 (100) | 24.4 | 27 (100) | 25.2 | 0.9 |
| CCL11 | 6 (20) | 0 | 5 (19) | 0 | 0.4 |
| CCL13 | 20 (67) | 3.5 | 17 (63) | 2.6 | 0.5 |
| CCL15 | 7 (23) | 0 | 2 (7) | 0 | 0.3 |
| CCL16 | 12 (40) | 0 | 16 (59) | 0.1 | 0.1 |
| CCL17 | 15 (50) | 0.1 | 13 (48) | 0 | 0.5 |
| CCL18 | 10 (33) | 0 | 10 (37) | 0 | 0.6 |
| CCL19 | 29 (97) | 7.7 | 27 (100) | 8.0 | 0.5 |
| CCL20 | 17 (57) | 2.1 | 21 (78) | 6.8 | 0.02 |
| CCL21 | 24 (80) | 3.9 | 23 (85) | 6.0 | 0.6 |
| CCL22 | 1 (3) | 0 | 2 (7) | 0 | 0.8 |
| CCL23 | 30 (100) | 31.7 | 27 (100) | 38.6 | 0.2 |
| CCL24 | 4 (13) | 0 | 3 (11) | 0 | 0.6 |
| CCL25 | 20 (67) | 1.2 | 16 (59) | 0.8 | 0.6 |
| CCL26 | 27 (90) | 6.3 | 27 (100) | 6.0 | 0.5 |
| CCL27 | 13 (43) | 0 | 15 (56) | 1.5 | 0.7 |
| CCL28 | 23 (77) | 16.9 | 24 (89) | 18.5 | 0.5 |
| CCR1 | 28 (93) | 7.3 | 26 (96) | 12.5 | 0.2 |
| CCR2 | 14 (47) | 0 | 12 (44) | 0 | 0.2 |
| CCR3 | 7 (23) | 0 | 4 (15) | 0 | 0.3 |
| CCR4 | 9 (30) | 0 | 7 (26) | 0 | 0.3 |
| CCR5 | 4 (13) | 0 | 12 (44) | 0 | 0.06 |
| CCR6 | 20 (67) | 3.1 | 16 (59) | 0.9 | 0.1 |
| CCR7 | 23 (77) | 6.2 | 23 (85) | 5.1 | 0.4 |
| CCR8 | 15 (50) | 0 | 7 (26) | 0 | 0.4 |
| CCR9 | 18 (60) | 1.1 | 21 (78) | 2.5 | 0.6 |
| CCR10 | 27 (90) | 7.7 | 21 (78) | 7.1 | 0.2 |
| CXCL1 | 10 (33) | 0 | 8 (30) | 0 | 0.3 |
| CXCL2 | 12 (40) | 0 | 14 (52) | 0.3 | 0.5 |
| CXCL3 | 18 (60) | 2.8 | 15 (56) | 0.2 | 0.4 |
| CXCL4 | 3 (10) | 0 | 2 (7) | 0 | 0.4 |
| CXCL5 | 3 (10) | 0 | 2 (7) | 0 | 0.9 |
| CXCL6 | 14 (47) | 0 | 13 (48) | 0 | 0.1 |
| CXCL8 | 29 (97) | 12.6 | 25 (93) | 10.5 | 0.6 |
| CXCL9 | 21 (70) | 4.6 | 18 (67) | 6.3 | 0.4 |
| CXCL10 | 30 (100) | 21.5 | 27 (100) | 18.6 | 0.9 |
| CXCL11 | 7 (23) | 0 | 23 (85) | 0 | 0.4 |
| CXCL12 | 28 (93) | 11.3 | 27 (100) | 20.0 | 0.5 |
| CXCL13 | 5 (17) | 0 | 7 (26) | 0 | 0.2 |
| CXCL14 | 30 (100) | 62.3 | 27 (100) | 61.4 | 0.2 |
| CXCL16 | 30 (100) | 173.6 | 27 (100) | 211.2 | 0.2 |
| CXCL17 | 26 (87) | 4.1 | 25 (93) | 4.9 | 0.4 |
| CXCR1 | 11 (7) | 0 | 12 (44) | 0 | 0.9 |
| CXCR2 | 30 (100) | 14.2 | 27 (100) | 9.9 | 0.5 |
| CXCR3 | 13 (43) | 0 | 17 (63) | 1.2 | 0.08 |
| CXCR4 | 16 (53) | 0.8 | 18 (67) | 3.7 | 0.2 |
| CXCR5 | 30 (100) | 11.6 | 27 (100) | 10.8 | 0.02 |
| CXCR6 | 20 (67) | 1.1 | 17 (63) | 1.6 | 0.3 |
| CXCR7 | 30 (100) | 63.0 | 26 (96) | 36.8 | 0.4 |
| CX3CL1 | 26 (87) | 21.4 | 25 (93) | 19.5 | 0.7 |
| CX3CR1 | 29 (97) | 13.6 | 27 (100) | 15.0 | 0.7 |
| XCL1 | 14 (47) | 0 | 9 (33) | 0 | 0.2 |
| XCR1 | 28 (93) | 3.20 | 22 (81) | 3.8 | 0.5 |
*Number of tumors with detectable expression.
**Adjusted P value, expression levels of tumors with vs. without TILs.
Figure 6.
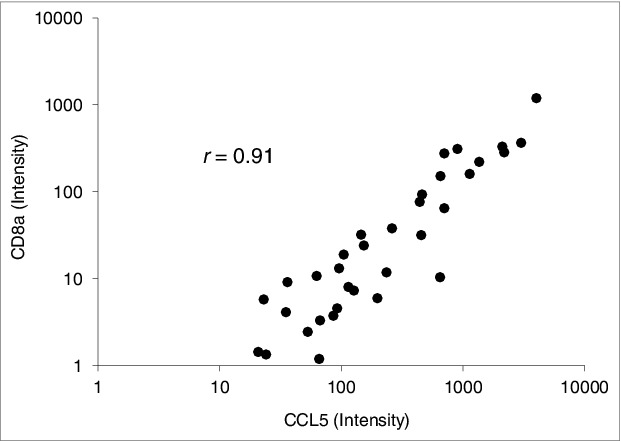
CD8A and CCL5 transcriptional correlation in uveal melanoma patient specimens. Spearman rank correlation analysis shows a correlation between CCL5 and CD8A mRNA expression intensity in primary enucleated uveal melanoma patient tumor specimens (n = 57); r value was significant at 0.91.
Discussion
In contrast to several other cancer types in which infiltrating lymphocytes are a good prognostic indicator, the presence of TILs in uveal melanoma confers a poor prognosis. Molecular profiling performed here supports the existence of an immunosuppressive, tumor-promoting microenvironment in uveal melanoma tumors with infiltrating lymphocytes. Transcripts of the immunosuppressive molecules TGFβ and INDO, potentially arising from a variety of cell types present in the tumor microenvironment, were increased in tumors with infiltrating lymphocytes. We also detected an increase in transcripts encoding CTLA-4, PD-1, and LAG‑3, cell-intrinsic negative regulatory molecules that regulate T cells to promote tumor immune escape.25 All 3 have also been implicated in CD8+ T-cell exhaustion and in inhibiting the accumulation of self-reactive CD8+ T cells.26 IFNγ (IFNG) transcripts were also increased. While a central supporter of antitumor Th1-associated cellular immunity, not only can IFNγ promote non-classical MHC expression, it can also induce the expression of inhibitory molecules, including INDO, transcripts of which were also increased.27 In fact, IFNγ can inhibit immunotherapy by inducing apoptosis of CD4+ T cells.28 Furthermore, uveal melanoma cells treated with IFNγ resist lymphocytic granule-mediated target cell lysis.29 That the Th1-associated transcription factor, TBX21, was not differentially expressed would also be consistent with the lack of an antitumor Th1-associated response.30 HLA-E expression, which also characterized tumors infiltrated by lymphocytes, has been implicated in cancer cell escape from immunosurveillance as a consequence of its capacity to bind CD8+ Tregs as well as inhibitory NK cell receptors.31 The increase in HLA-E, which is expressed low levels by many tissues, but not HLA-G, another non-classical MHC target of CD8+ Treg cells, parallels independent studies of uveal melanoma cells lines in vitro in which HLA-E is expressed and further enhanced by IFNγ treatment, whereas HLA-G is neither expressed nor enhanced by IFNγ.32
Although CD4 expression was observed and did predominate in some tumors, TILs were predominantly CD8+ as supported by the gene expression profiling and confirmed by IHC, findings consistent with previous reports.8-12 The increases in FOXP3, IFNG, TGFB1, INDO, LAG3, and HLA-E suggest that tumor-infiltrating CD8+ cells may function as Tregs. An important contribution to immune privilege of the eye is a unique immune deviation that is elicited when antigens are introduced into the anterior chamber. This immunogenic stimulus induces the appearance of CD8+ Tregs that can inhibit both Th1- and Th2-associated immune responses.33,34 CD8+ Tregs can suppress immunity directly by killing immune cells or indirectly by eliciting the production of immunosuppressive molecules, such as TGFβ and INDO.35 CD8+ Tregs have been shown to accumulate in several cancers, including prostate, ovarian, kidney, and colon.36-39 The presence of CD8+ cells in uveal melanoma, in particular, has been associated with lower metastasis-free survival.40
Transcripts of several C-C and C-X-C chemokines were highly expressed in tumors infiltrated with lymphocytes. CCL4, CCL5, and CCL20 were among those differentially expressed. Levels of CCL5, in particular were most strongly correlated with levels of CD8A. Tumor bearing eyes of patients afflicted with uveal melanoma have been reported to have higher vitreal concentrations of CCL4 and CCL5.41 Although CCL4 and CCL5 can promote Th1-associated antitumor responses,42-44 both have been implicated in immunosuppression and tumor progression.45 CCL4 secretion by CD8+ Tregs has been shown to inhibit T-cell activation by interfering with T cell receptor signaling.46 CCL5 has also been implicated in the recruitment and generation of CD8+ Treg cells.47 Further supporting this line of reasoning, melanoma-induced CCL5 production by infiltrating CD8+ cells has been shown to activate an apoptotic pathway in TILs48 and CCL4 has been evidenced to trigger TIL cell death.48 CCL20, the other chemokine transcriptionally upregulated in uveal melanoma with infiltrating lymphocytes, has been implicated in the recruitment of FOXP3+49 Tregs. We did not observe increases in transcripts of CXCL12, levels of which are also higher in the aqueous of eyes with melanoma.50 CXCL12 has been shown to repel tumor-specific effector T cells and recruit suppressive cell populations at tumor sites, including Tregs.,51,52 Differential expression of CCL2, CCL3, CXCL8, and CXCL10, which have also been reported to be present in higher concentrations in uveal melanoma-associated vitreous, was also not observed.40 Neither did we detect marked differential expression of chemokine receptors. More tumors with lymphocytic infiltrates expressed measurable CCR5 transcripts, the CCL5 receptor, albeit at low levels. Transcripts of other chemokine receptors for CCL4, CCL5, and CCL20 were also infrequently expressed, such as CCR3 and CCR4, or were not differentially expressed, such as CCR1 and CCR6. Of note, most of the genes encoding CCRs, including CCR1 to CCR9, have been mapped to chromosome 3, a chromosome frequently lost in uveal melanoma and associated with the development of metastatic death.53
The cellular source of the immune factors identified and the functional activities of TILs within uveal melanomas merit further study. There is increasing interest in characterizing TILs as biomarkers in cancer immunotherapy as well as targets for immune manipulation. TILs are further undergoing evaluation as a source of cells for adoptive immunotherapy.54 Recent clinical cancer immunotherapy trials have included pre-treatment tumor gene expression profiling, and clinical benefit has been shown to correlate with a gene signature that included T-cell and chemokine markers. High expression of CCL5, CXCL9, and CXCL10 were found to be associated with a favorable clinical outcome in patients with cutaneous melanoma administered a melanoma vaccine.55 Thus, characterization of TILs could lead to an improvement in the clinical efficacy of cancer immunotherapy, by permitting the selection of patients most likely to have a beneficial response. Further investigations of TILs may also help identify the main factors that make immune modulation ineffective and suggest specific manipulations. For example, CD8+ Tregs are potentially modifiable by blockade of LAG-3 interactions and a blocking LAG-3 immunoglobulin fusion protein is currently being evaluated in clinical trials.56 Chemokine inhibitors, such as a CCL5 antagonist, may be potent immune-modifying agents with potential therapeutic benefit and are also under development.57
Materials and Methods
Uveal melanoma patient samples and pathological examination
Tumors from 57 patients with uveal melanoma treated by enucleation at the Cleveland Clinic Cole Eye Institute were evaluated in this investigation. The study was approved by the Institutional Review Board, according to the tenets of the Declaration of Helsinki. Immediately following enucleation, transillumination was used to mark the tumor margins. Dissection was carried out through a scleral flap overlying the tumor base. Portions of each sample were processed for cryopreservation and genomic analyses, and the remainder of the eye was processed for conventional histopathology. The globe was fixed in 10% neutral buffered formalin and embedded in paraffin, after which hematoxylin and eosin-stained 4-μm sections were prepared. The tumor was examined for known histopathologic prognostic features for uveal melanoma, including the presence or absence of TILs, which was defined on the basis of more than 100 lymphocytes in 20 high power (40) fields.24
Gene expression array
Pieces of fresh or frozen tumor tissue, 2 to 3 mm2, were cut from the original sample and transferred immediately to 1 mL Trizol reagent. Total RNA was purified using a RNeasy MiniElute Cleanup Kit (Qiagen) as per manufacturer's instructions. The concentration of the purified total RNA samples was measured using a Quant-It RiboGreen RNA Assay Kit (Molecular Probes, Inc.) and a fluorimeter. To synthesize first and second strand cDNA and amplify biotinylated cRNA from the total RNA, an Illumina Totalprep RNA Amplification Kit was used according to the manufacturer's instructions. The purified cRNA samples were quantified to determine the volume required for the BeadChip hybridization step via the Quant-iT RiboGreen RNA Assay Kit. Hybridization to the Illumina Sentrix 8 BeadChip, which assesses 24,000 transcripts, was performed according to the manufacturer's instructions without modification (Illumina). The Sentrix 8 BeadChips were read using an Illumina Beadarray reader.
Immunohistochemistry
IHC was performed on 4 μm sections of formalin-fixed paraffin-embedded tissues of selected cases using a Discovery XT automated stainer (Ventana Medical Systems). Antigen retrieval consisted of CC1 (Tris/Borate/EDTA buffer, pH 8.0–8.5) (Ventana Medical Systems) for 8 min at 95°C, 28 min at 100°C, and then an 8 min cool down to 37°C. The slides were then incubated with an anti-CD8 mouse monoclonal antibody (1:10 dilution, clone ID: 1A5, Catalog Number MU422-UC, Biogenex) for one hour at 37°C. A secondary antibody (UltraMap anti-Mouse AP) was applied for 12 min at 37°C. The chromogenic substrate (ChromoMap Fast Red) was applied for 16 min at 37°C after 4 min of Activator Red and Naphthol. Slides were counterstained with Hematoxylin II. A similar process for FOXP3 was performed using anti-FOXP3 mouse monoclonal antibody (1:50 dilution, clone ID: 236A/E7, Catalog Number 14–4777–82, eBIOSCIENCES) except that the anti-FOXP3 was applied for one hour. RANTES/CCL5 antibody (1:100 dilution, rabbit polyclonal antibody, P20, catalog number 2988, Cell Signaling) was applied for 12 hours at 25°C. A secondary antibody (UltraMap anti-rabbit AP) was applied for 32 min at 37°C. Next, 4 min of combined Activator Red and Naphthol were applied and then rinsed off. The chromogenic substrate (ChromoMap Fast Red) was applied for 16 min at 37°C. Slides were counterstained with Hematoxylin II.
Data analysis
Analysis and normalization of expression data were carried out using BeadStudio 2.0 (Illumina). Expression intensities of 91 lymphocyte-associated factors were evaluated. Expression intensity below background in a sample was considered to be absent (0). Error bars represent standard error. Differences in expression intensities between tumors with and without TILs were analyzed using 2-sided Student's t tests after log transformation. The P-values were adjusted for multiple testing according to the methods of Benjamini and Hochberg.58 Comparisons that exhibited an adjusted P-value < 0.05 were called differentially expressed. Correlations were assessed using Spearman rank correlations and P < 0.05 was considered statistically significant.
Funding Statement
This work was supported in part by RO1CA136776 from the National Cancer Institute, National Institutes of Health, Bethesda, MD, and by a grant from the Falk Medical Trust, Chicago, IL.
Disclosure of Potential Conflicts of Interest
No potential conflicts of interest were disclosed.
References
- 1.Tuthill RJ, Unger JM, Liu PY, Flaherty LE, Sondak VK, Southwest Oncology Group . Risk assessment in localized primary cutaneous melanoma: a Southwest Oncology Group study evaluating nine factors and a test of the Clark logistic regression prediction model. Am J Clin Pathol 2002; 118:504-11; PMID: 12375635; 10.1309/WBF7-N8KH-71KT-RVQ9 [DOI] [PubMed] [Google Scholar]
- 2.Al-Shibli KI, Donnem T, Al-Saad S, Persson M, Bremnes RM, Busund LT. Prognostic effect of epithelial and stromal lymphocyte infiltration in non-small cell lung cancer. Clin Cancer Res 2008; 14:5220-27; PMID: 18698040; 10.1158/1078-0432.CCR-08-0133 [DOI] [PubMed] [Google Scholar]
- 3.Zhang L, Conejo-Garcia JR, Katsaros D, Gimotty PA, Massobrio M, Regnani G, Makrigiannakis A, Gray H, Schlienger K, Liebman MN, et al. Intratumoral T cells, recurrence, and survival in epithelial ovarian cancer. N Engl J Med 2003; 348:203-213; PMID: 12529460; 10.1056/NEJMoa020177 [DOI] [PubMed] [Google Scholar]
- 4.Singh AD, Shields CL, Shields JA. Prognostic factors in uveal melanoma. Melanoma Res 2001; 11:255-63; PMID: 11468514; 10.1097/00008390-200106000-00007 [DOI] [PubMed] [Google Scholar]
- 5.Ericsson C, Seregard S, Bartolazzi A, Levitskaya E, Ferrone S, Kiessling R, Larsson O. Association of HLA class I and class II antigen expression and mortality in uveal melanoma. Invest Ophthalmol Vis Sci 2001; 42:2153-6; PMID: 11527924 [PubMed] [Google Scholar]
- 6.Blom DJ, Luyten GP, Mooy C, Kerkvliet S, Zwinderman AH, Jager MJ. Human leukocyte antigen class I expression: marker of poor prognosis in uveal melanoma. Invest Ophthalmol Vis Sci 1997; 38:1865-72; PMID: 9286277 [PubMed] [Google Scholar]
- 7.Bröcker EB, Suter L, Brüggen J, Ruiter DJ, Macher E, Sorg C. Phenotypic dynamics of tumor progression in human malignant melanoma. Int J Cancer. 1985; 36:29-35; PMID: 3860479; 10.1002/ijc.2910360106 [DOI] [PubMed] [Google Scholar]
- 8.Durie FH, Campbell AM, Lee WR, Damato BE. Analysis of lymphocytic infiltration in uveal melanoma. Invest Ophthalmol Vis Sci 1990; 31:2106-10; PMID: 2211008 [PubMed] [Google Scholar]
- 9.Staibano S, Mascolo M, Tranfa F, Salvatore G, Mignogna C, Bufo P, Nugnes L, Bonavolontà G, De Rosa G. Tumor infiltrating lymphocytes in uveal melanoma: a link with clinical behavior? Int J Immunopathol Pharmacol 2006; 19:171-9; PMID: 16569355 [PubMed] [Google Scholar]
- 10.de Waard-Siebinga I, Hilders CG, Hansen BE, van Delft JL, Jager MJ. HLA expression and tumor-infiltrating immune cells in uveal melanoma. Graefes Arch Clin Exp Ophthalmol 1996; 234:34-42; PMID: 8750848; 10.1007/BF00186516 [DOI] [PubMed] [Google Scholar]
- 11.Meecham WJ, Char DH, Kaleta-Michaels S. Infiltrating lymphocytes and antigen expression in uveal melanoma. Ophthalmic Res 1992; 24:20-6; PMID: 1608588; 10.1159/000267140 [DOI] [PubMed] [Google Scholar]
- 12.Bronkhorst IH, Vu TH, Jordanova ES, Luyten GP, Burg SH, Jager MJ. Different subsets of tumor-infiltrating lymphocytes correlate with macrophage influx and monosomy 3 in uveal melanoma. Invest Ophthalmol Vis Sci 2012; 3:5370-8; PMID: 22743317; 10.1167/iovs.11-9280 [DOI] [PubMed] [Google Scholar]
- 13.Chen PW, Mellon JK, Mayhew E, Wang S, He YG, Hogan N, Niederkorn JY. Uveal melanoma expression of indoleamine 2,3-deoxygenase: establishment of an immune privileged environment by tryptophan depletion. Exp Eye Res 2007; 5:617-25; PMID: 17870068; 10.1016/j.exer.2007.07.014 [DOI] [PMC free article] [PubMed] [Google Scholar]
- 14.Esser P, Grisanti S, Bartz-Schmidt K. TGF-beta in uveal melanoma. Microsc Res Tech 2001; 2:396-400; PMID: 11170298; [DOI] [PubMed] [Google Scholar]
- 15.Lagouros E, Salomao D, Thorland E, Hodge DO, Vile R, Pulido JS. Infiltrative T regulatory cells in enucleated uveal melanomas. Trans Am Ophthalmol Soc 2009; 107:223-8; PMID: 20126498 [PMC free article] [PubMed] [Google Scholar]
- 16.Mougiakakos D, Johansson CC, Trocme E, All-Ericsson C, Economou MA, Larsson O, Seregard S, Kiessling R. Intratumoral forkhead box P3-positive regulatory T cells predict poor survival in cyclooxygenase-2-positive uveal melanoma. Cancer 2010; 11:2224-33; PMID: 20209608 [DOI] [PubMed] [Google Scholar]
- 17.Richmond A, Yang J, Su Y. The good and the bad of chemokineschemokine receptors in melanoma. Pigment Cell Melanoma Res 2009; 22:175-86; PMID: 19222802; 10.1111/j.1755-148X.2009.00554.x [DOI] [PMC free article] [PubMed] [Google Scholar]
- 18.Harlin H, Meng Y, Peterson AC, Zha Y, Tretiakova M, Slingluff C, McKee M, Gajewski TF. Chemokine expression in melanoma metastases associated with CD8+ T-cell recruitment. Cancer Res 2009; 69:3077-85; PMID: 19293190; 10.1158/0008-5472.CAN-08-2281 [DOI] [PMC free article] [PubMed] [Google Scholar]
- 19.Monteagudo C, Martin JM, Jorda E, Llombart-Bosch A. CXCR3 chemokine receptor immunoreactivity in primary cutaneous malignant melanoma: correlation with clinicopathological prognostic factors. J Clin Pathol 2007; 60:596-9; PMID: 16522748; 10.1136/jcp.2005.032144 [DOI] [PMC free article] [PubMed] [Google Scholar]
- 20.Li H, Alizadeh H, Niederkorn JY. Differential expression of chemokine receptors on uveal melanoma cells and their metastases. Invest Ophthalmol Vis Sci 2008; 49:636-43; PMID: 18235009; 10.1167/iovs.07-1035 [DOI] [PubMed] [Google Scholar]
- 21.Scala S, Ieranò C, Ottaiano A, Franco R, La Mura A, Liguori G, Mascolo M, Staibano S, Ascierto PA, Botti G, et al. CXC chemokine receptor 4 is expressed in uveal malignant melanoma and correlates with the epithelioid-mixed cell type. Cancer Immunol Immunother 2007; 56:1589-95; PMID: 17410362; 10.1007/s00262-007-0303-6 [DOI] [PMC free article] [PubMed] [Google Scholar]
- 22.Franco R, Botti G, Mascolo M, Loquercio G, Liguori G, Ilardi G, Losito S, La Mura A, Calemma R, Ierano C, et al. “CXCR4-CXCL12 and VEGF correlate to uveal melanoma progression”. Front Biosci (Elite Ed) 2010; 2:13-21; PMID: 20036848; 10.2741/e60 [DOI] [PubMed] [Google Scholar]
- 23.Zitvogel L, Kepp O, Aymeric L, Ma Y, Locher C, Delahaye NF, André F, Kroemer G. Integration of host-related signatures with cancer cell-derived predictors for the optimal management of anticancer chemotherapy. Cancer Res 2010; 70:9538-43; PMID: 21098713; 10.1158/0008-5472.CAN-10-1003 [DOI] [PubMed] [Google Scholar]
- 24.de la Cruz PO, Specht CS, McLean IW. Lymphocytic infiltration in uveal malignant melanoma. Cancer 1990; 65:112-115; PMID: 2293857; [DOI] [PubMed] [Google Scholar]
- 25.Woo SR, Turnis ME, Goldberg MV, Bankoti J, Selby M, Nirschl CJ, Bettini ML, Gravano DM, Vogel P, Liu CL, et al. Immune inhibitory molecules LAG-3 and PD-1 synergistically regulate T-cell function to promote tumoral immune escape. Cancer Res 2012; 72:917-27; PMID: 22186141; 10.1158/0008-5472.CAN-11-1620 [DOI] [PMC free article] [PubMed] [Google Scholar]
- 26.Lucas CL, Workman CJ, Beyaz S, LoCascio S, Zhao G, Vignali DA, Sykes M. LAG-3, TGF-β, and cell-intrinsic PD-1 inhibitory pathways contribute to CD8 but not CD4 T-cell tolerance induced by allogeneic BMT with anti-CD40L. Blood 2011; 117:5532-40; PMID: 21422469; 10.1182/blood-2010-11-318675 [DOI] [PMC free article] [PubMed] [Google Scholar]
- 27.Wilke CM, Wei S, Wang L, Kryczek I, Kao J, Zou W. Dual biological effects of the cytokines interleukin-10 and interferon-γ. Cancer Immunol Immunother 2011; 60:1529-41; PMID: 21918895; 10.1007/s00262-011-1104-5 [DOI] [PMC free article] [PubMed] [Google Scholar]
- 28.Berner V, Liu H, Zhou Q, Alderson KL, Sun K, Weiss JM, Back TC, Longo DL, Blazar BR, Wiltrout RH, et al. IFN-gamma mediates CD4+ T-cell loss and impairs secondary antitumor responses after successful initial immunotherapy. Nat Med 2007; 13:354-60; PMID: 17334371; 10.1038/nm1554 [DOI] [PubMed] [Google Scholar]
- 29.Hallermalm K, Seki K, De Geer A, Motyka B, Bleackley RC, Jager MJ, Froelich CJ, Kiessling R, Levitsky V, Levitskaya J. Modulation of the tumor cell phenotype by IFN-gamma results in resistance of uveal melanoma cells to granule-mediated lysis by cytotoxic lymphocytes. J Immunol 2008; 180:3766-74; PMID: 18322182; 10.4049/jimmunol.180.6.3766 [DOI] [PubMed] [Google Scholar]
- 30.Werneck MB, Lugo-Villarino G, Hwang ES, Cantor H, Glimcher LH. T-bet plays a key role in NK-mediated control of melanoma metastatic disease. J Immunol 2008; 180:8004-10; PMID: 18523263; 10.4049/jimmunol.180.12.8004 [DOI] [PMC free article] [PubMed] [Google Scholar]
- 31.Pietra G, Romagnani C, Manzini C, Moretta L, Mingari MC. The emerging role of HLA-E-restricted CD8+ T lymphocytes in the adaptive immune response to pathogens and tumors. J Biomed Biotechnol 2010; 2010:907092; PMID: 20634877; 10.1155/2010/907092 [DOI] [PMC free article] [PubMed] [Google Scholar]
- 32.Hurks HM, Valter MM, Wilson L, Hilgert I, van den Elsen PJ, Jager MJ. Uveal melanoma: no expression of HLA-G. Invest Ophthalmol Vis Sci. 2001; 42:3081-4; PMID: 11726606 [PubMed] [Google Scholar]
- 33.Niederkorn JY. See no evil, hear no evil, do no evil: the lessons of immune privilege. Nat Immunol 2006; 7:354-9; PMID: 16550198; 10.1038/ni1328 [DOI] [PubMed] [Google Scholar]
- 34.Niederkorn JY. Emerging concepts in CD8(+) T regulatory cells. Curr Opin Immunol. 2008; 20:327-31; PMID: 18406591; 10.1016/j.coi.2008.02.003 [DOI] [PMC free article] [PubMed] [Google Scholar]
- 35.Vlad G, Suciu-Foca N. Resurgence or emergence of CD8+ Ts. Hum Immunol 2008; 69:679-80; PMID: 19026353; 10.1016/j.humimm.2008.10.010 [DOI] [PubMed] [Google Scholar]
- 36.Kiniwa Y, Miyahara Y, Wang HY, Peng W, Peng G, Wheeler TM, Thompson TC, Old LJ, Wang RF. CD8+ Foxp3+ regulatory T cells mediate immunosuppression in prostate cancer. Clin Cancer Res. 2007; 13:6947-58; PMID: 18056169; 10.1158/1078-0432.CCR-07-0842 [DOI] [PubMed] [Google Scholar]
- 37.Wei S, Kryczek I, Zou L, Daniel B, Cheng P, Mottram P, Curiel T, Lange A, Zou W. Plasmacytoid dendritic cells induce CD8+ regulatory T cells in human ovarian carcinoma. Cancer Res 2005; 65:5020-6; PMID: 15958543; 10.1158/0008-5472.CAN-04-4043 [DOI] [PubMed] [Google Scholar]
- 38.Attig S, Hennenlotter J, Pawelec G, Klein G, Koch SD, Pircher H, Feyerabend S, Wernet D, Stenzl A, Rammensee HG, et al. Simultaneous infiltration of polyfunctional effector and suppressor T cells into renal cell carcinomas. Cancer Res 2009; 69:8412-9; PMID: 19843860; 10.1158/0008-5472.CAN-09-0852 [DOI] [PubMed] [Google Scholar]
- 39.Chaput N, Louafi S, Bardier A, Charlotte F, Vaillant JC, Ménégaux F, Rosenzwajg M, Lemoine F, Klatzmann D, Taieb J. Identification of CD8+CD25+Foxp3 +suppressive T cells in colorectal cancer tissue. Gut 2009; 58:520-9; PMID: 19022917; 10.1136/gut.2008.158824 [DOI] [PubMed] [Google Scholar]
- 40.Anastassiou G, Coupland SE, Stang A, Boeloeni R, Schilling H, Bornfeld N. Expression of Fas and Fas ligand in uveal melanoma: biological implication and prognostic value. J Pathol 2001; 194:466-72; PMID: 11523055; 10.1002/path.926 [DOI] [PubMed] [Google Scholar]
- 41.Nagarkatti-Gude N, Bronkhorst IH, van Duinen SG, Luyten GP, Jager MJ. Cytokines and chemokines in the vitreous fluid of eyes with uveal melanoma. Invest Ophthalmol Vis Sci 2012; 53:6748-55; PMID: 22930720; 10.1167/iovs.12-10123 [DOI] [PubMed] [Google Scholar]
- 42.Kim JJ, Yang JS, Dentchev T, Dang K, Weiner DB. Chemokine gene adjuvants can modulate immune responses induced by DNA vaccines. J Interferon Cytokine Res 2000; 20:487-98; PMID: 10841077; 10.1089/10799900050023906 [DOI] [PubMed] [Google Scholar]
- 43.Luther SA, Cyster JG. Chemokines as regulators of T cell differentiation. Nat Immunol 2001; 2:102-7; PMID: 11175801; 10.1038/84205 [DOI] [PubMed] [Google Scholar]
- 44.Zou W, Borvak J, Marches F. Macrophage-derived dendritic cells have strong Th1-polarizing potential mediated by beta-chemokines rather than IL-12. J Immunol 2000; 165:4388-96; PMID: 11035076; 10.4049/jimmunol.165.8.4388 [DOI] [PubMed] [Google Scholar]
- 45.van Deventer HW, O’Connor W Jr, Brickey WJ, Aris RM, Ting JP, Serody JS. C-C chemokine receptor 5 on stromal cells promotes pulmonary metastasis. Cancer Res 2005; 65:3374-9; PMID: 15833871 [DOI] [PubMed] [Google Scholar]
- 46.Joosten SA, van Meijgaarden KE, Savage ND, de Boer T, Triebel F, van der Wal A, de Heer E, Klein MR, Geluk A, Ottenhoff TH. Identification of a human CD8 +regulatory T cell subset that mediates suppression through the chemokine CC chemokine ligand 4. Proc Natl Acad Sci USA 2007; 104:8029-34; PMID: 17483450; 10.1073/pnas.0702257104 [DOI] [PMC free article] [PubMed] [Google Scholar]
- 47.Faunce DE, Stein-Streilein J. NKT cell-derived RANTES recruits APCs and CD8+ T cells to the spleen during the generation of regulatory T cells in tolerance. J Immunol 2002; 169:31-8; PMID: 12077225; 10.4049/jimmunol.169.1.31 [DOI] [PubMed] [Google Scholar]
- 48.Mellado M, de Ana AM, Moreno MC, Martínez C, Rodríguez-Frade JM. A potential immune escape mechanism by melanoma cells through the activation of chemokine-induced T cell death. Curr Biol 2001; 11:691-6; PMID: 11369232; 10.1016/S0960-9822(01)00199-3 [DOI] [PubMed] [Google Scholar]
- 49.Chen KJ, Lin SZ, Zhou L, Xie HY, Zhou WH, Taki-Eldin A, Zheng SS. Selective recruitment of regulatory T cell through CCR6-CCL20 in hepatocellular carcinoma fosters tumor progression and predicts poor prognosis. PLoS One 2011; 6:e24671; PMID: 21935436; 10.1371/journal.pone.0024671 [DOI] [PMC free article] [PubMed] [Google Scholar]
- 50.Zerbini G, Colucci A, Maestroni A, Miserocchi E, Bandello F, Modorati G. Increased stromal cell-derived factor-1 concentration levels in aqueous from patients with uveal melanoma. Melanoma Res 2012; 22:98-9; PMID: 22228277; 10.1097/CMR.0b013e32834e1f50 [DOI] [PubMed] [Google Scholar]
- 51.Dunussi-Joannopoulos K, Zuberek K, Runyon K, Hawley RG, Wong A, Erickson J, Herrmann S, Leonard JP. Efficacious immunomodulatory activity of the chemokine stromal cell-derived factor 1 (SDF-1): local secretion of SDF-1 at the tumor site serves as T-cell chemoattractant and mediates T-cell-dependent antitumor responses. Blood 2002; 100:1551-8; PMID: 12176869 [PubMed] [Google Scholar]
- 52.Vianello F, Papeta N, Chen T, Kraft P, White N, Hart WK, Kircher MF, Swart E, Rhee S, Palù G, et al. Murine B16 melanomas expressing high levels of the chemokine stromal-derived factor-1CXCL12 induce tumor-specific T-cell chemorepulsion and escape from immune control. J Immunol 2006; 176:2902-14; PMID: 16493048; 10.4049/jimmunol.176.5.2902 [DOI] [PubMed] [Google Scholar]
- 53.Prescher G, Bornfeld N, Hirche H, Horsthemke B, Jockel KH, Becher R. Prognostic implications of monosomy 3 in uveal melanoma. Lancet 1996; 347:1222-5; PMID: 8622452; 10.1016/S0140-6736(96)90736-9 [DOI] [PubMed] [Google Scholar]
- 54.Cipponi A, Wieers G, van Baren N, Coulie PG. Tumor-infiltrating lymphocytes: apparently good for melanoma patients. But why? Cancer Immunol Immunother 2011; 60:1153-60; PMID: 21553145; 10.1007/s00262-011-1026-2 [DOI] [PMC free article] [PubMed] [Google Scholar]
- 55.Gajewski TF, Fuertes M, Spaapen R, Zheng Y, Kline J. Molecular profiling to identify relevant immune resistance mechanisms in the tumor microenvironment. Curr Opin Immunol 2011; 23:286-92; PMID: 21185705; 10.1016/j.coi.2010.11.013 [DOI] [PMC free article] [PubMed] [Google Scholar]
- 56.Goldberg MV, Drake CG. LAG-3 in cancer immunotherapy. Curr Top Microbiol Immunol 2011; 344:269-78; PMID: 21086108; 10.1007/82_2010_114 [DOI] [PMC free article] [PubMed] [Google Scholar]
- 57.Robinson SC, Scott KA, Wilson JL, Thompson RG, Proudfoot AE, Balkwill FR. A chemokine receptor antagonist inhibits experimental breast tumor growth. Cancer Res 2003; 63:8360-5; PMID: 14678997 [PubMed] [Google Scholar]
- 58.Benjamini Y, Hochberg Y. Controlling the false discovery rate: A practical and powerful approach to multiple testing. J R Statist Soc B 1995; 57:289-300. [Google Scholar]