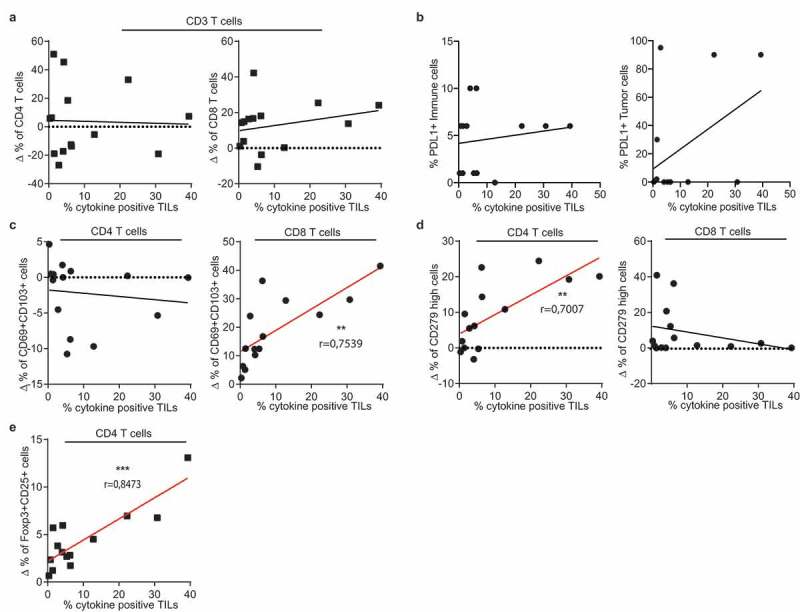
Figure 6.

Tumor-specific T cell infiltrates correlate with cytokine production of the TIL product. Pearson’s correlation of the percentage of cytokine production of expanded T cells as defined in Figure 4 with tumor-specific infiltrates of (a) CD4+ (left panel) CD8+ (right panel) CD3+ T cells, (b) PD-L1 expression on tumor cells and on immune cells, (c) CD69+/CD103+ T cell population within CD4+ (left) and CD8+ (right) T cells, (d) with CD279hi CD4+ T cells (left panel) and CD8+ T cells (right panel), and with (e) with Foxp3+/CD25high CD4+ T cells. (** p < .01;*** p < .001. If no indication, p ≥ 0.05).
